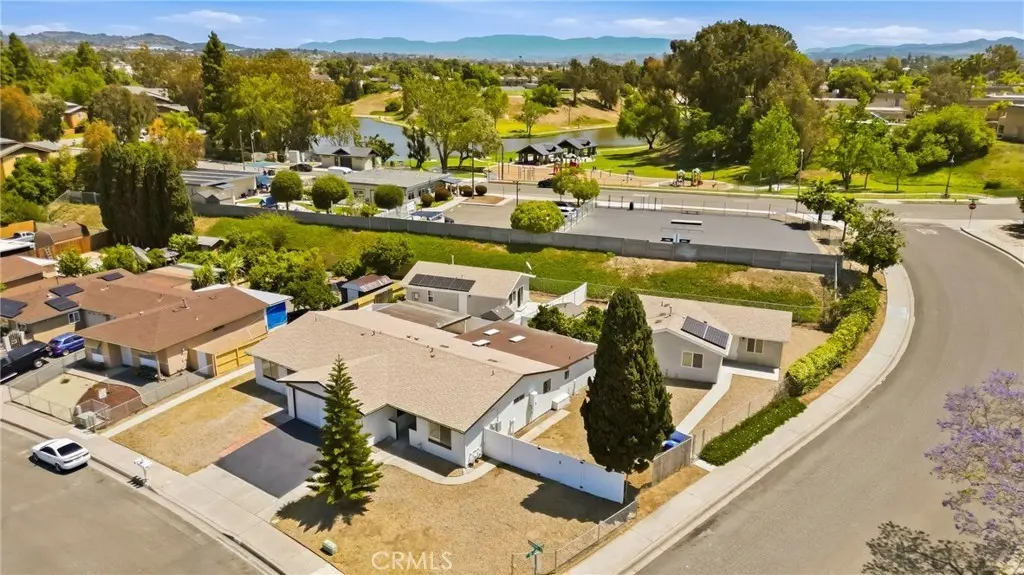
260 Lustrosos St · Oceanside, CA
Flood risk 4/10 · Minor
- FEMA flood zone
- X (shaded)
- Chance of flooding over 30 yrs
- 0.22%
- Est. flood insurance / yr
- $507 – $1,088
Fire risk 4/10 · Minor
- Est. fire insurance / yr
- $659 – $1,223
Heat risk 6/10 · Moderate
- Hot days now (above 87°F)
- 8 days/yr
- Hot days in 30 yrs
- 24 days/yr
Wind risk 1/10 · Minimal
- Chance of severe wind over 30 yrs
- —
Air-quality risk 4/10 · Minor
- Unhealthy air days now
- 5 days/yr
- Unhealthy air days in 30 yrs
- 5 days/yr
Risk factors via First Street. Map © Google.
Why this score? — see what drove the C- grade
The composite is a weighted blend of 9 inputs, each scored 0–100. Each bar is that input's sub-score; the figure is the points it added to the 100-point composite (weight × sub-score).
- Cash flow +19.5/30.0
- ARV discount +9.5/15.0
- DSCR +6.2/10.0
- 1% rule +4.2/10.0
- Schools +3.6/10.0
- Rent growth +3.3/5.0
- Livability +3.2/5.0
- Condition / age +2.5/5.0
- Appreciation +0.0/10.0
$990,000
🖨 Deal sheet (PDF) 📄 Offer letter ✓ Due diligence
Listing remarks MLS
Great Twinhome that needs some TLC. Property has a lot of potential, with an oversized backyard with apple, citrus and pomegranate trees. There are no neighbors to the back of the home. A block away from Libby Lake Park.
Key facts
- Expansive lot
- Detached adu
- Recent upgrades
Tags
Property features AI
Finance
- Other: Two total units
- Financial info: Special assessments
- HOA & community: Community amenities near a lake and park
Exterior
- Parking: Attached garage; Driveway with brick; One parking space / one garage space
- Utilities: Public sewer; District/public water
- Home design: Duplex; Attached property; One story
- Construction: One common wall (attached unit)
- Exterior features: Corner lot; No pool
Interior
- Bedrooms: Five bedrooms on the main level
- Bathrooms: Four full bathrooms on the main level
- Heating & cooling: Central cooling
- Interior features: Single-level home; Front door entry; All bedrooms on the main floor
- Laundry & utility: Washer hookup; Laundry available
Neighborhood map
What this means for you Summary
Snapshot
- This is a 5-bed/4.0-bath single-family listed at $990k.
Deal economics
- At list price, monthly cash flow is $1k ($13k/yr) — positive.
- The deal already cash-flows at list — no discount required.
- To meet the 1% rule (rent ≥ 1% of price), the offer needs to be $908k (8.3% below list).
- Recommended offer: $908k (8.3% below list) — sets the bar for 1% rule.
- Cap rate 7.7% vs local median 2.5% in Oceanside — top-decile yield for the area; either an underpriced asset or a hidden risk that comps aren't pricing in. Stress-test before assuming the spread holds.
Location & tenants
- Location reads 64/100 on livability (#413 in CA) — a middle-class / working-renter tenant base. Strengths: amenities A+, commute A+, employment A; Watch: crime D, cost of living F, health & safety D-.
- Oceanside Unified (suburban): math 31% / reading 51% proficiency, ranked #221 of 517 in CA (top 43%) — families likely to look elsewhere, expect single-tenant / working-renter base with shorter leases.
- Zoned schools: Reynolds Elementary (564 students, 75% FRL); Cesar Chavez Middle (670 students, 85% FRL); El Camino High (math 35% / reading 56%, grade D-, #417 of 1,170 statewide, top 36%, 2,637 students, 66% FRL) — zoned schools average 76% FRL vs 47% district-wide (29 pts higher); higher-poverty schools than district average — tighter screening recommended.
- Market conditions: Rents rising (+3.3%/yr); 246 active listings in the ZIP; 4 comparable units currently listed for rent nearby; rentals at typical pace (median 26d on market — plan ~3-4 weeks tenant-placement turnaround); solid renter incomes; 11,759 units permitted in San Diego County in 2024 (7,244 in 5+ unit buildings).
- At $9,083/mo this rent would consume 100% of the median local household income ($109k/yr) (locally 1509% of renters already pay >50% of income on rent) — very limited rent-growth headroom before tenants either downsize or default.
Forward outlook
- Local home prices are declining (-3.0%/yr); year-one equity from $7k of loan paydown is wiped out by about $30k of value loss. Plan a longer hold.
- San Diego County population projected at +20% by 2050 — long-run rental-demand tailwind backs the buy-and-hold thesis.
Negotiation context
- It's been on market 48 days — a 3% lower offer ($960k) is reasonable based on typical stale-listing flexibility.
- 2 sale attempts since 11y ago; this cycle's ask has dropped $110k (10%) from the opening price — seller is motivated, your offer sets the floor, not the list.
- Current owner paid $240k; list at $990k implies a 312% gain — meaningful room to come down on a strong offer.
Risks & watch-outs
- Climate carrying-cost: extreme-heat days projected 8→24/yr by 2055 (HVAC capex compounding) — expect insurance premiums to compound above CPI over the hold.
Questions for the listing agent
- It's been on market 48 days. Have you received any prior offers? Is the seller open to a 8% concession, seller financing, or rate buy-down credit?
- Is there a deadline driving the sale (1031 exchange, divorce, estate, relocation)? That informs how much negotiation room exists.
- Schools are D-rated, which usually means shorter tenancies and higher turnover. Who's the typical renter profile here, and what's been the actual vacancy rate?
- Crime grade is D in this area — have there been break-ins, vandalism, or insurance claims at this property in the last 3 years? What carrier currently insures it and at what premium?
- What's the average days-on-market for RENTAL listings here right now (not sales)? A rising rental-DOM trend means longer vacancies and softer asking-rent achievability than the comps imply.
- What's the recent tenant-quality profile in this submarket — average credit score on applications, eviction rate, late-payment / NSF rate, and stable-employment percentage? A property-management company in the area should have these aggregated.
- How much new for-sale + rental construction is in the pipeline within 1–3 miles? Heavy new supply typically softens prices + rents 12–24 months out; constrained supply supports both.
Investment metrics
- 1% rule
- 0.92% ✗
- Cap rate
- 7.66%
- Cash-on-cash
- 4.87%
- DSCR
- 1.22
- GRM
- 9.1
CMA / ARV
- ARV (median comp)
- $1,036,315
- List price
- $990,000
- Delta
- -4.47%
- Verdict
- FAIR
- Comps
- 20 within 1.0 mi
Show comp detail 12 sales within ~0.75 mi
| Address | Dist | Beds/Ba | Sqft | Sold | Price | $/sf | Match |
|---|---|---|---|---|---|---|---|
| 4655 Caneel Bay Ct | 0.34mi | 4/3.0 (-1) | 2,309 (+4%) | 2mo | $989,000 | $428 | 68 |
| 4745 Marblehead Bay Dr | 0.35mi | 4/3.0 (-1) | 2,396 (+8%) | 2mo | $1,075,000 | $449 | 61 |
| 4856 Cardiff Bay Dr | 0.55mi | 5/3.0 | 2,428 (+9%) | 2mo | $1,125,000 | $463 | 53 |
| 538 Luna Dr | 0.67mi | 5/2.5 | 2,282 (+2%) | 7mo | $940,000 | $412 | 52 |
| 4801 Cardiff Bay Dr | 0.54mi | 5/3.0 | 2,428 (+9%) | 5mo | $915,000 | $377 | 52 |
| 4475 Saint Andrews Pl | 0.67mi | 4/3.0 (-1) | 2,127 (-4%) | 0mo | $959,000 | $451 | 52 |
| 397 Moonstone Bay Dr | 0.51mi | 4/2.0 (-1) | 2,031 (-9%) | 2mo | $970,000 | $478 | 47 |
| 4863 Marblehead Bay Dr | 0.66mi | 4/3.0 (-1) | 2,428 (+9%) | 2mo | $1,150,000 | $474 | 44 |
| 4512 Glenview | 0.55mi | 4/3.0 (-1) | 2,002 (-10%) | 6mo | $977,000 | $488 | 43 |
| 4468 Inverness Dr | 0.71mi | 4/3.0 (-1) | 2,127 (-4%) | 8mo | $932,500 | $438 | 43 |
| 390 Pismo Bay Ct | 0.61mi | 4/2.0 (-1) | 2,031 (-9%) | 1mo | $915,000 | $451 | 43 |
| 4635 Allende Ave | 0.75mi | 4/3.0 (-1) | 2,538 (+14%) | 8mo | $1,190,000 | $469 | 26 |
Match score weights: distance 35% · size 25% · config 20% · recency 20%. Top-matched comps best support the ARV.
Projected returns pro-forma
-3.0% appreciation · 3.29% rent growth · sell at horizon
- IRR
- -8.5%
- Equity multiple
- 0.69×
- Total profit
- $-86,530
- Equity at exit
- $147,612
- IRR
- 1.3%
- Equity multiple
- 1.10×
- Total profit
- $26,382
- Equity at exit
- $85,597
Cash invested: $277,200 (down + closing). Projections, not guarantees.
Landlord ↔ Tenant lean methodology
- Overall (STATE)
- 18 Strongly Tenant-Friendly
- State California
- 18 Strongly Tenant-Friendly · D+13
- County
- — inherits STATE
- City
- — inherits STATE
ZIP-level market 92057
- Rents YoY
- 3.3%
- Active inventory
- 246
- Price-to-rent
- 9.1×
Monthly cashflow live
- Estimated rent
- $9,083 medium interval (Pro) →
- Mortgage (P&I)
- −$5,192
- Tax from tax record
- −$447 /mo · $5,368/yr
- Insurance
- −$412
- HOA
- −$0
- Vacancy / Maint / Mgmt
- −$1,907
- Net cashflow
- $1,124
Break-even live
Sensitivity live
| Price | -10% $1,684 | -5% $1,404 | +0% $1,124 | +5% $844 | +10% $564 |
|---|---|---|---|---|---|
| Rent | -10% $406 | -5% $765 | +0% $1,124 | +5% $1,483 | +10% $1,841 |
| Rate | -1.0pp $1,622 | -0.5pp $1,376 | base $1,124 | +0.5pp $867 | +1.0pp $606 |
UW: 25.0% down · 7.5% · 30yr · 1.5% tax · 5.0% vac · 8.0% maint · 8.0% mgmt
Financing live
Cash to close
- Down payment
- $247,500
- Closing costs
- $29,700
- Reserves months
- —
- Total cash needed
- —
Loan-product check · same deal, 3 products live
Conventional
25% down · 7.5% · 30yr
- Down + closing
- —
- Monthly P&I
- —
- Monthly cashflow
- —
- DSCR
- —
- Eligible?
- —
Personal DTI + credit; lowest rate.
DSCR
20% down · 8.5% · 30yr
- Down + closing
- —
- Monthly P&I
- —
- Monthly cashflow
- —
- DSCR
- —
- Eligible?
- —
No personal income docs; deal must DSCR.
Hard money
10% down · 12.0% · 12mo
- Down + closing
- —
- Monthly P&I
- —
- Monthly cashflow
- —
- DSCR
- —
- Eligible?
- —
Short-term bridge; refi at stabilization.
Rent comps 4 comps
| Address | Beds | Baths | Sqft | Rent | $/sqft | DOM | Units | Dist |
|---|---|---|---|---|---|---|---|---|
| 4397 Cadence Way Oceanside, CA | 5.0 | 3.0 | 2058 | $16,000 | $7.77 | 26d | 1 | 0.82mi |
| 393 Spring Canyon Way Oceanside, CA | 4.0 | 3.0 | 2600 | $4,395 | $1.69 | 16d | 1 | 0.93mi |
| 4912 Tyler St Oceanside, CA | 4.0 | 2.0 | 1443 | $3,800 | $2.63 | 5d | 1 | 1.01mi |
| 330 Del Flora St Oceanside, CA | 4.0 | 2.0 | 2200 | $9,000 | $4.09 | 26d | 1 | 1.25mi |
Listing history 20 events
-
2026-06-21days on market $990,000 Active 48 DOM
-
2026-06-18days on market $990,000 Active 45 DOM
-
2026-06-17days on market $990,000 Active 44 DOM
-
2026-06-16days on market $990,000 Active 43 DOM
-
2026-06-15days on market $990,000 Active 42 DOM
-
2026-06-13days on market $990,000 Active 40 DOM
-
2026-06-13days on market $990,000 Active 39 DOM
-
2026-06-09days on market $990,000 Active 36 DOM
-
2026-06-08days on market $990,000 Active 35 DOM
-
2026-06-07days on market $990,000 Active 34 DOM
-
2026-06-04days on market $990,000 Active 31 DOM
-
2026-06-03days on market $990,000 Active 30 DOM
-
2026-06-02days on market $990,000 Active 29 DOM
-
2026-06-01days on market $990,000 Active 28 DOM
-
2026-05-31days on market $990,000 Active 27 DOM
-
2026-05-04$1,100,000 Active 874-char remark
-
2015-06-24soldstatus $240,000 Sold 223-char remark
Show marketing remark (223 chars)
Great Twinhome that needs some TLC. Property has a lot of potential, with an oversized backyard with apple, citrus and pomegranate trees. There are no neighbors to the back of the home. A block away from Libby Lake Park.
-
2015-06-24soldstatus $240,000
Show marketing remark (223 chars)
Great Twinhome that needs some TLC. Property has a lot of potential, with an oversized backyard with apple, citrus and pomegranate trees. There are no neighbors to the back of the home. A block away from Libby Lake Park.
-
2015-05-24status Pending 223-char remark
Show marketing remark (223 chars)
Great Twinhome that needs some TLC. Property has a lot of potential, with an oversized backyard with apple, citrus and pomegranate trees. There are no neighbors to the back of the home. A block away from Libby Lake Park.
-
2015-05-09$260,000 Active 223-char remark
Show marketing remark (223 chars)
Great Twinhome that needs some TLC. Property has a lot of potential, with an oversized backyard with apple, citrus and pomegranate trees. There are no neighbors to the back of the home. A block away from Libby Lake Park.
ⓘ Source: listings_history table (triggers on properties + properties_extension) + one-shot
backfill from property_details.listing_events for pre-trigger history.
Tax reassessment forecast CA · Resets to sale price
- Current annual tax
- $5,368 · $447/mo
- Projected year-2 tax
- $7,524 · $627/mo
- Expected delta
- +$2,156/yr (+$180/mo · 40.2%)
ⓘ Screening estimate from a state-policy table — verify with the county assessor before closing.
Climate risk First Street
- Flood 4/10 Moderate FEMA zone X (shaded) · 22% chance over 30 yrs
- Wildfire 4/10 Moderate
- Heat 6/10 Major 8 d/yr ≥87°F today · 24 d/yr by 30 yrs out
- Wind 1/10 Low
- Air quality 4/10 Moderate 5 unhealthy d/yr today · 5 by 30 yrs out
Nearby sold comps map
Loading sold comps map…
Walkable amenities ~0.75 mi
Loading nearby amenities…
Taxation est. · year 1
- Rental income
- $108,994
- − Mortgage interest
- −$55,455
- − Property taxes
- −$5,368
- − Insurance
- −$4,950
- − Repairs & maintenance
- −$8,720
- − Management
- −$8,720
- − Depreciation
- −$28,800
- Taxable loss
- −$3,019
- Est. tax savings @ 24.0%
- +$724
- After-tax cash flow
- $14,212/yr
For passive investors: Depreciation is non-cash, so a rental often shows a tax loss while cash-flowing — sheltering income. Rental losses are passive: they offset passive income freely, and up to $25,000/yr can offset ordinary (W-2) income if you actively participate and your MAGI is under $100k (phasing out to $0 by $150k); unused losses carry forward. On sale, claimed depreciation is recaptured at up to 25%, and gains may owe capital-gains tax (a 1031 exchange can defer both). Figures are a year-1 estimate at your 24.0% rate — not tax advice; consult a CPA.
Schools (NCES district)
- District
- Oceanside Unified
- NCES district ID
- 0628250
- Math proficiency
- 31% ▼ -5.00%
- Reading proficiency
- 51% ▲ 6.00%
- Median HH income
- $55,158
- Composite
- 35.74/100
- National rank
- #4853
- State rank
- #221 of 517 in CA
Livability — Oceanside
- Score
- 64/100
- State rank
- #413
- US rank
- #14081
Category grades
Schools grade is shown separately in the Schools card above.
Census & demographics
- Census place
- Oceanside, CA
- County
- San Diego County · 3,178,799 people
- City population
- 198,702
- Metro
- San Diego-Chula Vista-Carlsbad, CA
- Population (ZIP)
- 56,835
- Household income
- $108,814
- Rent vs Own
- Severe rent burden
- 1509.0
Population outlook (San Diego County) Hauer SSP2
- Today (2025)
- 3,678,185 people
- By 2030
- 3,856,546 · +4.8%
- By 2040
- 4,171,407 · +13.4%
- By 2050
- 4,421,607 · +20.2%
- By 2075
- 4,831,599 · +31.4%
- By 2100
- 4,832,502 · +31.4%
Race, ethnicity, and origin ACS 2023
- Neighborhood character
- Diverse neighborhood (Simpson 0.68)
- Race & ethnicity
- Hispanic / Latino 40% White 40% Two or more races 24% Asian 9% Black 5%
- Hispanic origin (detail)
- Mexican 33% Puerto Rican 1%
- Common ancestry
- Slovak 2% Romanian 2% Lithuanian 2%
- Foreign-born
- 21% · Canada, Vietnam, China
- Languages at home
- 66% English-only · Spanish 25% Tagalog/Filipino 2% Other Asian/Pacific 1%
Political lean MEDSL · San Diego
- 2024 margin
- D (+16.8) · D 56.9% · R 40.1% · Other 2.9%
- 2008→2024 swing
- +6.6pp toward D · 2008: 10.2pp · 2024: 16.8pp
- All cycles
- 2024: D+16.8 2020: D+22.8 2016: D+17.8 2012: D+5.1 2008: D+10.2
Not yet ingested
- Civics
- —
Market trends
- HPI YoY
- ▼ -1014.18%
- Current HPI
- 393.7681
- Rent YoY
- ▲ 3.29%
- Metro
- San Diego-Chula Vista-Carlsbad, CA
- State GDP YoY
- ▲ 3.21%
- F500 in state
- 116
Industry mix (Fortune 500 HQ in CA)
| Industry | F500 HQs | Revenue |
|---|---|---|
| Technology | 27 | $1,492B |
|
||
| Financial Services | 3 | $174B |
|
||
| Retail | 3 | $44B |
|
||
| Insurance | 3 | $26B |
|
||
| Media / Entertainment | 2 | $115B |
|
||
| Pharmaceuticals / Biotech | 2 | $62B |
|
||
Price history
+280.8% since first listed6 events — show timeline
- 2026-05-23 Price Changed $990,000 CRMLS
- 2026-05-04 Listed $1,100,000 CRMLS
- 2015-06-24 Sold (Public Records) $240,000 Public Records
- 2015-06-24 Sold (MLS) $240,000 SDMLS
- 2015-05-24 Pending — SDMLS
- 2015-05-09 Listed $260,000 SDMLS
Property tax history
+10.5%/yrLatest (2025): $5,368 · +2.0% YoY. Source: county tax records.
Cash-flow waterfall
monthlySold comps — $/sqft
last 12 mo · ≤1 miLoading sold comps…