4444 E Avenue R Spc 35 Unit . · Palmdale, CA
Flood risk 1/10 · Minimal
- FEMA flood zone
- X (shaded)
- Chance of flooding over 30 yrs
- 0.0%
- Est. flood insurance / yr
- $507 – $1,088
Fire risk 7/10 · Major
- Est. fire insurance / yr
- $659 – $1,223
Heat risk 6/10 · Moderate
- Hot days now (above 100°F)
- 1 days/yr
- Hot days in 30 yrs
- 2 days/yr
Wind risk 1/10 · Minimal
- Chance of severe wind over 30 yrs
- —
Air-quality risk 10/10 · Severe
- Unhealthy air days now
- 25 days/yr
- Unhealthy air days in 30 yrs
- 29 days/yr
Risk factors via First Street. Map © Google.
Why this score? — see what drove the C+ grade
The composite is a weighted blend of 9 inputs, each scored 0–100. Each bar is that input's sub-score; the figure is the points it added to the 100-point composite (weight × sub-score).
- Cash flow +30.0/30.0
- 1% rule +10.0/10.0
- DSCR +10.0/10.0
- Livability +2.8/5.0
- Rent growth +2.5/5.0
- Schools +2.5/10.0
- Condition / age +2.5/5.0
- ARV discount +0.0/15.0
- Appreciation +0.0/10.0
$155,000
🖨 Deal sheet 📄 Offer letter ✓ Due diligence
Listing remarks
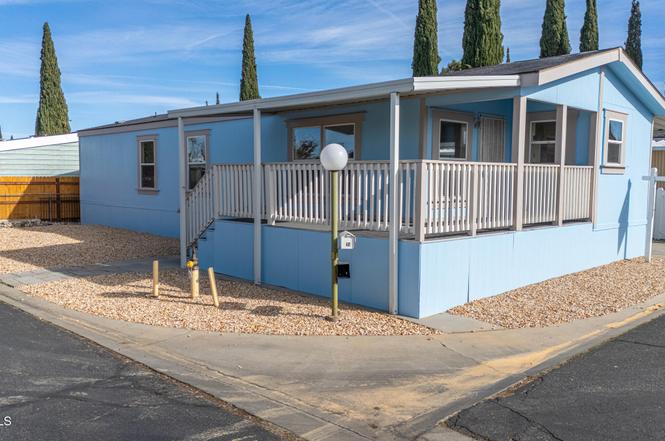
BACK TO THE MARKET!!! Don't miss this opportunity! One of the most desirable manufactured homes in Palmdale, offering an excellent value in the sought-after Grecian Isle Mobile Home Park. Built in 2001, this home features 3 bedrooms, 2 bathrooms, and a dedicated laundry room. Recently painted inside and out, it offers central A/C and heating, laminate flooring throughout, and a spacious front porch. The extended driveway awning accommodates up to three vehicles. Enjoy a large, low-maintenance yard finished with golden gravel--ideal for water conservation. Conveniently located within walking distance to grocery stores, hardware stores, schools, pharmacy, Hispanic market, restaurants, coffee
Key facts
- Low-maintenance yard
- Laminate flooring
- Spacious front porch
Tags
Neighborhood map
What this means for you Summary
Snapshot
- This is a 3-bed/2.0-bath manufactured listed at $155k.
Deal economics
- At list price, monthly cash flow is $1k ($16k/yr) — positive.
- The deal already cash-flows at list — no discount required.
- Meets the 1% rule at list price ($3k rent vs $155k).
- Recommended offer: $146k (6.0% below list) — sets the bar for market timing.
- Cap rate 16.9% vs local median 4.5% in Palmdale — top-decile yield for the area; either an underpriced asset or a hidden risk that comps aren't pricing in. Stress-test before assuming the spread holds.
Location & tenants
- Location reads 55/100 on livability (#861 in CA) — a working-class tenant base; expect higher turnover. Strengths: housing A+; Watch: schools F, crime F, amenities F.
- Palmdale Elementary (suburban): math 20% / reading 31% proficiency, ranked #1,147 of 1,400 in CA (top 82%) — low school quality limits family demand, transient renter base, plan for 1-2y turnover; 69% free/reduced lunch — lower-income household profile, screen leases tightly.
- Market conditions: 128 active listings in the ZIP; 11 comparable units currently listed for rent nearby; rentals leasing fast (median 1d on market — plan ~1-2 weeks tenant-placement turnaround); solid renter incomes; 19,697 units permitted in Los Angeles County in 2024 (9,426 in 5+ unit buildings).
- This rent runs 43% of the median local income ($86k/yr) — at the standard rent-burdened threshold; future hikes will face affordability resistance.
Forward outlook
- Local home prices are declining (-3.0%/yr); year-one equity from $1k of loan paydown is wiped out by about $5k of value loss. Plan a longer hold.
- Los Angeles County population projected at +9% by 2050 — modest demand growth; plan on rents tracking national, not racing it.
- At projected returns (-3.0% appreciation + 3.0% rent growth), your $43k cash investment doubles in ~4 years — after that, you're playing with house money.
Negotiation context
- It's been on market 69 days — a 6% lower offer ($146k) is reasonable based on typical stale-listing flexibility.
- 8 sale attempts since 7y ago; this cycle's ask has dropped $10k (6%) from the opening price — seller is motivated, your offer sets the floor, not the list.
Risks & watch-outs
- Climate carrying-cost: major wildfire risk; extreme-heat days projected 1→2/yr by 2055 (HVAC capex compounding) — expect insurance premiums to compound above CPI over the hold.
Questions for the listing agent
- It's been on market 69 days. Have you received any prior offers? Is the seller open to a 6% concession, seller financing, or rate buy-down credit?
- Why hasn't it sold? Are there any deal-killer items the seller is aware of (foundation, flood, title, zoning, code violations)?
- Is there a deadline driving the sale (1031 exchange, divorce, estate, relocation)? That informs how much negotiation room exists.
- Schools are F-rated, which usually means shorter tenancies and higher turnover. Who's the typical renter profile here, and what's been the actual vacancy rate?
- Crime grade is F in this area — have there been break-ins, vandalism, or insurance claims at this property in the last 3 years? What carrier currently insures it and at what premium?
- What's the average days-on-market for RENTAL listings here right now (not sales)? A rising rental-DOM trend means longer vacancies and softer asking-rent achievability than the comps imply.
- What's the recent tenant-quality profile in this submarket — average credit score on applications, eviction rate, late-payment / NSF rate, and stable-employment percentage? A property-management company in the area should have these aggregated.
- How much new for-sale + rental construction is in the pipeline within 1–3 miles? Heavy new supply typically softens prices + rents 12–24 months out; constrained supply supports both.
Investment metrics
- 1% rule
- 1.99% ✓
- Cap rate
- 16.90%
- Cash-on-cash
- 37.87%
- DSCR
- 2.68
- GRM
- 4.2
CMA / ARV
- ARV (on-the-fly)
- $110,200
- Comps found
- 4
Show comp detail 4 sales within ~0.75 mi
| Address | Dist | Beds/Ba | Sqft | Sold | Price | $/sf | Match |
|---|---|---|---|---|---|---|---|
| 4444 E Avenue R #84 | 0.05mi | 2/2.0 (-1) | 1,152 (-1%) | 18mo | $109,500 | $95 | 77 |
| 4444 E Ave R #71 | 0.05mi | 3/2.0 | 1,059 (-9%) | 24mo | $185,000 | $175 | 64 |
| 37311 47th #208 | 0.69mi | 3/2.0 | 1,200 (+3%) | 8mo | $80,000 | $67 | 55 |
| 37311 E 47th St Spc 17 | 0.69mi | 3/1.5 | 1,160 (0%) | 19mo | $90,000 | $78 | 50 |
Match score weights: distance 35% · size 25% · config 20% · recency 20%. Top-matched comps best support the ARV.
Projected returns pro-forma
-3.0% appreciation · 3.0% rent growth · sell at horizon
- IRR
- 33.9%
- Equity multiple
- 2.43×
- Total profit
- $62,152
- Equity at exit
- $23,111
- IRR
- 40.8%
- Equity multiple
- 4.84×
- Total profit
- $166,622
- Equity at exit
- $13,402
Cash invested: $43,400 (down + closing). Projections, not guarantees.
Landlord ↔ Tenant lean methodology
- Overall (STATE)
- 18 Strongly Tenant-Friendly
- State California
- 18 Strongly Tenant-Friendly · D+13
- County
- — inherits STATE
- City
- — inherits STATE
ZIP-level market 93552
- Home prices YoY
- -6.4%
- Active inventory
- 128
- Price-to-rent
- 4.2×
Monthly cashflow live
- Estimated rent
- $3,089 high interval (Pro) →
- Mortgage (P&I)
- −$813
- Tax est. 1.5%
- −$194 /mo · $2,325/yr
- Insurance
- −$65
- HOA
- −$0
- Vacancy / Maint / Mgmt
- −$649
- Net cashflow
- $1,369
Break-even live
UW: 25.0% down · 7.5% · 30yr · 1.5% tax · 5.0% vac · 8.0% maint · 8.0% mgmt
Financing live
Cash to close
- Down payment
- $38,750
- Closing costs
- $4,650
- Reserves months
- —
- Total cash needed
- —
Loan-product check · same deal, 3 products live
Conventional
25% down · 7.5% · 30yr
- Down + closing
- —
- Monthly P&I
- —
- Monthly cashflow
- —
- DSCR
- —
- Eligible?
- —
Personal DTI + credit; lowest rate.
DSCR
20% down · 8.5% · 30yr
- Down + closing
- —
- Monthly P&I
- —
- Monthly cashflow
- —
- DSCR
- —
- Eligible?
- —
No personal income docs; deal must DSCR.
Hard money
10% down · 12.0% · 12mo
- Down + closing
- —
- Monthly P&I
- —
- Monthly cashflow
- —
- DSCR
- —
- Eligible?
- —
Short-term bridge; refi at stabilization.
Rent comps 11 comps
| Address | Beds | Baths | Sqft | Rent | $/sqft | DOM | Units | Dist |
|---|---|---|---|---|---|---|---|---|
| 4206 East Avenue Q-14 Unit Q14 Palmdale, CA | 3.0 | 2.0 | 1150 | $2,850 | $2.48 | 1d | 1 | 0.31mi |
| 37526 Rose St Palmdale, CA | 3.0 | 2.0 | 1361 | $3,150 | $2.31 | 1d | 1 | 0.55mi |
| 37734 Tackstem St Palmdale, CA | 4.0 | 2.0 | 1488 | $2,950 | $1.98 | 1d | 1 | 1.03mi |
| 3559 E Avenue R14 Palmdale, CA | 4.0 | 2.5 | 1483 | $2,895 | $1.95 | 1d | 1 | 1.10mi |
| 37347 Waterman Ave Palmdale, CA | 3.0 | 2.0 | 1383 | $3,350 | $2.42 | 1d | 1 | 1.12mi |
| 38532 33rd St E Palmdale, CA | 4.0 | 2.0 | 1157 | $2,646 | $2.29 | 1d | 1 | 1.32mi |
| 38300 30th St E Palmdale, CA | 1.0–2.0 | 1.0–2.0 | 796 | $2,100 | $2.64 | 1d | 7 | 1.32mi |
| 37707 57th St E Palmdale, CA | 3.0 | 2.5 | 1454 | $2,700 | $1.86 | 1d | 1 | 1.33mi |
| 37210 Sabal Ave Palmdale, CA | 3.0 | 2.0 | 1198 | $2,395 | $2.00 | 1d | 1 | 1.33mi |
| 38527 Pond Ave Palmdale, CA | 4.0 | 2.0 | 1300 | $3,200 | $2.46 | 1d | 1 | 1.39mi |
| 37835 58th St E Palmdale, CA | 3.0 | 2.0 | 1232 | $2,800 | $2.27 | 1d | 1 | 1.44mi |
Listing history 19 events
-
2026-03-31historical
-
2026-03-30status Pending
-
2026-03-11status Active
-
2026-03-11status Active
-
2026-03-08status Pending Sale
-
2026-02-09status Pending
-
2026-01-19price $155,000
-
2026-01-19price $155,000
-
2025-12-22$165,000 Active
-
2025-12-22$165,000 Active
-
2020-09-01status Pending Sale
-
2020-08-12price $115,000
-
2020-08-04historical
-
2020-01-16status Active
-
2020-01-13status Active
-
2019-12-13status Pending
-
2019-12-13status Pending Sale
-
2019-10-21$89,900 Active
-
2019-10-20$89,900 Active
ⓘ Source: listings_history table (triggers on properties + properties_extension) + one-shot
backfill from property_details.listing_events for pre-trigger history.
Climate risk First Street
- Flood 1/10 Low FEMA zone X (shaded) · 0% chance over 30 yrs
- Wildfire 7/10 Severe
- Heat 6/10 Major 1 d/yr ≥100°F today · 2 d/yr by 30 yrs out
- Wind 1/10 Low
- Air quality 10/10 Extreme 25 unhealthy d/yr today · 29 by 30 yrs out
Nearby sold comps map
Loading sold comps map…
Walkable amenities ~0.75 mi
Loading nearby amenities…
Taxation est. · year 1
- Rental income
- $37,073
- − Mortgage interest
- −$8,682
- − Property taxes
- −$2,325
- − Insurance
- −$775
- − Repairs & maintenance
- −$2,966
- − Management
- −$2,966
- − Depreciation
- −$4,509
- Taxable income
- $14,850
- Est. tax owed @ 24.0%
- −$3,564
- After-tax cash flow
- $12,870/yr
For passive investors: Depreciation is non-cash, so a rental often shows a tax loss while cash-flowing — sheltering income. Rental losses are passive: they offset passive income freely, and up to $25,000/yr can offset ordinary (W-2) income if you actively participate and your MAGI is under $100k (phasing out to $0 by $150k); unused losses carry forward. On sale, claimed depreciation is recaptured at up to 25%, and gains may owe capital-gains tax (a 1031 exchange can defer both). Figures are a year-1 estimate at your 24.0% rate — not tax advice; consult a CPA.
Schools (NCES district)
- District
- Palmdale Elementary
- NCES district ID
- 0629580
- Math proficiency
- 20% ▲ 1.00%
- Reading proficiency
- 31% ▲ 1.00%
- Median HH income
- $48,652
- Composite
- 25.34/100
- National rank
- #12888
- State rank
- #1147 of 1400 in CA
Livability — Palmdale
- Score
- 55/100
- State rank
- #861
- US rank
- #23501
Category grades
Schools grade is shown separately in the Schools card above.
Census & demographics
- Census place
- Palmdale, CA
- County
- Los Angeles County · 9,444,647 people
- City population
- 177,644
- Metro
- Los Angeles-Long Beach-Anaheim, CA
- Population (ZIP)
- 42,639
- Household income
- $85,954
- Rent vs Own
- Severe rent burden
- 747.0
Population outlook (Los Angeles County) Hauer SSP2
- Today (2025)
- 10,940,515 people
- By 2030
- 11,256,481 · +2.9%
- By 2040
- 11,729,929 · +7.2%
- By 2050
- 11,948,407 · +9.2%
- By 2075
- 11,818,114 · +8.0%
- By 2100
- 10,842,928 · -0.9%
Race, ethnicity, and origin ACS 2023
- Neighborhood character
- Predominantly Hispanic (72%)
- Race & ethnicity
- Hispanic / Latino 72% Two or more races 21% Black 13% White 11% Asian 2% Native American 1%
- Hispanic origin (detail)
- Mexican 55%
- Common ancestry
- Italian 1%
- Foreign-born
- 27% · Canada, Dominican Republic
- Languages at home
- 42% English-only · Spanish 55% Tagalog/Filipino 1%
Political lean MEDSL · Los Angeles
- 2024 margin
- Solid D (+32.9) · D 64.8% · R 31.9% · Other 3.3%
- 2008→2024 swing
- -7.4pp toward R · 2008: 40.4pp · 2024: 32.9pp
- All cycles
- 2024: D+32.9 2020: D+44.2 2016: D+48.0 2012: D+40.0 2008: D+40.4
Not yet ingested
- Civics
- —
Market trends
- HPI YoY
- ▼ -27.00%
- Current HPI
- 394.1607
- Rent YoY
- —
- Metro
- Los Angeles-Long Beach-Anaheim, CA
- State GDP YoY
- ▲ 3.21%
- F500 in state
- 116
Industry mix (Fortune 500 HQ in CA)
| Industry | F500 HQs | Revenue |
|---|---|---|
| Technology | 27 | $1,492B |
|
||
| Financial Services | 3 | $174B |
|
||
| Retail | 3 | $44B |
|
||
| Insurance | 3 | $26B |
|
||
| Media / Entertainment | 2 | $115B |
|
||
| Pharmaceuticals / Biotech | 2 | $62B |
|
||
Price history
+72.4% since first listed19 events — show timeline
- 2026-03-31 Listing Removed — CRMLS
- 2026-03-30 Pending — AVMLS
- 2026-03-11 Relisted — CRMLS
- 2026-03-11 Relisted — AVMLS
- 2026-03-08 Pending — CRMLS
- 2026-02-09 Pending — AVMLS
- 2026-01-19 Price Changed $155,000 AVMLS
- 2026-01-19 Price Changed $155,000 CRMLS
- 2025-12-22 Listed $165,000 AVMLS
- 2025-12-22 Listed $165,000 CRMLS
- 2020-09-01 Pending — CRMLS
- 2020-08-12 Price Changed $115,000 CRMLS
- 2020-08-04 Listing Removed — AVMLS
- 2020-01-16 Relisted — CRMLS
- 2020-01-13 Relisted — AVMLS
- 2019-12-13 Pending — AVMLS
- 2019-12-13 Pending — CRMLS
- 2019-10-21 Listed $89,900 AVMLS
- 2019-10-20 Listed $89,900 CRMLS
Cash-flow waterfall
monthlySold comps — $/sqft
last 12 mo · ≤1 miLoading sold comps…