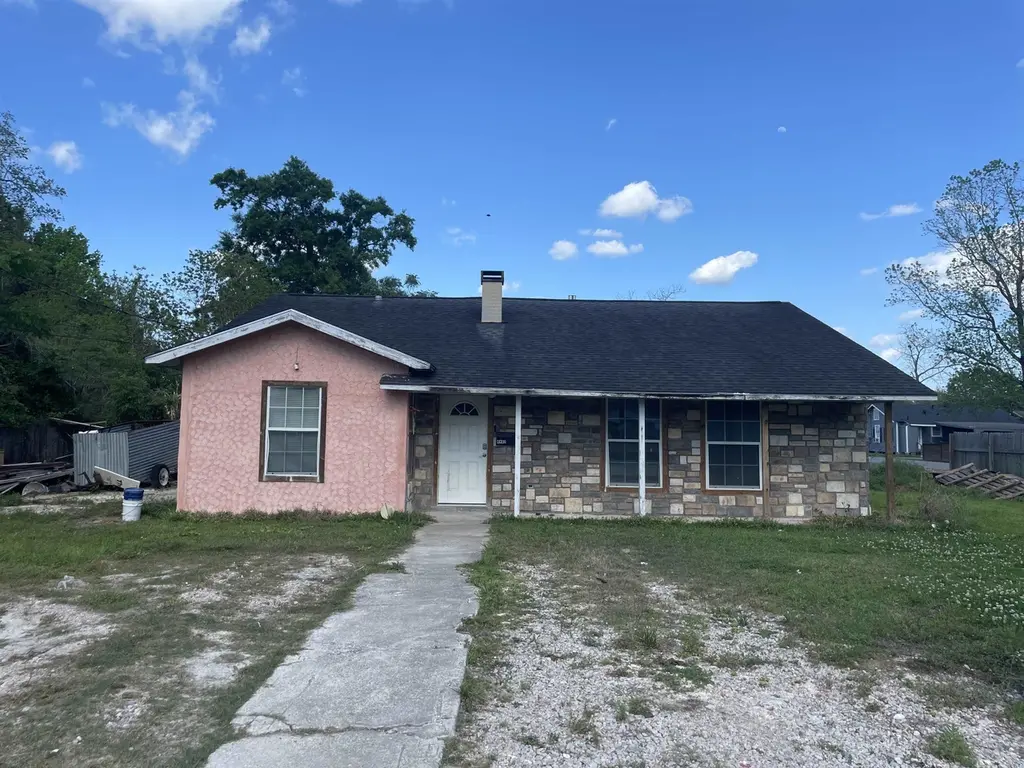
4402 Dallas St · Beaumont, TX
Flood risk 4/10 · Minor
- FEMA flood zone
- X
- Chance of flooding over 30 yrs
- 0.2%
- Est. flood insurance / yr
- $507 – $1,088
Fire risk 1/10 · Minimal
- Est. fire insurance / yr
- $1,222 – $2,270
Heat risk 9/10 · Severe
- Hot days now (above 109°F)
- 7 days/yr
- Hot days in 30 yrs
- 23 days/yr
Wind risk 9/10 · Severe
- Chance of severe wind over 30 yrs
- 99.0%
Air-quality risk 2/10 · Minimal
- Unhealthy air days now
- 1 days/yr
- Unhealthy air days in 30 yrs
- 1 days/yr
Risk factors via First Street. Map © Google.
Why this score? — see what drove the B+ grade
The composite is a weighted blend of 9 inputs, each scored 0–100. Each bar is that input's sub-score; the figure is the points it added to the 100-point composite (weight × sub-score).
- Cash flow +27.2/30.0
- ARV discount +15.0/15.0
- DSCR +9.5/10.0
- Appreciation +7.7/10.0
- 1% rule +7.1/10.0
- Livability +3.2/5.0
- Rent growth +2.5/5.0
- Condition / age +2.5/5.0
- Schools +1.5/10.0
$124,900
🖨 Deal sheet (PDF) 📄 Offer letter ✓ Due diligence
Listing remarks MLS
What a grand home this can be. This is the right kind of home for the investor that wants a nice return on their sweat equity. Ready for repairs. Will need to register with City of Beaumont Work Program for rehab. Closing MUST go thru Boston National Title in Dallas, TX, Ryan Riyad, closer 972-584-9657 to receive clear title with no exceptions.
Key facts
- 0.29 acre lot
- Built 1962
- Listed 43 days
Property features AI
Finance
- Other: Disclosures: Municipal Utility District Disclosure; Seller Disclosure
- Financial info: Lease not considered
Exterior
- Utilities: Public water; Public sewer
- Home design: Residential property; Single-story entry (all rooms listed on the first floor)
- Construction: Built in 1962; Slab foundation; Composition roof
- Exterior features: Cleared lot; Asphalt road access
Interior
- Bedrooms: Up to 5 bedrooms (all on the first floor); Primary bedroom on the first floor
- Bathrooms: 3 full bathrooms (all on the first floor)
- Heating & cooling: Central heating (gas); Central electric air conditioning
- Interior features: Total of 8 rooms
Neighborhood map
What this means for you Summary
Snapshot
- This is a 5-bed/3.0-bath single-family listed at $125k.
Deal economics
- At list price, monthly cash flow is $358 ($4k/yr) — positive.
- The deal already cash-flows at list — no discount required.
- Meets the 1% rule at list price ($2k rent vs $125k).
- Recommended offer: $121k (3.0% below list) — sets the bar for market timing.
- Cap rate 9.7% vs local median 5.3% in Beaumont — top-decile yield for the area; either an underpriced asset or a hidden risk that comps aren't pricing in. Stress-test before assuming the spread holds.
Location & tenants
- Location reads 64/100 on livability (#739 in TX) — a middle-class / working-renter tenant base. Strengths: cost of living A+, housing A+, health & safety A+; Watch: employment D, crime F, amenities F.
- Beaumont ISD (urban): math 14% / reading 22% proficiency, ranked #789 of 826 in TX (top 96%) — low school quality limits family demand, transient renter base, plan for 1-2y turnover; 69% free/reduced lunch — lower-income household profile, screen leases tightly.
- Zoned schools: Martin El (math 3% / reading 6%, grade F, #4,322 of 4,322 statewide, top 100%, 486 students, 97% FRL); Smith Middle (math 4% / reading 8%, grade F, #1,659 of 1,662 statewide, top 100%, 475 students, 90% FRL, charter) — zoned schools average 94% FRL vs 69% district-wide (25 pts higher); higher-poverty schools than district average — tighter screening recommended.
- Zoned-school proficiency averages 5% at this address vs 18% district-wide (-13 pts) — the specific schools serving this property underperform the Beaumont ISD average; the district grade overstates school quality for this exact location.
- Market conditions: 80 active listings in the ZIP; lower-income renter base — watch delinquency; 343 units permitted in Jefferson County in 2024 (0 in 5+ unit buildings).
- At $1,506/mo this rent would consume 57% of the median local household income ($32k/yr) (locally 657% of renters already pay >50% of income on rent) — very limited rent-growth headroom before tenants either downsize or default.
Forward outlook
- In year one you build about $8k of equity ($864 loan paydown + $7k appreciation (5.4% local appreciation)).
- At projected returns (5.4% appreciation + 3.0% rent growth), your $35k cash investment doubles in ~3 years — after that, you're playing with house money.
- By year 5, paydown + projected appreciation supports a ~$33k cash-out refi (75% LTV) — recoverable capital for the next deal without selling this one.
Negotiation context
- It's been on market 43 days — a 3% lower offer ($121k) is reasonable based on typical stale-listing flexibility.
- 2 sale attempts since 12y ago with the ask held roughly flat each time — persistent listings suggest the price (not the market) is what's stuck; bring a comps-based counter.
Risks & watch-outs
- Climate carrying-cost: severe wind risk, 99% chance of damaging wind over 30y; extreme-heat days projected 7→23/yr by 2055 (HVAC capex compounding) — expect insurance premiums to compound above CPI over the hold.
Questions for the listing agent
- It's been on market 43 days. Have you received any prior offers? Is the seller open to a 3% concession, seller financing, or rate buy-down credit?
- Built in 1962 — when were the roof, HVAC, electrical panel, plumbing, and water heater last replaced?
- Is there a deadline driving the sale (1031 exchange, divorce, estate, relocation)? That informs how much negotiation room exists.
- Schools are D-rated, which usually means shorter tenancies and higher turnover. Who's the typical renter profile here, and what's been the actual vacancy rate?
- Crime grade is F in this area — have there been break-ins, vandalism, or insurance claims at this property in the last 3 years? What carrier currently insures it and at what premium?
- What's the average days-on-market for RENTAL listings here right now (not sales)? A rising rental-DOM trend means longer vacancies and softer asking-rent achievability than the comps imply.
- What's the recent tenant-quality profile in this submarket — average credit score on applications, eviction rate, late-payment / NSF rate, and stable-employment percentage? A property-management company in the area should have these aggregated.
- How much new for-sale + rental construction is in the pipeline within 1–3 miles? Heavy new supply typically softens prices + rents 12–24 months out; constrained supply supports both.
Investment metrics
- 1% rule
- 1.21% ✓
- Cap rate
- 9.73%
- Cash-on-cash
- 12.28%
- DSCR
- 1.55
- GRM
- 6.9
CMA / ARV
- ARV (median comp)
- $171,814
- List price
- $124,900
- Delta
- -27.31%
- Verdict
- UNDERPRICED
- Comps
- 3 within 1.0 mi
Show comp detail 1 sale within ~0.75 mi
| Address | Dist | Beds/Ba | Sqft | Sold | Price | $/sf | Match |
|---|---|---|---|---|---|---|---|
| 3805 Jerry Dr | 0.25mi | 4/2.0 (-1) | 1,650 (-10%) | 23mo | $273,500 | $166 | 43 |
Match score weights: distance 35% · size 25% · config 20% · recency 20%. Top-matched comps best support the ARV.
Projected returns pro-forma
5.43% appreciation · 3.0% rent growth · sell at horizon
- IRR
- 24.4%
- Equity multiple
- 2.56×
- Total profit
- $54,709
- Equity at exit
- $74,104
- IRR
- 23.3%
- Equity multiple
- 5.13×
- Total profit
- $144,326
- Equity at exit
- $130,731
Cash invested: $34,972 (down + closing). Projections, not guarantees.
Landlord ↔ Tenant lean methodology
- Overall (STATE)
- 87 Strongly Landlord-Friendly
- State Texas
- 87 Strongly Landlord-Friendly · R+5
- County
- — inherits STATE
- City
- — inherits STATE
ZIP-level market 77703
- Home prices YoY
- 3.7%
- Active inventory
- 80
- Price-to-rent
- 6.9×
Monthly cashflow live
- Estimated rent
- $1,506 medium interval (Pro) →
- Mortgage (P&I)
- −$655
- Tax from tax record
- −$125 /mo · $1,502/yr
- Insurance
- −$52
- HOA
- −$0
- Vacancy / Maint / Mgmt
- −$316
- Net cashflow
- $358
Break-even live
Sensitivity live
| Price | -10% $429 | -5% $393 | +0% $358 | +5% $323 | +10% $287 |
|---|---|---|---|---|---|
| Rent | -10% $239 | -5% $298 | +0% $358 | +5% $417 | +10% $477 |
| Rate | -1.0pp $421 | -0.5pp $390 | base $358 | +0.5pp $325 | +1.0pp $293 |
UW: 25.0% down · 7.5% · 30yr · 1.5% tax · 5.0% vac · 8.0% maint · 8.0% mgmt
Financing live
Cash to close
- Down payment
- $31,225
- Closing costs
- $3,747
- Reserves months
- —
- Total cash needed
- —
Loan-product check · same deal, 3 products live
Conventional
25% down · 7.5% · 30yr
- Down + closing
- —
- Monthly P&I
- —
- Monthly cashflow
- —
- DSCR
- —
- Eligible?
- —
Personal DTI + credit; lowest rate.
DSCR
20% down · 8.5% · 30yr
- Down + closing
- —
- Monthly P&I
- —
- Monthly cashflow
- —
- DSCR
- —
- Eligible?
- —
No personal income docs; deal must DSCR.
Hard money
10% down · 12.0% · 12mo
- Down + closing
- —
- Monthly P&I
- —
- Monthly cashflow
- —
- DSCR
- —
- Eligible?
- —
Short-term bridge; refi at stabilization.
Listing history 18 events
-
2026-06-15days on market $124,900 Active 43 DOM
-
2026-06-14days on market $124,900 Active 41 DOM
-
2026-06-13days on market $124,900 Active 40 DOM
-
2026-06-10days on market $124,900 Active 38 DOM
-
2026-06-09days on market $124,900 Active 37 DOM
-
2026-06-08days on market $124,900 Active 36 DOM
-
2026-06-07days on market $124,900 Active 35 DOM
-
2026-06-03days on market $124,900 Active 31 DOM
-
2026-06-02days on market $124,900 Active 30 DOM
-
2026-06-01days on market $124,900 Active 29 DOM
-
2026-05-31days on market $124,900 Active 28 DOM
-
2026-05-30days on market $124,900 Active 27 DOM
-
2026-05-03$124,900 Active 922-char remark
-
2026-05-01price $124,900 876-char remark
-
2026-03-29$129,900 Active 876-char remark
-
2014-11-17soldstatus
-
2014-11-10soldstatus
Show marketing remark (346 chars)
What a grand home this can be. This is the right kind of home for the investor that wants a nice return on their sweat equity. Ready for repairs. Will need to register with City of Beaumont Work Program for rehab. Closing MUST go thru Boston National Title in Dallas, TX, Ryan Riyad, closer 972-584-9657 to receive clear title with no exceptions.
-
2014-10-31$17,000
Show marketing remark (346 chars)
What a grand home this can be. This is the right kind of home for the investor that wants a nice return on their sweat equity. Ready for repairs. Will need to register with City of Beaumont Work Program for rehab. Closing MUST go thru Boston National Title in Dallas, TX, Ryan Riyad, closer 972-584-9657 to receive clear title with no exceptions.
ⓘ Source: listings_history table (triggers on properties + properties_extension) + one-shot
backfill from property_details.listing_events for pre-trigger history.
Tax reassessment forecast TX · Resets to sale price
- Current annual tax
- $1,502 · $125/mo
- Projected year-2 tax
- $2,286 · $190/mo
- Expected delta
- +$784/yr (+$65/mo · 52.2%)
ⓘ Screening estimate from a state-policy table — verify with the county assessor before closing.
Climate risk First Street
- Flood 4/10 Moderate FEMA zone X · 20% chance over 30 yrs
- Wildfire 1/10 Low
- Heat 9/10 Extreme 7 d/yr ≥109°F today · 23 d/yr by 30 yrs out
- Wind 9/10 Extreme 99% chance of damaging wind over 30 yrs
- Air quality 2/10 Low 1 unhealthy d/yr today · 1 by 30 yrs out
Nearby sold comps map
Loading sold comps map…
Walkable amenities ~0.75 mi
Loading nearby amenities…
Taxation est. · year 1
- Rental income
- $18,076
- − Mortgage interest
- −$6,996
- − Property taxes
- −$1,502
- − Insurance
- −$624
- − Repairs & maintenance
- −$1,446
- − Management
- −$1,446
- − Depreciation
- −$3,633
- Taxable income
- $2,428
- Est. tax owed @ 24.0%
- −$583
- After-tax cash flow
- $3,712/yr
For passive investors: Depreciation is non-cash, so a rental often shows a tax loss while cash-flowing — sheltering income. Rental losses are passive: they offset passive income freely, and up to $25,000/yr can offset ordinary (W-2) income if you actively participate and your MAGI is under $100k (phasing out to $0 by $150k); unused losses carry forward. On sale, claimed depreciation is recaptured at up to 25%, and gains may owe capital-gains tax (a 1031 exchange can defer both). Figures are a year-1 estimate at your 24.0% rate — not tax advice; consult a CPA.
Schools (NCES district)
- District
- Beaumont ISD
- NCES district ID
- 4809670
- Math proficiency
- 14% ▼ -13.00%
- Reading proficiency
- 22% ▼ -7.00%
- Median HH income
- $41,683
- Composite
- 15.43/100
- National rank
- #9316
- State rank
- #789 of 826 in TX
Livability — Beaumont
- Score
- 64/100
- State rank
- #739
- US rank
- #13710
Category grades
Schools grade is shown separately in the Schools card above.
Census & demographics
- Census place
- Beaumont, TX
- County
- Jefferson County · 203,592 people
- City population
- 125,901
- Metro
- Beaumont-Port Arthur, TX
- Population (ZIP)
- 11,004
- Household income
- $31,803
- Rent vs Own
- Severe rent burden
- 657.0
Population outlook (Jefferson County) Hauer SSP2
- Today (2025)
- 259,015 people
- By 2030
- 260,685 · +0.6%
- By 2040
- 263,309 · +1.7%
- By 2050
- 265,237 · +2.4%
- By 2075
- 270,193 · +4.3%
- By 2100
- 255,628 · -1.3%
Race, ethnicity, and origin ACS 2023
- Neighborhood character
- Majority Black (60%)
- Race & ethnicity
- Black 60% Hispanic / Latino 31% Two or more races 7% White 5%
- Hispanic origin (detail)
- Mexican 25%
- Common ancestry
- Serbian 1%
- Foreign-born
- 13% · Canada
- Languages at home
- 70% English-only · Spanish 29% French/Haitian/Cajun 1%
Political lean MEDSL · Jefferson
- 2024 margin
- Lean R (+8.9) · D 45.1% · R 54.0%
- 2008→2024 swing
- -11.1pp toward R · 2008: 2.2pp · 2024: -8.9pp
- All cycles
- 2024: R+8.9 2020: R+1.6 2016: R+0.5 2012: D+1.6 2008: D+2.2
Not yet ingested
- Civics
- —
Market trends
- HPI YoY
- ▲ 5.43%
- Current HPI
- 151.9888
- Rent YoY
- —
- Metro
- Beaumont-Port Arthur, TX
- State GDP YoY
- ▲ 3.95%
- F500 in state
- 110
Industry mix (Fortune 500 HQ in TX)
| Industry | F500 HQs | Revenue |
|---|---|---|
| Energy | 16 | $1,198B |
|
||
| Technology | 5 | $198B |
|
||
| Engineering / Construction | 4 | $72B |
|
||
| Energy Services | 3 | $60B |
|
||
| Utilities | 3 | $41B |
|
||
| Healthcare | 2 | $330B |
|
||
Price history
+634.7% since first listed6 events — show timeline
- 2026-06-16 Listing Removed — HARMLS
- 2026-05-03 Listed $124,900 HARMLS
- 2026-05-01 Price Changed $124,900 BBOR
- 2014-11-17 Sold (Public Records) — Public Records
- 2014-11-10 Sold (MLS) — BBOR
- 2014-10-31 Listed $17,000 BBOR
Property tax history
+2.8%/yrLatest (2025): $1,502 · +9.1% YoY. Source: county tax records.
Cash-flow waterfall
monthlySold comps — $/sqft
last 12 mo · ≤1 miLoading sold comps…