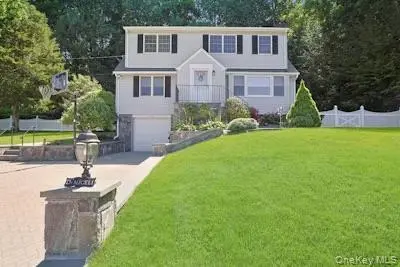
328 Linda Ave · Hawthorne, NY
Flood risk 1/10 · Minimal
- FEMA flood zone
- X (unshaded)
- Chance of flooding over 30 yrs
- 0.0%
- Est. flood insurance / yr
- $473 – $860
Fire risk 1/10 · Minimal
- Est. fire insurance / yr
- $691 – $1,283
Heat risk 5/10 · Moderate
- Hot days now (above 98°F)
- 7 days/yr
- Hot days in 30 yrs
- 14 days/yr
Wind risk 6/10 · Moderate
- Chance of severe wind over 30 yrs
- 27.0%
Air-quality risk 4/10 · Minor
- Unhealthy air days now
- 4 days/yr
- Unhealthy air days in 30 yrs
- 6 days/yr
Risk factors via First Street. Map © Google.
Why this score? — see what drove the B- grade
The composite is a weighted blend of 9 inputs, each scored 0–100. Each bar is that input's sub-score; the figure is the points it added to the 100-point composite (weight × sub-score).
- Cash flow +30.0/30.0
- DSCR +10.0/10.0
- 1% rule +8.9/10.0
- Schools +6.0/10.0
- ARV discount +5.7/15.0
- Livability +3.6/5.0
- Rent growth +2.5/5.0
- Condition / age +2.5/5.0
- Appreciation +0.0/10.0
$935,000
🖨 Deal sheet 📄 Offer letter ✓ Due diligence
Listing remarks
This well-maintained Colonial offers comfortable living with many great features, inside and outside. The spacious layout features 4 bedrooms and 2 full bathrooms. The elegant flooring boasts beautiful hardwood floors throughout the main living areas and bedrooms, complemented by stylish granite flooring in the entrance hall and kitchen. The modern eat-in-kitchen features granite countertops, stainless steel appliances, and a convenient movable center island for meal preparation and casual dining. Door out to yard from kitchen. Relax in the spacious family room with window seat or in the living room and enjoy special occasion meals in the formal dining room. The primary bedroom retreat offe
Key facts
- 0.23 acre lot
- Garage
- Community pool
Property features AI
Finance
- Other: Additional parcel(s) included
- HOA & community: Community amenities include park, playground, and pool
Exterior
- Parking: Driveway; Garage with automatic opener; Total parking for 4 vehicles; 1 garage space
- Utilities: Con-Edison electric; Public sewer; Public water connected; Cable available; Public trash collection
- Home design: Single family residence; Updated / remodeled; Two-story
- Construction: Vinyl siding; Block foundation
- Exterior features: Patio; Basketball hoop; Mailbox; Back yard; Front yard; Landscaped grounds; Stone/brick wall
Interior
- Kitchen: Dishwasher; Microwave; Range; Refrigerator; Stainless steel appliances; Granite counters; Kitchen island; Eat-in kitchen
- Bedrooms: Two levels (total rooms: 8)
- Flooring: Hardwood; Ceramic tile; Other flooring
- Bathrooms: 2 full bathrooms
- Heating & cooling: Forced air heating (oil); Central air conditioning; Ductwork
- Interior features: Ceiling fans; Chandelier; Double vanity; Eat-in kitchen; Entrance foyer; Formal dining room; Granite countertops; Kitchen island; Storage space; Washer/dryer hookup; Blinds and window screens; Patio access
- Laundry & utility: Washer hookup; Electric dryer hookup; Dryer included; Washer included; Oil water heater; Dehumidifier
Neighborhood map
What this means for you Summary
Snapshot
- This is a 4-bed/2.0-bath single-family listed at $935k.
Deal economics
- At list price, monthly cash flow is $3k ($42k/yr) — positive.
- The deal already cash-flows at list — no discount required.
- Meets the 1% rule at list price ($13k rent vs $935k).
- Recommended offer: $921k (1.5% below list) — sets the bar for market timing.
Location & tenants
- Location reads 71/100 on livability (#399 in NY) — a middle-class / working-renter tenant base. Strengths: crime A+, commute A+, employment A+; Watch: amenities F, cost of living F, health & safety F.
- Mount Pleasant Central School District (suburban): math 62% / reading 65% proficiency, ranked #146 of 590 in NY (top 25%) — acceptable for families but not a draw, mixed tenant base, ~2y average lease; only 5% free/reduced lunch — higher-income household profile.
- Zoned schools: Hawthorne Elementary School (460 students, 10% FRL); Westlake Middle School (math 55% / reading 61%, grade B, #184 of 729 statewide, top 25%, 429 students, 14% FRL); Westlake High School (math 72% / reading 95%, grade A, #409 of 1,100 statewide, top 39%, 547 students, 19% FRL).
- Market conditions: 17 active listings in the ZIP; 1 comparable units currently listed for rent nearby; 954 units permitted in Westchester County in 2024 (649 in 5+ unit buildings).
Forward outlook
- Local home prices are declining (-3.0%/yr); year-one equity from $6k of loan paydown is wiped out by about $28k of value loss. Plan a longer hold.
- Westchester County population projected at +10% by 2050 — modest demand growth; plan on rents tracking national, not racing it.
- At projected returns (-3.0% appreciation + 3.0% rent growth), your $262k cash investment doubles in ~8 years — after that, you're playing with house money.
Negotiation context
- It's been on market 18 days — a 2% lower offer ($921k) is reasonable based on typical stale-listing flexibility.
- 3 sale attempts with the ask held roughly flat each time — persistent listings suggest the price (not the market) is what's stuck; bring a comps-based counter.
Risks & watch-outs
- Watch-outs: built in 1956 — expect roof / HVAC / electrical / plumbing capex.
- Climate carrying-cost: major wind risk, 27% chance of damaging wind over 30y; extreme-heat days projected 7→14/yr by 2055 (HVAC capex compounding) — expect insurance premiums to compound above CPI over the hold.
Questions for the listing agent
- Built in 1956 — when were the roof, HVAC, electrical panel, plumbing, and water heater last replaced?
- Is there a deadline driving the sale (1031 exchange, divorce, estate, relocation)? That informs how much negotiation room exists.
- Schools are B-rated — typically a magnet for longer-tenancy family renters. What's the average tenant stay here, and is there a school-zone premium baked into asking?
- What's the average days-on-market for RENTAL listings here right now (not sales)? A rising rental-DOM trend means longer vacancies and softer asking-rent achievability than the comps imply.
- What's the recent tenant-quality profile in this submarket — average credit score on applications, eviction rate, late-payment / NSF rate, and stable-employment percentage? A property-management company in the area should have these aggregated.
- How much new for-sale + rental construction is in the pipeline within 1–3 miles? Heavy new supply typically softens prices + rents 12–24 months out; constrained supply supports both.
Investment metrics
- 1% rule
- 1.39% ✓
- Cap rate
- 10.78%
- Cash-on-cash
- 16.04%
- DSCR
- 1.71
- GRM
- 6.0
CMA / ARV
- ARV (on-the-fly)
- $899,872
- Comps found
- 12
Show comp detail 12 sales within ~0.75 mi
| Address | Dist | Beds/Ba | Sqft | Sold | Price | $/sf | Match |
|---|---|---|---|---|---|---|---|
| 322 Linda Ave | 0.02mi | 4/2.0 | 2,000 (+2%) | 10mo | $727,000 | $364 | 86 |
| 284 Warren Ave | 0.15mi | 4/2.0 | 1,954 (+0%) | 10mo | $900,000 | $461 | 85 |
| 284 Marietta Ave | 0.28mi | 3/2.5 (-1) | 1,824 (-7%) | 10mo | $850,000 | $466 | 60 |
| 251 Brady Ave | 0.50mi | 3/2.0 (-1) | 1,934 (-1%) | 12mo | $700,000 | $362 | 60 |
| 206 Myrtle Ave | 0.51mi | 3/1.5 (-1) | 2,003 (+3%) | 8mo | $750,000 | $374 | 58 |
| 14 Aspen Way | 0.39mi | 3/2.5 (-1) | 2,123 (+9%) | 3mo | $800,000 | $377 | 57 |
| 116 Rolling Hills Rd | 0.53mi | 4/2.5 | 2,133 (+9%) | 6mo | $1,250,000 | $586 | 53 |
| 350 Commerce St | 0.34mi | 3/1.5 (-1) | 1,673 (-14%) | 3mo | $830,000 | $496 | 50 |
| 59 Chelsea St | 0.67mi | 3/2.5 (-1) | 1,894 (-3%) | 12mo | $883,000 | $466 | 47 |
| 237 Brady Ave | 0.54mi | 3/2.0 (-1) | 2,200 (+13%) | 3mo | $795,000 | $361 | 46 |
| 263 Memorial Dr | 0.72mi | 4/2.0 | 1,776 (-9%) | 9mo | $840,000 | $473 | 44 |
| 154 Sherman Ave | 0.56mi | 5/1.5 (+1) | 2,181 (+12%) | 12mo | $700,000 | $321 | 37 |
Match score weights: distance 35% · size 25% · config 20% · recency 20%. Top-matched comps best support the ARV.
Projected returns pro-forma
-3.0% appreciation · 3.0% rent growth · sell at horizon
- IRR
- 7.0%
- Equity multiple
- 1.27×
- Total profit
- $71,731
- Equity at exit
- $139,412
- IRR
- 16.4%
- Equity multiple
- 2.34×
- Total profit
- $350,991
- Equity at exit
- $80,842
Cash invested: $261,800 (down + closing). Projections, not guarantees.
Landlord ↔ Tenant lean methodology
- Overall (STATE)
- 15 Strongly Tenant-Friendly
- State New York
- 15 Strongly Tenant-Friendly · D+10
- County
- — inherits STATE
- City
- — inherits STATE
ZIP-level market 10532
- Home prices YoY
- -25.9%
- Active inventory
- 17
- Price-to-rent
- 6.0×
Monthly cashflow live
- Estimated rent
- $12,999 medium interval (Pro) →
- Mortgage (P&I)
- −$4,903
- Tax from tax record
- −$1,477 /mo · $17,728/yr
- Insurance
- −$390
- HOA
- −$0
- Vacancy / Maint / Mgmt
- −$2,730
- Net cashflow
- $3,499
Break-even live
UW: 25.0% down · 7.5% · 30yr · 1.5% tax · 5.0% vac · 8.0% maint · 8.0% mgmt
Financing live
Cash to close
- Down payment
- $233,750
- Closing costs
- $28,050
- Reserves months
- —
- Total cash needed
- —
Loan-product check · same deal, 3 products live
Conventional
25% down · 7.5% · 30yr
- Down + closing
- —
- Monthly P&I
- —
- Monthly cashflow
- —
- DSCR
- —
- Eligible?
- —
Personal DTI + credit; lowest rate.
DSCR
20% down · 8.5% · 30yr
- Down + closing
- —
- Monthly P&I
- —
- Monthly cashflow
- —
- DSCR
- —
- Eligible?
- —
No personal income docs; deal must DSCR.
Hard money
10% down · 12.0% · 12mo
- Down + closing
- —
- Monthly P&I
- —
- Monthly cashflow
- —
- DSCR
- —
- Eligible?
- —
Short-term bridge; refi at stabilization.
Rent comps 1 comps
| Address | Beds | Baths | Sqft | Rent | $/sqft | DOM | Units | Dist |
|---|---|---|---|---|---|---|---|---|
| 10 Foxwood Ln Thornwood, NY | 4.0 | 3.5 | 2026 | $12,999 | $6.42 | 43d | 1 | 1.22mi |
Listing history 8 events
-
2026-06-18days on market $935,000 Active 18 DOM
-
2026-06-17days on market $935,000 Active 17 DOM
-
2026-06-16days on market $935,000 Active 16 DOM
-
2026-06-15days on market $935,000 Active 15 DOM
-
2026-06-13days on market $935,000 Active 13 DOM
-
2026-06-09days on market $935,000 Active 9 DOM
-
2026-06-08remarks 699-char remark
-
2026-06-08$935,000 Active 8 DOM
ⓘ Source: listings_history table (triggers on properties + properties_extension) + one-shot
backfill from property_details.listing_events for pre-trigger history.
Tax reassessment forecast NY · Partial reset (capped growth)
- Current annual tax
- $17,728 · $1,477/mo
- Projected year-2 tax
- $17,728 · $1,477/mo
- Expected delta
- $0/yr ($0/mo · 0.0%)
ⓘ Screening estimate from a state-policy table — verify with the county assessor before closing.
Climate risk First Street
- Flood 1/10 Low FEMA zone X (unshaded) · 0% chance over 30 yrs
- Wildfire 1/10 Low
- Heat 5/10 Major 7 d/yr ≥98°F today · 14 d/yr by 30 yrs out
- Wind 6/10 Major 27% chance of damaging wind over 30 yrs
- Air quality 4/10 Moderate 4 unhealthy d/yr today · 6 by 30 yrs out
Nearby sold comps map
Loading sold comps map…
Walkable amenities ~0.75 mi
Loading nearby amenities…
Taxation est. · year 1
- Rental income
- $155,988
- − Mortgage interest
- −$52,375
- − Property taxes
- −$17,728
- − Insurance
- −$4,675
- − Repairs & maintenance
- −$12,479
- − Management
- −$12,479
- − Depreciation
- −$27,200
- Taxable income
- $29,052
- Est. tax owed @ 24.0%
- −$6,973
- After-tax cash flow
- $35,016/yr
For passive investors: Depreciation is non-cash, so a rental often shows a tax loss while cash-flowing — sheltering income. Rental losses are passive: they offset passive income freely, and up to $25,000/yr can offset ordinary (W-2) income if you actively participate and your MAGI is under $100k (phasing out to $0 by $150k); unused losses carry forward. On sale, claimed depreciation is recaptured at up to 25%, and gains may owe capital-gains tax (a 1031 exchange can defer both). Figures are a year-1 estimate at your 24.0% rate — not tax advice; consult a CPA.
Schools (NCES district)
- District
- Mount Pleasant Central School District
- NCES district ID
- 3620160
- Math proficiency
- 62% ▼ -16.00%
- Reading proficiency
- 65% ▲ 3.00%
- Median HH income
- $109,054
- Composite
- 59.62/100
- National rank
- #911
- State rank
- #146 of 590 in NY
Livability — Hawthorne
- Score
- 71/100
- State rank
- #399
- US rank
- #6922
Category grades
Schools grade is shown separately in the Schools card above.
Census & demographics
- Census place
- Hawthorne, NY
- City population
- 5,253
- Population (ZIP)
- 5,253
Population outlook (Westchester County) Hauer SSP2
- Today (2025)
- 1,028,035 people
- By 2030
- 1,051,636 · +2.3%
- By 2040
- 1,098,520 · +6.9%
- By 2050
- 1,136,044 · +10.5%
- By 2075
- 1,196,925 · +16.4%
- By 2100
- 1,175,147 · +14.3%
Race, ethnicity, and origin ACS 2023
- Neighborhood character
- Predominantly White (85%)
- Race & ethnicity
- White 85% Hispanic / Latino 9% Asian 4% Two or more races 4%
- Hispanic origin (detail)
- Cuban 2% Dominican 4%
- Common ancestry
- Romanian 5% Italian 4% Scotch-Irish 3%
- Foreign-born
- 14% · Canada, Jamaica, China
- Languages at home
- 79% English-only · Other Indo-European 9% Spanish 6% Russian/Polish/Slavic 3%
Political lean MEDSL · Westchester
- 2024 margin
- Strong D (+26.3) · D 63.1% · R 36.9%
- 2008→2024 swing
- -1.3pp toward R · 2008: 27.6pp · 2024: 26.3pp
- All cycles
- 2024: D+26.3 2020: D+36.3 2016: D+32.8 2012: D+22.2 2008: D+27.6
Not yet ingested
- Civics
- —
Market trends
- HPI YoY
- ▼ -98.61%
- Current HPI
- 281.5765
- Rent YoY
- —
- Metro
- —
- State GDP YoY
- ▲ 2.60%
- F500 in state
- 92
Industry mix (Fortune 500 HQ in NY)
| Industry | F500 HQs | Revenue |
|---|---|---|
| Financial Services | 10 | $950B |
|
||
| Consumer Goods | 9 | $162B |
|
||
| Insurance | 4 | $225B |
|
||
| Telecommunications | 2 | $144B |
|
||
| Pharmaceuticals | 2 | $112B |
|
||
| Media / Entertainment | 2 | $69B |
|
||
Price history
+6.3% since first listed5 events — show timeline
- 2026-06-08 Relisted — OneKey® MLS as Distributed by MLS Grid
- 2026-04-30 Listed $935,000 OneKey® MLS as Distributed by MLS Grid
- 2026-04-23 Coming Soon $935,000 OneKey® MLS as Distributed by MLS Grid
- 2025-08-06 Listing Removed — OneKey® MLS as Distributed by MLS Grid
- 2025-07-17 Listed $879,900 OneKey® MLS as Distributed by MLS Grid
Property tax history
+3.2%/yrLatest (2025): $17,728 · -0.5% YoY. Source: county tax records.
Cash-flow waterfall
monthlySold comps — $/sqft
last 12 mo · ≤1 miLoading sold comps…