1536 S 24th St · Omaha, NE
Flood risk 1/10 · Minimal
- FEMA flood zone
- X (unshaded)
- Chance of flooding over 30 yrs
- 0.0%
- Est. flood insurance / yr
- $473 – $860
Fire risk 1/10 · Minimal
- Est. fire insurance / yr
- $1,161 – $2,155
Heat risk 3/10 · Minor
- Hot days now (above 103°F)
- 7 days/yr
- Hot days in 30 yrs
- 15 days/yr
Wind risk 2/10 · Minimal
- Chance of severe wind over 30 yrs
- —
Air-quality risk 1/10 · Minimal
- Unhealthy air days now
- 0 days/yr
- Unhealthy air days in 30 yrs
- 0 days/yr
Risk factors via First Street. Map © Google.
Why this score? — see what drove the D grade
The composite is a weighted blend of 9 inputs, each scored 0–100. Each bar is that input's sub-score; the figure is the points it added to the 100-point composite (weight × sub-score).
- Cash flow +15.3/30.0
- ARV discount +7.5/15.0
- DSCR +4.7/10.0
- Livability +4.2/5.0
- 1% rule +3.8/10.0
- Rent growth +2.7/5.0
- Condition / age +2.5/5.0
- Schools +2.1/10.0
- Appreciation +0.0/10.0
$199,990
🖨 Deal sheet 📄 Offer letter ✓ Due diligence
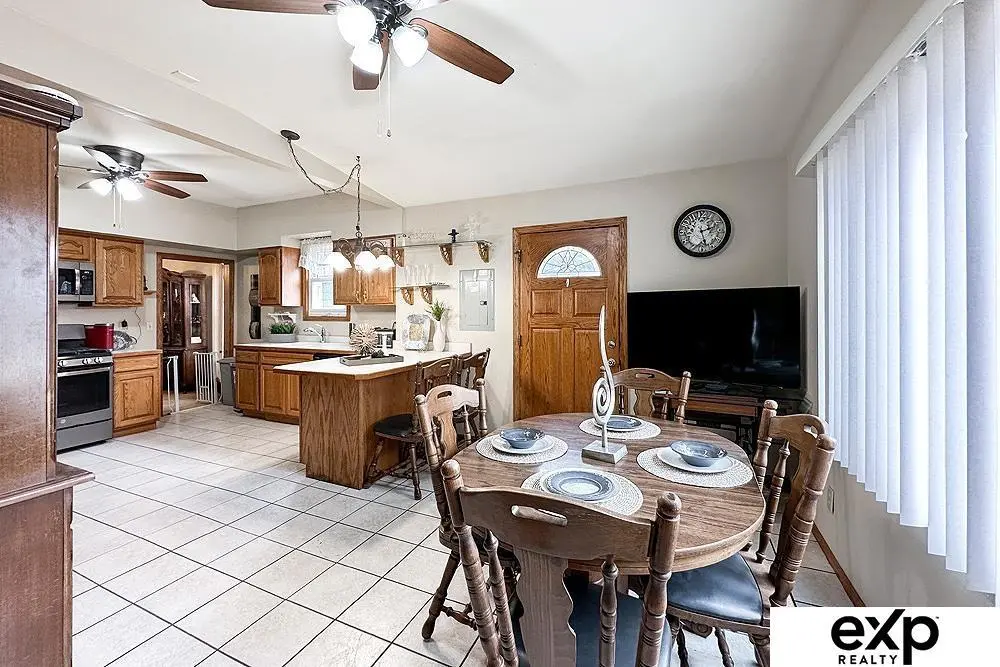
Listing remarks
Full of personality and packed with updates, this 1.5-story Midtown charmer is ready to impress 2 bedrooms on main and 2 bedrooms upstairs! Pull right into the 3-stall parking area and step into your private party patio, oversized storage shed, and fully fenced yard—perfect for entertaining. Enjoy peace of mind with updated roof, maintenance-free vinyl siding, and HVAC. Inside, the expansive kitchen shines with a breakfast bar, abundant cabinetry, and high-end appliances including a gas cooktop. Main floor features laundry, a character-filled dining room, bright living area with natural light, and two bedrooms. Upstairs offers two oversized bedrooms with incredible space. Enclosed fro
Key facts
- High end appliances
- Updated roof
- Private party patio
Tags
Neighborhood map
What this means for you Summary
Snapshot
- This is a 4-bed/1.0-bath other listed at $200k.
Deal economics
- At list price, monthly cash flow is $73 ($877/yr) — positive.
- The deal already cash-flows at list — no discount required.
- To meet the 1% rule (rent ≥ 1% of price), the offer needs to be $177k (11.7% below list).
- Recommended offer: $177k (11.7% below list) — sets the bar for 1% rule.
- Cap rate 6.7% vs local median 3.6% in Omaha — top-decile yield for the area; either an underpriced asset or a hidden risk that comps aren't pricing in. Stress-test before assuming the spread holds.
Location & tenants
- Location reads 84/100 on livability (#7 in NE, #663 nationally) — a professional / high-income tenant draw. Strengths: amenities A+, commute A+, cost of living A+; Watch: crime F.
- Omaha Public Schools (urban): math 20% / reading 28% proficiency, ranked #110 of 111 in NE (top 99%) — low school quality limits family demand, transient renter base, plan for 1-2y turnover; 62% free/reduced lunch — lower-income household profile, screen leases tightly.
- Zoned schools: Liberty Elementary School (math 10% / reading 15%, grade F, #487 of 502 statewide, top 97%, 626 students, 0% FRL); Norris Middle School (math 11% / reading 16%, grade F, #126 of 128 statewide, top 98%, 1,187 students, 0% FRL); Central High School (math 29% / reading 40%, grade F, #208 of 261 statewide, top 86%, 2,738 students, 0% FRL) — zoned schools average 0% FRL vs 62% district-wide (62 pts lower); this property's tenant base skews higher-income than the district average.
- Market conditions: Rents flat; 73 active listings in the ZIP; 23 comparable units currently listed for rent nearby; rentals at typical pace (median 14d on market — plan ~3-4 weeks tenant-placement turnaround); 4,539 units permitted in Douglas County in 2024 (2,583 in 5+ unit buildings).
- This rent runs 40% of the median local income ($54k/yr) — at the standard rent-burdened threshold; future hikes will face affordability resistance.
Forward outlook
- Local home prices are declining (-3.0%/yr); year-one equity from $1k of loan paydown is wiped out by about $6k of value loss. Plan a longer hold.
- Douglas County population projected at +28% by 2050 — long-run rental-demand tailwind backs the buy-and-hold thesis.
Negotiation context
- Only 3 days on market — expect competitive offers; lowballing is unlikely to land.
- 6 sale attempts since 4y ago with the ask held roughly flat each time — persistent listings suggest the price (not the market) is what's stuck; bring a comps-based counter.
Risks & watch-outs
- Watch-outs: built in 1912 — expect roof / HVAC / electrical / plumbing capex.
Questions for the listing agent
- Built in 1912 — when were the roof, HVAC, electrical panel, plumbing, and water heater last replaced?
- Is there a deadline driving the sale (1031 exchange, divorce, estate, relocation)? That informs how much negotiation room exists.
- Crime grade is F in this area — have there been break-ins, vandalism, or insurance claims at this property in the last 3 years? What carrier currently insures it and at what premium?
- The area grade is low — what's the realistic commute time and amenity access for the typical tenant pool here? Any planned neighborhood developments (good or bad) we should know about?
- What's the average days-on-market for RENTAL listings here right now (not sales)? A rising rental-DOM trend means longer vacancies and softer asking-rent achievability than the comps imply.
- What's the recent tenant-quality profile in this submarket — average credit score on applications, eviction rate, late-payment / NSF rate, and stable-employment percentage? A property-management company in the area should have these aggregated.
- How much new for-sale + rental construction is in the pipeline within 1–3 miles? Heavy new supply typically softens prices + rents 12–24 months out; constrained supply supports both.
Investment metrics
- 1% rule
- 0.88% ✗
- Cap rate
- 6.73%
- Cash-on-cash
- 1.57%
- DSCR
- 1.07
- GRM
- 9.4
CMA / ARV
No comps found within radius.
Projected returns pro-forma
-3.0% appreciation · 0.85% rent growth · sell at horizon
- IRR
- -16.2%
- Equity multiple
- 0.44×
- Total profit
- $-31,501
- Equity at exit
- $29,819
- IRR
- -12.0%
- Equity multiple
- 0.35×
- Total profit
- $-36,176
- Equity at exit
- $17,291
Cash invested: $55,997 (down + closing). Projections, not guarantees.
Landlord ↔ Tenant lean methodology
- Overall (STATE)
- 83 Strongly Landlord-Friendly
- State Nebraska
- 83 Strongly Landlord-Friendly · R+13
- County
- — inherits STATE
- City
- — inherits STATE
ZIP-level market 68108
- Home prices YoY
- -19.0%
- Rents YoY
- 0.8%
- Active inventory
- 73
- Price-to-rent
- 9.4×
Monthly cashflow live
- Estimated rent
- $1,766 high interval (Pro) →
- Mortgage (P&I)
- −$1,049
- Tax from tax record
- −$190 /mo · $2,280/yr
- Insurance
- −$83
- HOA
- −$0
- Vacancy / Maint / Mgmt
- −$371
- Net cashflow
- $73
Break-even live
UW: 25.0% down · 7.5% · 30yr · 1.5% tax · 5.0% vac · 8.0% maint · 8.0% mgmt
Financing live
Cash to close
- Down payment
- $49,998
- Closing costs
- $6,000
- Reserves months
- —
- Total cash needed
- —
Loan-product check · same deal, 3 products live
Conventional
25% down · 7.5% · 30yr
- Down + closing
- —
- Monthly P&I
- —
- Monthly cashflow
- —
- DSCR
- —
- Eligible?
- —
Personal DTI + credit; lowest rate.
DSCR
20% down · 8.5% · 30yr
- Down + closing
- —
- Monthly P&I
- —
- Monthly cashflow
- —
- DSCR
- —
- Eligible?
- —
No personal income docs; deal must DSCR.
Hard money
10% down · 12.0% · 12mo
- Down + closing
- —
- Monthly P&I
- —
- Monthly cashflow
- —
- DSCR
- —
- Eligible?
- —
Short-term bridge; refi at stabilization.
Rent comps 23 comps
| Address | Beds | Baths | Sqft | Rent | $/sqft | DOM | Units | Dist |
|---|---|---|---|---|---|---|---|---|
| 1012 S 24th St Omaha, NE | 1.0–3.0 | 1.0 | 918 | $1,150 | $1.25 | 2d | 5 | 0.41mi |
| 1618 Martha St Unit 2 (Top) Omaha, NE | 3.0 | 1.0 | 1117 | $1,150 | $1.03 | 43d | 1 | 0.60mi |
| 1029 Park Ave Unit 3B Omaha, NE | 3.0 | 1.0 | 1112 | $1,295 | $1.16 | 43d | 1 | 0.60mi |
| 629 S 19th Ave Omaha, NE | 3.0 | 2.0 | 1364 | $1,350 | $0.99 | 43d | 1 | 0.71mi |
| 806 Park Ave Omaha, NE | 3.0 | 3.0 | 1650 | $2,395 | $1.45 | 23d | 2 | 0.73mi |
| 554 S 26th Ave Omaha, NE | 3.0 | 1.0 | 1484 | $1,400 | $0.94 | 2d | 1 | 0.74mi |
| 2219 S 14th St Omaha, NE | 3.0 | 2.0 | 1224 | $1,380 | $1.13 | 43d | 1 | 0.75mi |
| 2211 Howard St Omaha, NE | 3.0 | 1.0–3.0 | 837 | $2,410 | $2.88 | 2d | 48 | 0.77mi |
| 528 S 26th Ave Ste B Omaha, NE | 4.0 | 1.0 | 1748 | $1,650 | $0.94 | 2d | 1 | 0.80mi |
| 2915 Jackson St Unit 2 Omaha, NE | 3.0 | 1.0 | 1100 | $1,195 | $1.09 | 2d | 1 | 0.82mi |
| 424 S 24th St Unit 109 Omaha, NE | 4.0 | 2.0 | 1170 | $1,400 | $1.20 | 2d | 1 | 0.82mi |
| 542 S 29th St Omaha, NE | 3.0 | 1.5 | 1442 | $1,750 | $1.21 | 14d | 1 | 0.84mi |
| 3124 S 21st St Omaha, NE | 3.0 | 2.0 | 1325 | $1,745 | $1.32 | 19d | 1 | 0.99mi |
| 3001 Harney St Omaha, NE | 3.0 | 3.0 | 1764 | $2,395 | $1.36 | 43d | 1 | 1.00mi |
| 2612 S 12th St Omaha, NE | 3.0 | 2.0 | 1100 | $2,100 | $1.91 | 14d | 1 | 1.00mi |
| 3403 Arbor St Omaha, NE | 5.0 | 2.0 | 1556 | $2,500 | $1.61 | 2d | 1 | 1.02mi |
| 206 S 19th St Omaha, NE | 1.0–3.0 | 1.0–3.0 | 918 | $1,935 | $2.11 | 2d | 60 | 1.03mi |
| 1919 Dahlman Rows Plz Omaha, NE | 3.0 | 3.5 | 1800 | $2,800 | $1.56 | 14d | 1 | 1.16mi |
| 3209 S 32nd Ave Omaha, NE | 3.0 | 2.0 | 1872 | $1,995 | $1.07 | 43d | 1 | 1.23mi |
| 3940 Arbor St Omaha, NE | 3.0 | 1.0 | 1316 | $1,800 | $1.37 | 43d | 1 | 1.47mi |
| 106 S 36th St Omaha, NE | 3.0 | 3.0 | 1750 | $2,275 | $1.30 | 2d | 1 | 1.48mi |
| 4015 Marcy St Omaha, NE | 3.0 | 1.0 | 1238 | $1,695 | $1.37 | 14d | 1 | 1.49mi |
| 411 S 38th Ave Omaha, NE | 3.0 | 3.0 | 1872 | $1,995 | $1.07 | 43d | 1 | 1.50mi |
Listing history 14 events
-
2026-04-25status Pending
-
2026-04-21$199,990 New
-
2026-04-21historical
-
2026-04-08$225,000 New
-
2026-04-08historical
-
2026-03-28price $235,000
-
2026-03-25$250,000 New
-
2026-03-24historical
-
2026-03-21$250,000
-
2023-07-27historical
-
2023-04-25price $240,000
-
2023-03-23$250,000 New
-
2022-10-13historical
-
2022-08-26$250,000 Active - New
ⓘ Source: listings_history table (triggers on properties + properties_extension) + one-shot
backfill from property_details.listing_events for pre-trigger history.
Tax reassessment forecast NE · Resets to sale price
- Current annual tax
- $2,280 · $190/mo
- Projected year-2 tax
- $3,460 · $288/mo
- Expected delta
- +$1,180/yr (+$98/mo · 51.7%)
ⓘ Screening estimate from a state-policy table — verify with the county assessor before closing.
Climate risk First Street
- Flood 1/10 Low FEMA zone X (unshaded) · 0% chance over 30 yrs
- Wildfire 1/10 Low
- Heat 3/10 Moderate 7 d/yr ≥103°F today · 15 d/yr by 30 yrs out
- Wind 2/10 Low
- Air quality 1/10 Low 0 unhealthy d/yr today · 0 by 30 yrs out
Nearby sold comps map
Loading sold comps map…
Walkable amenities ~0.75 mi
Loading nearby amenities…
Taxation est. · year 1
- Rental income
- $21,193
- − Mortgage interest
- −$11,203
- − Property taxes
- −$2,280
- − Insurance
- −$1,000
- − Repairs & maintenance
- −$1,695
- − Management
- −$1,695
- − Depreciation
- −$5,818
- Taxable loss
- −$2,498
- Est. tax savings @ 24.0%
- +$600
- After-tax cash flow
- $1,477/yr
For passive investors: Depreciation is non-cash, so a rental often shows a tax loss while cash-flowing — sheltering income. Rental losses are passive: they offset passive income freely, and up to $25,000/yr can offset ordinary (W-2) income if you actively participate and your MAGI is under $100k (phasing out to $0 by $150k); unused losses carry forward. On sale, claimed depreciation is recaptured at up to 25%, and gains may owe capital-gains tax (a 1031 exchange can defer both). Figures are a year-1 estimate at your 24.0% rate — not tax advice; consult a CPA.
Schools (NCES district)
- District
- Omaha Public Schools
- NCES district ID
- 3174820
- Math proficiency
- 20% ▼ -10.00%
- Reading proficiency
- 28% ▼ -5.00%
- Median HH income
- $46,039
- Composite
- 20.83/100
- National rank
- #8502
- State rank
- #110 of 111 in NE
Livability — Omaha
- Score
- 84/100
- State rank
- #7
- US rank
- #663
Category grades
Schools grade is shown separately in the Schools card above.
Census & demographics
- Census place
- Omaha, NE
- County
- Douglas County · 538,646 people
- City population
- 552,986
- Metro
- Omaha-Council Bluffs, NE-IA
- Population (ZIP)
- 14,578
- Household income
- $53,609
- Rent vs Own
- Severe rent burden
- 511.0
Population outlook (Douglas County) Hauer SSP2
- Today (2025)
- 625,245 people
- By 2030
- 661,613 · +5.8%
- By 2040
- 732,395 · +17.1%
- By 2050
- 801,988 · +28.3%
- By 2075
- 968,637 · +54.9%
- By 2100
- 1,101,871 · +76.2%
Race, ethnicity, and origin ACS 2023
- Neighborhood character
- Diverse neighborhood (Simpson 0.57)
- Race & ethnicity
- Hispanic / Latino 47% White 45% Two or more races 18% Black 2% Native American 2% Asian 1%
- Hispanic origin (detail)
- Mexican 33%
- Common ancestry
- Romanian 3% Lithuanian 2% Portuguese 2%
- Foreign-born
- 21% · Canada
- Languages at home
- 57% English-only · Spanish 40% Korean 2%
Political lean MEDSL · Douglas
- 2024 margin
- D (+10.2) · D 54.4% · R 44.2% · Other 1.4%
- 2008→2024 swing
- +5.5pp toward D · 2008: 4.6pp · 2024: 10.2pp
- All cycles
- 2024: D+10.2 2020: D+11.3 2016: D+1.4 2012: R+4.3 2008: D+4.6
Not yet ingested
- Civics
- —
Market trends
- HPI YoY
- ▼ -75.17%
- Current HPI
- 320.3596
- Rent YoY
- ▲ 0.85%
- Metro
- Omaha-Council Bluffs, NE-IA
- State GDP YoY
- ▲ 0.68%
- F500 in state
- 2
Industry mix (Fortune 500 HQ in NE)
| Industry | F500 HQs | Revenue |
|---|---|---|
| Conglomerate | 1 | $371B |
|
||
Price history
-20.0% since first listed14 events — show timeline
- 2026-04-25 Pending — GPRMLS
- 2026-04-21 Listing Removed — GPRMLS
- 2026-04-21 Listed $199,990 GPRMLS
- 2026-04-08 Listing Removed — GPRMLS
- 2026-04-08 Listed $225,000 GPRMLS
- 2026-03-28 Price Changed $235,000 GPRMLS
- 2026-03-25 Listed $250,000 GPRMLS
- 2026-03-24 Listing Removed — GPRMLS
- 2026-03-21 Listed $250,000 GPRMLS
- 2023-07-27 Listing Removed — GPRMLS
- 2023-04-25 Price Changed $240,000 GPRMLS
- 2023-03-23 Listed $250,000 GPRMLS
- 2022-10-13 Listing Removed — GPRMLS
- 2022-08-26 Listed $250,000 GPRMLS
Property tax history
+6.1%/yrLatest (2024): $2,280 · +76.5% YoY. Source: county tax records.
Cash-flow waterfall
monthlySold comps — $/sqft
last 12 mo · ≤1 miLoading sold comps…