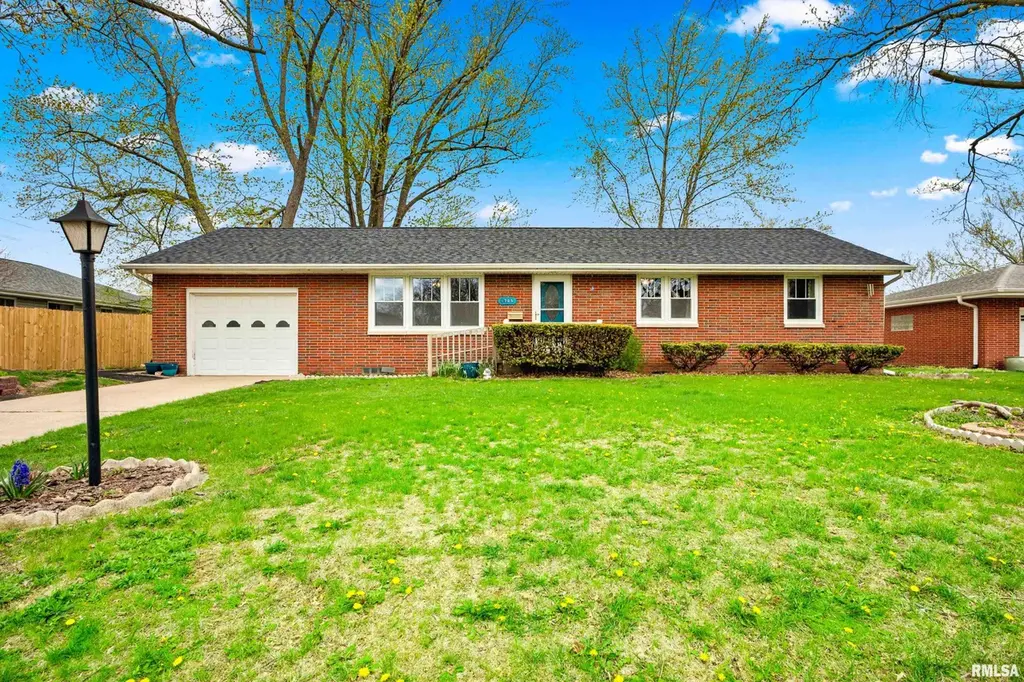
1705 W Lake Ave · Peoria, IL
Flood risk 1/10 · Minimal
- FEMA flood zone
- X
- Chance of flooding over 30 yrs
- 0.0%
- Est. flood insurance / yr
- $473 – $860
Fire risk 1/10 · Minimal
- Est. fire insurance / yr
- $804 – $1,492
Heat risk 3/10 · Minor
- Hot days now (above 104°F)
- 7 days/yr
- Hot days in 30 yrs
- 18 days/yr
Wind risk 2/10 · Minimal
- Chance of severe wind over 30 yrs
- 1.0%
Air-quality risk 3/10 · Minor
- Unhealthy air days now
- 1 days/yr
- Unhealthy air days in 30 yrs
- 3 days/yr
Risk factors via First Street. Map © Google.
Why this score? — see what drove the F grade
The composite is a weighted blend of 9 inputs, each scored 0–100. Each bar is that input's sub-score; the figure is the points it added to the 100-point composite (weight × sub-score).
- Appreciation +5.0/10.0
- Cash flow +4.9/30.0
- Livability +3.7/5.0
- Rent growth +2.5/5.0
- Condition / age +2.5/5.0
- Schools +1.1/10.0
- 1% rule +0.8/10.0
- DSCR +0.0/10.0
- ARV discount +0.0/15.0
$209,900
🖨 Deal sheet 📄 Offer letter ✓ Due diligence
Listing remarks
This all-brick ranch home offers numerous updates, including a completely remodeled kitchen featuring stainless steel appliance, beautiful backsplash and countertop. This three bedroom home boasts hardwood floors in the bedrooms, six-panel solid-core doors, and new luxury vinyl tile throughout the living room, kitchen and dining area. The main floor bathroom features a Corion countertops, ceramic tile and a jetted tub. The basement offers additional living space with a rec room, new flooring, laundry area, shower and sink. Enjoy the fenced backyard, perfect for outdoor living. Recent updates include new kitchen (2025) new roof (2025) new flooring (2024). This home is move-in ready and has s
Key facts
- Corion countertops
- Remodeled kitchen
- Luxury vinyl tile
Tags
Neighborhood map
What this means for you Summary
Snapshot
- This is a 3-bed/1.0-bath single-family listed at $210k.
Deal economics
- At list price, monthly cash flow is $-505 ($-6k/yr) — negative.
- To cash-flow at today's rent, offer at most $121k (42.5% below list).
- To meet the 1% rule (rent ≥ 1% of price), the offer needs to be $122k (41.8% below list).
- Recommended offer: $121k (42.5% below list) — sets the bar for cash-flow.
- Cap rate 3.4% vs local median 5.6% in Peoria — below-typical yield; the buyer is paying a premium for something (appreciation thesis, condition, location) that the cap rate doesn't capture.
Location & tenants
- Location reads 73/100 on livability (#270 in IL) — a middle-class / working-renter tenant base. Strengths: commute A+, cost of living A+, housing A+; Watch: employment D+, crime F.
- Peoria SD 150 (urban): math 11% / reading 14% proficiency, ranked #554 of 620 in IL (top 89%) — low school quality limits family demand, transient renter base, plan for 1-2y turnover; 70% free/reduced lunch — lower-income household profile, screen leases tightly.
- Zoned schools: Richwoods High School (math 30% / reading 35%, grade F, #152 of 693 statewide, top 22%, 1,580 students, 0% FRL) — zoned schools average 0% FRL vs 70% district-wide (70 pts lower); this property's tenant base skews higher-income than the district average.
- Zoned-school proficiency averages 32% at this address vs 12% district-wide (+20 pts) — the actual schools serving this property are materially stronger than the Peoria SD 150 average implies; a family-tenant draw the district grade alone would hide.
- Market conditions: 1 active listings in the ZIP; 20 comparable units currently listed for rent nearby; rentals leasing fast (median 14d on market — plan ~1-2 weeks tenant-placement turnaround); 73 units permitted in Peoria County in 2024 (0 in 5+ unit buildings).
Forward outlook
- In year one you build about $8k of equity ($1k loan paydown + $6k appreciation (3.0% local appreciation)).
- Peoria County population projected at -11% by 2050 — secular population decline; favor cash flow + early exit over multi-decade hold.
- By year 5, paydown + projected appreciation supports a ~$34k cash-out refi (75% LTV) — recoverable capital for the next deal without selling this one.
Negotiation context
- Only 4 days on market — expect competitive offers; lowballing is unlikely to land.
Risks & watch-outs
- Watch-outs: built in 1958 — expect roof / HVAC / electrical / plumbing capex.
Questions for the listing agent
- What do current leases actually rent for vs. the listed asking? Can we see a recent rent roll and the last 12 months of T-12 income?
- Built in 1958 — when were the roof, HVAC, electrical panel, plumbing, and water heater last replaced?
- Is there a deadline driving the sale (1031 exchange, divorce, estate, relocation)? That informs how much negotiation room exists.
- Schools are F-rated, which usually means shorter tenancies and higher turnover. Who's the typical renter profile here, and what's been the actual vacancy rate?
- Crime grade is F in this area — have there been break-ins, vandalism, or insurance claims at this property in the last 3 years? What carrier currently insures it and at what premium?
- The area grade is low — what's the realistic commute time and amenity access for the typical tenant pool here? Any planned neighborhood developments (good or bad) we should know about?
- What's the average days-on-market for RENTAL listings here right now (not sales)? A rising rental-DOM trend means longer vacancies and softer asking-rent achievability than the comps imply.
- What's the recent tenant-quality profile in this submarket — average credit score on applications, eviction rate, late-payment / NSF rate, and stable-employment percentage? A property-management company in the area should have these aggregated.
- How much new for-sale + rental construction is in the pipeline within 1–3 miles? Heavy new supply typically softens prices + rents 12–24 months out; constrained supply supports both.
Investment metrics
- 1% rule
- 0.58% ✗
- Cap rate
- 3.41%
- Cash-on-cash
- -10.31%
- DSCR
- 0.54
- GRM
- 14.3
CMA / ARV
- ARV (on-the-fly)
- $164,970
- Comps found
- 12
Show comp detail 12 sales within ~0.75 mi
| Address | Dist | Beds/Ba | Sqft | Sold | Price | $/sf | Match |
|---|---|---|---|---|---|---|---|
| 1403 W Clarewood Ave | 0.35mi | 3/2.0 | 1,200 (-2%) | 4mo | $189,000 | $158 | 74 |
| 4527 N Nelson Dr | 0.21mi | 3/1.5 | 1,176 (-4%) | 10mo | $220,000 | $187 | 74 |
| 4931 N Bevalon Pl | 0.60mi | 3/2.0 | 1,248 (+2%) | 4mo | $168,000 | $135 | 62 |
| 4415 N Rosemead Dr | 0.11mi | 3/1.0 | 1,038 (-15%) | 11mo | $198,000 | $191 | 61 |
| 1106 W Northcrest Ave | 0.63mi | 2/1.0 (-1) | 1,170 (-4%) | 9mo | $170,000 | $145 | 51 |
| 1021 W Westwood Dr | 0.73mi | 3/1.5 | 1,360 (+11%) | 1mo | $180,000 | $132 | 44 |
| 1202 W Purtscher Dr | 0.50mi | 3/1.5 | 1,050 (-14%) | 11mo | $162,000 | $154 | 42 |
| 2227 W Westport Rd | 0.58mi | 3/1.0 | 1,056 (-14%) | 10mo | $140,000 | $133 | 42 |
| 1515 W Sunnyview Dr | 0.74mi | 3/2.0 | 1,360 (+11%) | 2mo | $175,000 | $129 | 41 |
| 5008 N Bevalon Pl | 0.63mi | 2/2.0 (-1) | 1,358 (+11%) | 5mo | $143,000 | $105 | 39 |
| 1008 W Stratford Dr | 0.72mi | 2/1.0 (-1) | 1,109 (-9%) | 11mo | $100,000 | $90 | 37 |
| 4011 N Sterling Ave | 0.73mi | 3/1.5 | 1,040 (-15%) | 5mo | $105,000 | $101 | 35 |
Match score weights: distance 35% · size 25% · config 20% · recency 20%. Top-matched comps best support the ARV.
Projected returns pro-forma
3.0% appreciation · 3.0% rent growth · sell at horizon
- IRR
- -2.0%
- Equity multiple
- 0.88×
- Total profit
- $-6,849
- Equity at exit
- $94,380
- IRR
- 2.3%
- Equity multiple
- 1.35×
- Total profit
- $20,772
- Equity at exit
- $145,451
Cash invested: $58,772 (down + closing). Projections, not guarantees.
Landlord ↔ Tenant lean methodology
- Overall (STATE)
- 43 Moderately Tenant-Leaning
- State Illinois
- 43 Moderately Tenant-Leaning · D+7
- County
- — inherits STATE
- City
- — inherits STATE
ZIP-level market 61614-5620
- Active inventory
- 1
- Price-to-rent
- 14.3×
Monthly cashflow live
- Estimated rent
- $1,222 high interval (Pro) →
- Mortgage (P&I)
- −$1,101
- Tax from tax record
- −$282 /mo · $3,387/yr
- Insurance
- −$87
- HOA
- −$0
- Vacancy / Maint / Mgmt
- −$257
- Net cashflow
- $-505
Break-even live
UW: 25.0% down · 7.5% · 30yr · 1.5% tax · 5.0% vac · 8.0% maint · 8.0% mgmt
Financing live
Cash to close
- Down payment
- $52,475
- Closing costs
- $6,297
- Reserves months
- —
- Total cash needed
- —
Loan-product check · same deal, 3 products live
Conventional
25% down · 7.5% · 30yr
- Down + closing
- —
- Monthly P&I
- —
- Monthly cashflow
- —
- DSCR
- —
- Eligible?
- —
Personal DTI + credit; lowest rate.
DSCR
20% down · 8.5% · 30yr
- Down + closing
- —
- Monthly P&I
- —
- Monthly cashflow
- —
- DSCR
- —
- Eligible?
- —
No personal income docs; deal must DSCR.
Hard money
10% down · 12.0% · 12mo
- Down + closing
- —
- Monthly P&I
- —
- Monthly cashflow
- —
- DSCR
- —
- Eligible?
- —
Short-term bridge; refi at stabilization.
Rent comps 20 comps
| Address | Beds | Baths | Sqft | Rent | $/sqft | DOM | Units | Dist |
|---|---|---|---|---|---|---|---|---|
| 4010 N Brandywine Dr Peoria, IL | 1.0–2.0 | 1.0–2.0 | 797 | $1,082 | $1.36 | 13d | 17 | 0.25mi |
| 1915 W Marlene Ave Unit B Peoria, IL | 2.0 | 1.5 | 1200 | $1,275 | $1.06 | 21d | 1 | 0.36mi |
| 1308 W Covington Ct Peoria, IL | 2.0 | 1.5 | 975 | $1,170 | $1.20 | 21d | 1 | 0.48mi |
| 1327 W Covington Ct Peoria, IL | 2.0 | 2.0 | 1025 | $1,295 | $1.26 | 43d | 1 | 0.49mi |
| 2020 W Glen Ave Peoria, IL | 3.0 | 2.0 | 1320 | $1,700 | $1.29 | 13d | 1 | 0.56mi |
| 4020 N Bryer Pl Peoria, IL | 2.0 | 1.0 | 720 | $1,250 | $1.74 | 21d | 1 | 0.60mi |
| 3629 N Leroy Ave Unit A Peoria, IL | 2.0 | 1.0 | 1000 | $1,150 | $1.15 | 43d | 1 | 0.71mi |
| 811 W Purtscher Dr Peoria, IL | 3.0 | 1.0 | 864 | $1,100 | $1.27 | 43d | 1 | 0.77mi |
| W Crestwood Dr Peoria, IL | 1.0–2.0 | 1.0 | 800 | $975 | $1.22 | 13d | 4 | 0.81mi |
| 751 W Joan Ct Peoria, IL | 2.0 | 2.0 | 1000 | $1,150 | $1.15 | 13d | 1 | 0.83mi |
| 2805 W Larchmont Ln Peoria, IL | 1.0–2.0 | 1.0 | 695 | $1,060 | $1.53 | 13d | 3 | 0.87mi |
| 3108 N Parish Ave Peoria, IL | 3.0 | 1.5 | 967 | $1,750 | $1.81 | 43d | 1 | 1.13mi |
| 1413 W Gilbert Ave Peoria, IL | 2.0 | 2.0 | 1428 | $1,500 | $1.05 | 13d | 1 | 1.23mi |
| 3601 N Kingston Dr Peoria, IL | 2.0 | 2.0 | 1030 | $1,420 | $1.38 | 13d | 3 | 1.32mi |
| 2920 N Rockwood Dr Apt B Peoria, IL | 2.0 | 1.0 | 800 | $895 | $1.12 | 13d | 1 | 1.33mi |
| 2700 W Forrest Hill Ave Peoria, IL | 2.0 | 1.0 | 850 | $850 | $1.00 | 43d | 1 | 1.34mi |
| 2511 W Wardcliffe Dr Unit H Peoria, IL | 2.0 | 1.0 | 800 | $875 | $1.09 | 43d | 1 | 1.34mi |
| 4809 Knoxville Ave Unit 4819 4B, 5A, & 5B Peoria, IL | 3.0 | 2.0 | 700 | $1,800 | $2.57 | 13d | 1 | 1.35mi |
| 126 E Lake Ave Peoria, IL | 2.0 | 1.0 | 950 | $1,050 | $1.11 | 13d | 9 | 1.42mi |
| 2800 W War Memorial Dr Peoria, IL | 2.0 | 1.5 | 950 | $949 | $1.00 | 13d | 3 | 1.47mi |
Listing history 2 events
-
2026-04-27status Pending
-
2026-04-23$209,900 Active
ⓘ Source: listings_history table (triggers on properties + properties_extension) + one-shot
backfill from property_details.listing_events for pre-trigger history.
Tax reassessment forecast IL · Partial reset (capped growth)
- Current annual tax
- $3,387 · $282/mo
- Projected year-2 tax
- $4,076 · $340/mo
- Expected delta
- +$689/yr (+$57/mo · 20.3%)
ⓘ Screening estimate from a state-policy table — verify with the county assessor before closing.
Climate risk First Street
- Flood 1/10 Low FEMA zone X · 0% chance over 30 yrs
- Wildfire 1/10 Low
- Heat 3/10 Moderate 7 d/yr ≥104°F today · 18 d/yr by 30 yrs out
- Wind 2/10 Low 100% chance of damaging wind over 30 yrs
- Air quality 3/10 Moderate 1 unhealthy d/yr today · 3 by 30 yrs out
Nearby sold comps map
Loading sold comps map…
Walkable amenities ~0.75 mi
Loading nearby amenities…
Taxation est. · year 1
- Rental income
- $14,664
- − Mortgage interest
- −$11,758
- − Property taxes
- −$3,387
- − Insurance
- −$1,050
- − Repairs & maintenance
- −$1,173
- − Management
- −$1,173
- − Depreciation
- −$6,106
- Taxable loss
- −$9,982
- Est. tax savings @ 24.0%
- +$2,396
- After-tax cash flow
- $-3,665/yr
For passive investors: Depreciation is non-cash, so a rental often shows a tax loss while cash-flowing — sheltering income. Rental losses are passive: they offset passive income freely, and up to $25,000/yr can offset ordinary (W-2) income if you actively participate and your MAGI is under $100k (phasing out to $0 by $150k); unused losses carry forward. On sale, claimed depreciation is recaptured at up to 25%, and gains may owe capital-gains tax (a 1031 exchange can defer both). Figures are a year-1 estimate at your 24.0% rate — not tax advice; consult a CPA.
Schools (NCES district)
- District
- Peoria SD 150
- NCES district ID
- 1731230
- Math proficiency
- 11% ▼ -5.00%
- Reading proficiency
- 14% ▼ -4.00%
- Median HH income
- $41,951
- Composite
- 10.92/100
- National rank
- #9751
- State rank
- #554 of 620 in IL
Livability — Peoria
- Score
- 73/100
- State rank
- #270
- US rank
- #5096
Category grades
Schools grade is shown separately in the Schools card above.
Census & demographics
- Census place
- Peoria, IL
Population outlook (Peoria County) Hauer SSP2
- Today (2025)
- 183,007 people
- By 2030
- 179,643 · -1.8%
- By 2040
- 171,782 · -6.1%
- By 2050
- 163,508 · -10.7%
- By 2075
- 140,178 · -23.4%
- By 2100
- 114,493 · -37.4%
Not yet ingested
- Political lean
- —
- Race & ethnicity
- —
- Common origin
- —
- Civics
- —
Market trends
- HPI YoY
- —
- Current HPI
- —
- Rent YoY
- —
- Metro
- —
- State GDP YoY
- ▲ 1.59%
- F500 in state
- 60
Industry mix (Fortune 500 HQ in IL)
| Industry | F500 HQs | Revenue |
|---|---|---|
| Insurance | 4 | $201B |
|
||
| Consumer Goods | 4 | $87B |
|
||
| Industrial Machinery | 3 | $64B |
|
||
| Healthcare | 2 | $55B |
|
||
| Retail / Pharmacy | 1 | $148B |
|
||
| Agriculture / Food | 1 | $86B |
|
||
Price history
2 events — show timeline
- 2026-04-27 Pending — RMLSA as Distributed by MLS Grid
- 2026-04-23 Listed $209,900 RMLSA as Distributed by MLS Grid
Property tax history
+2.2%/yrLatest (2024): $3,387 · +24.8% YoY. Source: county tax records.
Cash-flow waterfall
monthlySold comps — $/sqft
last 12 mo · ≤1 miLoading sold comps…