205 White Sandy Dr · Panama City Beach, FL
Flood risk 4/10 · Minor
- FEMA flood zone
- X (unshaded)
- Chance of flooding over 30 yrs
- 0.22%
- Est. flood insurance / yr
- $507 – $1,088
Fire risk 4/10 · Minor
- Est. fire insurance / yr
- $947 – $1,759
Heat risk 10/10 · Severe
- Hot days now (above 106°F)
- 7 days/yr
- Hot days in 30 yrs
- 21 days/yr
Wind risk 9/10 · Severe
- Chance of severe wind over 30 yrs
- 99.0%
Air-quality risk 1/10 · Minimal
- Unhealthy air days now
- 0 days/yr
- Unhealthy air days in 30 yrs
- 0 days/yr
Risk factors via First Street. Map © Google.
Why this score? — see what drove the B- grade
The composite is a weighted blend of 9 inputs, each scored 0–100. Each bar is that input's sub-score; the figure is the points it added to the 100-point composite (weight × sub-score).
- Cash flow +24.5/30.0
- ARV discount +15.0/15.0
- DSCR +7.9/10.0
- 1% rule +6.1/10.0
- Schools +4.3/10.0
- Livability +3.9/5.0
- Condition / age +2.5/5.0
- Rent growth +2.4/5.0
- Appreciation +0.0/10.0
$225,000
🖨 Deal sheet (PDF) 📄 Offer letter ✓ Due diligence
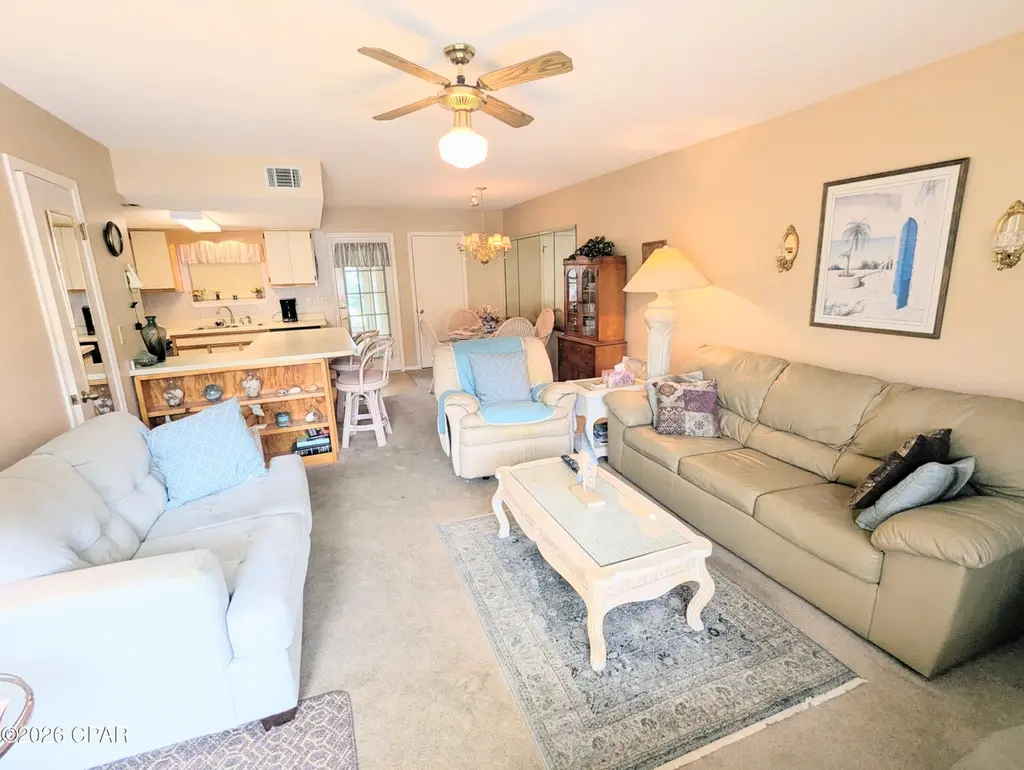
Listing remarks
Looking for your next project? This well cared for townhome is simply in need of a refresh. With 2 bedrooms and 2.5 bathrooms, this home has plenty of living space. Enclosed patios make it live even larger than the square footage shows. The master suite features a separate ''den'' seating area with great views. Ideal location backing up to the community pool. Also, a short stroll to the Gulf! Don't miss your chance to own a like-new beach home at an amazing value! LOW HOA includes: 11 pools (5 heated), shuffleboards, water-front restaurant & pool, mini golf, exercise room, tennis courts, pickleball, playground, WIFI, pest control, termite bond, trash, ground keeping, irrigation, prope
Key facts
- Master suite
- Gated community
- Community pool
Tags
Property features AI
Finance
- HOA & community: Homeowners association present; Association amenities include beach access, gated entry, barbecue area, picnic area; Community features include clubhouse, community pool, gated entry, short-term rentals allowed
Exterior
- Security: Gated community with security gate and guard; 24-hour security; Security fence
- Utilities: Electricity available; Public sewer
- Home design: 2 stories; Zoned for single-family and resort
- Exterior features: Enclosed patio; Patio
Interior
- Kitchen: Electric range
- Bedrooms: Second-floor bedroom (12 x 10); Second-floor bedroom (13 x 12)
- Bathrooms: 2 full bathrooms; 1 half bathroom
- Heating & cooling: Electric heating
- Interior features: Living room on the first floor; Kitchen on the first floor
- Laundry & utility: Electric water heater
Neighborhood map
What this means for you Summary
Snapshot
- This is a 2-bed/2.0-bath townhouse listed at $225k.
Deal economics
- At list price, monthly cash flow is $461 ($6k/yr) — positive.
- The deal already cash-flows at list — no discount required.
- Meets the 1% rule at list price ($2k rent vs $225k).
- Cap rate 8.7% vs local median 2.6% in Panama City Beach — top-decile yield for the area; either an underpriced asset or a hidden risk that comps aren't pricing in. Stress-test before assuming the spread holds.
Location & tenants
- Location reads 78/100 on livability (#172 in FL, #2,624 nationally) — a middle-class / working-renter tenant base. Strengths: crime A+, housing A+, health & safety A+; Watch: amenities D-, commute F.
- Bay (suburban): math 51% / reading 51% proficiency, ranked #29 of 73 in FL (top 40%) — acceptable for families but not a draw, mixed tenant base, ~2y average lease.
- Market conditions: Rents soft (-0.2%/yr); 702 active listings in the ZIP; 23 comparable units currently listed for rent nearby; rentals leasing fast (median 14d on market — plan ~1-2 weeks tenant-placement turnaround); solid renter incomes; 2,473 units permitted in Bay County in 2024 (559 in 5+ unit buildings).
- This rent runs 37% of the median local income ($81k/yr) — at the standard rent-burdened threshold; future hikes will face affordability resistance.
Forward outlook
- Local home prices are declining (-3.0%/yr); year-one equity from $2k of loan paydown is wiped out by about $7k of value loss. Plan a longer hold.
- Bay County population projected at +24% by 2050 — long-run rental-demand tailwind backs the buy-and-hold thesis.
Negotiation context
- Only 13 days on market — expect competitive offers; lowballing is unlikely to land.
- 4 sale attempts since 27y ago with the ask held roughly flat each time — persistent listings suggest the price (not the market) is what's stuck; bring a comps-based counter.
- Current owner paid $86k; list at $225k implies a 163% gain — meaningful room to come down on a strong offer.
Risks & watch-outs
- Climate carrying-cost: severe wind risk, 99% chance of damaging wind over 30y; extreme-heat days projected 7→21/yr by 2055 (HVAC capex compounding) — expect insurance premiums to compound above CPI over the hold.
Questions for the listing agent
- Is there a deadline driving the sale (1031 exchange, divorce, estate, relocation)? That informs how much negotiation room exists.
- Schools are B-rated — typically a magnet for longer-tenancy family renters. What's the average tenant stay here, and is there a school-zone premium baked into asking?
- What's the average days-on-market for RENTAL listings here right now (not sales)? A rising rental-DOM trend means longer vacancies and softer asking-rent achievability than the comps imply.
- What's the recent tenant-quality profile in this submarket — average credit score on applications, eviction rate, late-payment / NSF rate, and stable-employment percentage? A property-management company in the area should have these aggregated.
- How much new for-sale + rental construction is in the pipeline within 1–3 miles? Heavy new supply typically softens prices + rents 12–24 months out; constrained supply supports both.
Investment metrics
- 1% rule
- 1.11% ✓
- Cap rate
- 8.75%
- Cash-on-cash
- 8.77%
- DSCR
- 1.39
- GRM
- 7.5
CMA / ARV
- ARV (median comp)
- $351,741
- List price
- $225,000
- Delta
- -36.03%
- Verdict
- UNDERPRICED
- Comps
- 20 within 1.0 mi
Show comp detail 12 sales within ~0.75 mi
| Address | Dist | Beds/Ba | Sqft | Sold | Price | $/sf | Match |
|---|---|---|---|---|---|---|---|
| 206 White Sandy Dr | 0.07mi | 2/1.5 | 972 (-10%) | 4mo | $310,000 | $319 | 75 |
| 10625 Front Beach Rd Unit 601 | 0.24mi | 2/2.0 | 1,174 (+9%) | 1mo | $450,000 | $383 | 73 |
| 195 White Sandy Dr | 0.11mi | 2/2.5 | 972 (-10%) | 10mo | $340,000 | $350 | 68 |
| 10625 Front Beach Rd #404 | 0.24mi | 2/2.0 | 1,146 (+6%) | 12mo | $470,000 | $410 | 68 |
| 164 Robin Ln | 0.36mi | 2/2.5 | 1,044 (-3%) | 12mo | $335,000 | $321 | 65 |
| 122 Linda Marie Ln | 0.20mi | 2/2.5 | 1,188 (+10%) | 11mo | $297,500 | $250 | 63 |
| 122 Abbie Ln | 0.31mi | 2/2.5 | 972 (-10%) | 6mo | $340,000 | $350 | 62 |
| 9900 S Thomas Dr Unit 1004 | 0.50mi | 2/3.0 | 1,148 (+6%) | 2mo | $335,000 | $292 | 60 |
| 9860 S Thomas Dr #1213 | 0.49mi | 1/2.0 (-1) | 1,047 (-3%) | 9mo | $270,000 | $258 | 60 |
| 9860 S Thomas Dr #1519 | 0.47mi | 1/2.0 (-1) | 1,047 (-3%) | 11mo | $300,000 | $287 | 59 |
| 9860 S Thomas Dr #1604 | 0.50mi | 1/2.0 (-1) | 1,047 (-3%) | 12mo | $282,000 | $269 | 56 |
| 137 Cindy Ln | 0.36mi | 2/1.5 | 972 (-10%) | 10mo | $249,000 | $256 | 56 |
Match score weights: distance 35% · size 25% · config 20% · recency 20%. Top-matched comps best support the ARV.
Projected returns pro-forma
-3.0% appreciation · 0.0% rent growth · sell at horizon
- IRR
- -6.4%
- Equity multiple
- 0.77×
- Total profit
- $-14,417
- Equity at exit
- $33,548
- IRR
- -0.8%
- Equity multiple
- 0.95×
- Total profit
- $-2,956
- Equity at exit
- $19,454
Cash invested: $63,000 (down + closing). Projections, not guarantees.
Landlord ↔ Tenant lean methodology
- Overall (STATE)
- 87 Strongly Landlord-Friendly
- State Florida
- 87 Strongly Landlord-Friendly · R+3
- County
- — inherits STATE
- City
- — inherits STATE
ZIP-level market 32407
- Home prices YoY
- -29.5%
- Rents YoY
- -0.2%
- Active inventory
- 702
- Price-to-rent
- 7.5×
Monthly cashflow live
- Estimated rent
- $2,490 high interval (Pro) →
- Mortgage (P&I)
- −$1,180
- Tax from tax record
- −$233 /mo · $2,797/yr
- Insurance
- −$94
- HOA
- −$0
- Vacancy / Maint / Mgmt
- −$523
- Net cashflow
- $461
Break-even live
Sensitivity live
| Price | -10% $588 | -5% $524 | +0% $461 | +5% $397 | +10% $333 |
|---|---|---|---|---|---|
| Rent | -10% $264 | -5% $362 | +0% $461 | +5% $559 | +10% $657 |
| Rate | -1.0pp $574 | -0.5pp $518 | base $461 | +0.5pp $402 | +1.0pp $343 |
UW: 25.0% down · 7.5% · 30yr · 1.5% tax · 5.0% vac · 8.0% maint · 8.0% mgmt
Financing live
Cash to close
- Down payment
- $56,250
- Closing costs
- $6,750
- Reserves months
- —
- Total cash needed
- —
Loan-product check · same deal, 3 products live
Conventional
25% down · 7.5% · 30yr
- Down + closing
- —
- Monthly P&I
- —
- Monthly cashflow
- —
- DSCR
- —
- Eligible?
- —
Personal DTI + credit; lowest rate.
DSCR
20% down · 8.5% · 30yr
- Down + closing
- —
- Monthly P&I
- —
- Monthly cashflow
- —
- DSCR
- —
- Eligible?
- —
No personal income docs; deal must DSCR.
Hard money
10% down · 12.0% · 12mo
- Down + closing
- —
- Monthly P&I
- —
- Monthly cashflow
- —
- DSCR
- —
- Eligible?
- —
Short-term bridge; refi at stabilization.
Rent comps 23 comps
| Address | Beds | Baths | Sqft | Rent | $/sqft | DOM | Units | Dist |
|---|---|---|---|---|---|---|---|---|
| 10625 Front Beach Rd Unit 1354975P Panama City Beach, FL | 2.0 | 2.0 | 1140 | $3,166 | $2.78 | 13d | 1 | 0.22mi |
| 133 W Leslie Ln Unit 1 Panama City Beach, FL | 2.0 | 1.5 | 950 | $2,200 | $2.32 | 21d | 1 | 0.22mi |
| 10811 Front Beach Rd Unit 1354928P Panama City Beach, FL | 3.0 | 2.0 | 1194 | $3,463 | $2.90 | 13d | 1 | 0.24mi |
| 136 Bonnie Ln Panama City Beach, FL | 2.0 | 1.5 | 972 | $1,750 | $1.80 | 13d | 1 | 0.37mi |
| 138 Bonnie Ln Panama City Beach, FL | 2.0 | 1.5 | 972 | $1,599 | $1.65 | 13d | 1 | 0.37mi |
| 104 Gulfside Ct Unit 1523320P Panama City Beach, FL | 3.0 | 3.0 | 1496 | $5,020 | $3.36 | 13d | 1 | 0.41mi |
| 998 Gulfside Ct Unit 1523366P Panama City Beach, FL | 2.0 | 2.0 | 1065 | $4,124 | $3.87 | 13d | 1 | 0.42mi |
| 9815 S Thomas Dr Unit 1523339P Panama City, FL | 3.0 | 2.0 | 1259 | $4,018 | $3.19 | 21d | 1 | 0.45mi |
| 204 Potters Bluff Dr Panama City Beach, FL | 1.0–3.0 | 1.0–2.0 | 1035 | $1,651 | $1.60 | 13d | 12 | 0.47mi |
| 9902 S Thomas Dr Unit 1354966P Panama City Beach, FL | 2.0 | 2.0 | 1259 | $1,970 | $1.56 | 13d | 1 | 0.54mi |
| 98 Paddock Club Dr Panama City Beach, FL | 1.0–3.0 | 1.0–2.0 | 1093 | $1,751 | $1.60 | 13d | 19 | 0.56mi |
| 9850 S Thomas Dr Unit 1 Panama City Beach, FL | 1.0 | 1.0 | 700 | $2,750 | $3.93 | 21d | 1 | 0.63mi |
| 520 N Richard Jackson Blvd #1912 Panama City Beach, FL | 2.0 | 2.0 | 1200 | $2,375 | $1.98 | 13d | 1 | 0.67mi |
| 11222 Hutchison Blvd Unit 1523347P Panama City Beach, FL | 2.0 | 2.0 | 1194 | $3,907 | $3.27 | 21d | 1 | 0.72mi |
| 104 White Cap Way Panama City Beach, FL | 3.0 | 2.0 | 1146 | $2,700 | $2.36 | 21d | 1 | 0.76mi |
| 175 White Cap Way Unit 1 Panama City Beach, FL | 3.0 | 2.5 | 1432 | $1,750 | $1.22 | 13d | 1 | 0.81mi |
| 10400 Panama City Beach Pkwy Panama City Beach, FL | 1.0–3.0 | 1.0–2.0 | 1151 | $1,890 | $1.64 | 13d | 20 | 0.97mi |
| 11709 Seashore Ln Panama City Beach, FL | 3.0 | 2.0 | 1269 | $2,300 | $1.81 | 13d | 1 | 1.00mi |
| 800 Grand Panama Blvd Panama City Beach, FL | 3.0 | 1.0–2.0 | 978 | $2,299 | $2.35 | 13d | 30 | 1.05mi |
| 12011 Front Beach Rd Unit 1523327P Panama City Beach, FL | 2.0 | 2.0 | 1076 | $3,796 | $3.53 | 13d | 1 | 1.17mi |
| 302 Cabana Blvd Panama City Beach, FL | 1.0–3.0 | 1.0–2.0 | 1184 | $1,550 | $1.31 | 13d | 15 | 1.42mi |
| 2521 Allison Ave Panama City, FL | 2.0 | 2.0 | 980 | $1,450 | $1.48 | 21d | 1 | 1.47mi |
| 2301 Anne Ave Unit 8901 Laird Panama City, FL | 2.0 | 2.0 | 900 | $1,625 | $1.81 | 13d | 1 | 1.50mi |
Listing history 9 events
-
2026-05-08$225,000 Active 781-char remark
-
2021-12-14historical
-
2021-12-14historical
-
2010-07-08$149,900
-
2010-07-05$149,900
-
2000-03-03soldstatus $85,500
-
2000-02-29soldstatus $85,500
-
1999-10-13$89,900
-
1989-05-01soldstatus $55,900
ⓘ Source: listings_history table (triggers on properties + properties_extension) + one-shot
backfill from property_details.listing_events for pre-trigger history.
Tax reassessment forecast FL · Resets to sale price
- Current annual tax
- $2,797 · $233/mo
- Projected year-2 tax
- $2,797 · $233/mo
- Expected delta
- $0/yr ($0/mo · 0.0%)
ⓘ Screening estimate from a state-policy table — verify with the county assessor before closing.
Climate risk First Street
- Flood 4/10 Moderate FEMA zone X (unshaded) · 22% chance over 30 yrs
- Wildfire 4/10 Moderate
- Heat 10/10 Extreme 7 d/yr ≥106°F today · 21 d/yr by 30 yrs out
- Wind 9/10 Extreme 99% chance of damaging wind over 30 yrs
- Air quality 1/10 Low 0 unhealthy d/yr today · 0 by 30 yrs out
Nearby sold comps map
Loading sold comps map…
Walkable amenities ~0.75 mi
Loading nearby amenities…
Taxation est. · year 1
- Rental income
- $29,883
- − Mortgage interest
- −$12,603
- − Property taxes
- −$2,797
- − Insurance
- −$1,125
- − Repairs & maintenance
- −$2,391
- − Management
- −$2,391
- − Depreciation
- −$6,545
- Taxable income
- $2,031
- Est. tax owed @ 24.0%
- −$487
- After-tax cash flow
- $5,039/yr
For passive investors: Depreciation is non-cash, so a rental often shows a tax loss while cash-flowing — sheltering income. Rental losses are passive: they offset passive income freely, and up to $25,000/yr can offset ordinary (W-2) income if you actively participate and your MAGI is under $100k (phasing out to $0 by $150k); unused losses carry forward. On sale, claimed depreciation is recaptured at up to 25%, and gains may owe capital-gains tax (a 1031 exchange can defer both). Figures are a year-1 estimate at your 24.0% rate — not tax advice; consult a CPA.
Schools (NCES district)
- District
- Bay
- NCES district ID
- 1200090
- Math proficiency
- 51% ▼ -8.00%
- Reading proficiency
- 51% ▼ -7.00%
- Median HH income
- $47,740
- Composite
- 43.41/100
- National rank
- #3014
- State rank
- #29 of 73 in FL
Livability — Panama City Beach
- Score
- 78/100
- State rank
- #172
- US rank
- #2624
Category grades
Schools grade is shown separately in the Schools card above.
Census & demographics
- Census place
- Panama City Beach, FL
- County
- Bay County · 163,593 people
- City population
- 50,689
- Metro
- Panama City, FL
- Population (ZIP)
- 16,404
- Household income
- $80,831
- Rent vs Own
- Severe rent burden
- 939.0
Population outlook (Bay County) Hauer SSP2
- Today (2025)
- 206,264 people
- By 2030
- 217,740 · +5.6%
- By 2040
- 238,738 · +15.7%
- By 2050
- 255,545 · +23.9%
- By 2075
- 288,295 · +39.8%
- By 2100
- 288,638 · +39.9%
Race, ethnicity, and origin ACS 2023
- Neighborhood character
- Predominantly White (73%)
- Race & ethnicity
- White 73% Black 10% Two or more races 9% Hispanic / Latino 8% Asian 2%
- Hispanic origin (detail)
- Mexican 2% Puerto Rican 2%
- Common ancestry
- Lithuanian 4% Italian 3% Portuguese 2%
- Foreign-born
- 12% · Canada, Jamaica, South Korea
- Languages at home
- 89% English-only · Spanish 6% Other Indo-European 1% Russian/Polish/Slavic 1%
Political lean MEDSL · Bay
- 2024 margin
- Solid R (+47.4) · D 25.8% · R 73.1% · Other 1.1%
- 2008→2024 swing
- -6.6pp toward R · 2008: -40.7pp · 2024: -47.4pp
- All cycles
- 2024: R+47.4 2020: R+43.5 2016: R+46.3 2012: R+43.6 2008: R+40.7
Not yet ingested
- Civics
- —
Market trends
- HPI YoY
- ▼ -116.39%
- Current HPI
- 277.8875
- Rent YoY
- ▼ -0.25%
- Metro
- Panama City, FL
- State GDP YoY
- ▲ 3.28%
- F500 in state
- 36
Industry mix (Fortune 500 HQ in FL)
| Industry | F500 HQs | Revenue |
|---|---|---|
| Industrial Technology | 2 | $29B |
|
||
| Insurance | 2 | $17B |
|
||
| Retail | 1 | $60B |
|
||
| Technology Distribution | 1 | $58B |
|
||
| Homebuilding | 1 | $35B |
|
||
| Technology Manufacturing | 1 | $35B |
|
||
Price history
+302.5% since first listed10 events — show timeline
- 2026-05-20 Pending — CPARMLS
- 2026-05-08 Listed $225,000 CPARMLS
- 2021-12-14 Listing Removed — CPARMLS
- 2021-12-14 Listing Removed — CPARMLS
- 2010-07-08 Listed $149,900 CPARMLS
- 2010-07-05 Listed $149,900 CPARMLS
- 2000-03-03 Sold (Public Records) $85,500 Public Records
- 2000-02-29 Sold (MLS) $85,500 CPARMLS
- 1999-10-13 Listed $89,900 CPARMLS
- 1989-05-01 Sold (Public Records) $55,900 Public Records
Property tax history
+7.9%/yrLatest (2025): $2,797 · +6.1% YoY. Source: county tax records.
Cash-flow waterfall
monthlySold comps — $/sqft
last 12 mo · ≤1 miLoading sold comps…