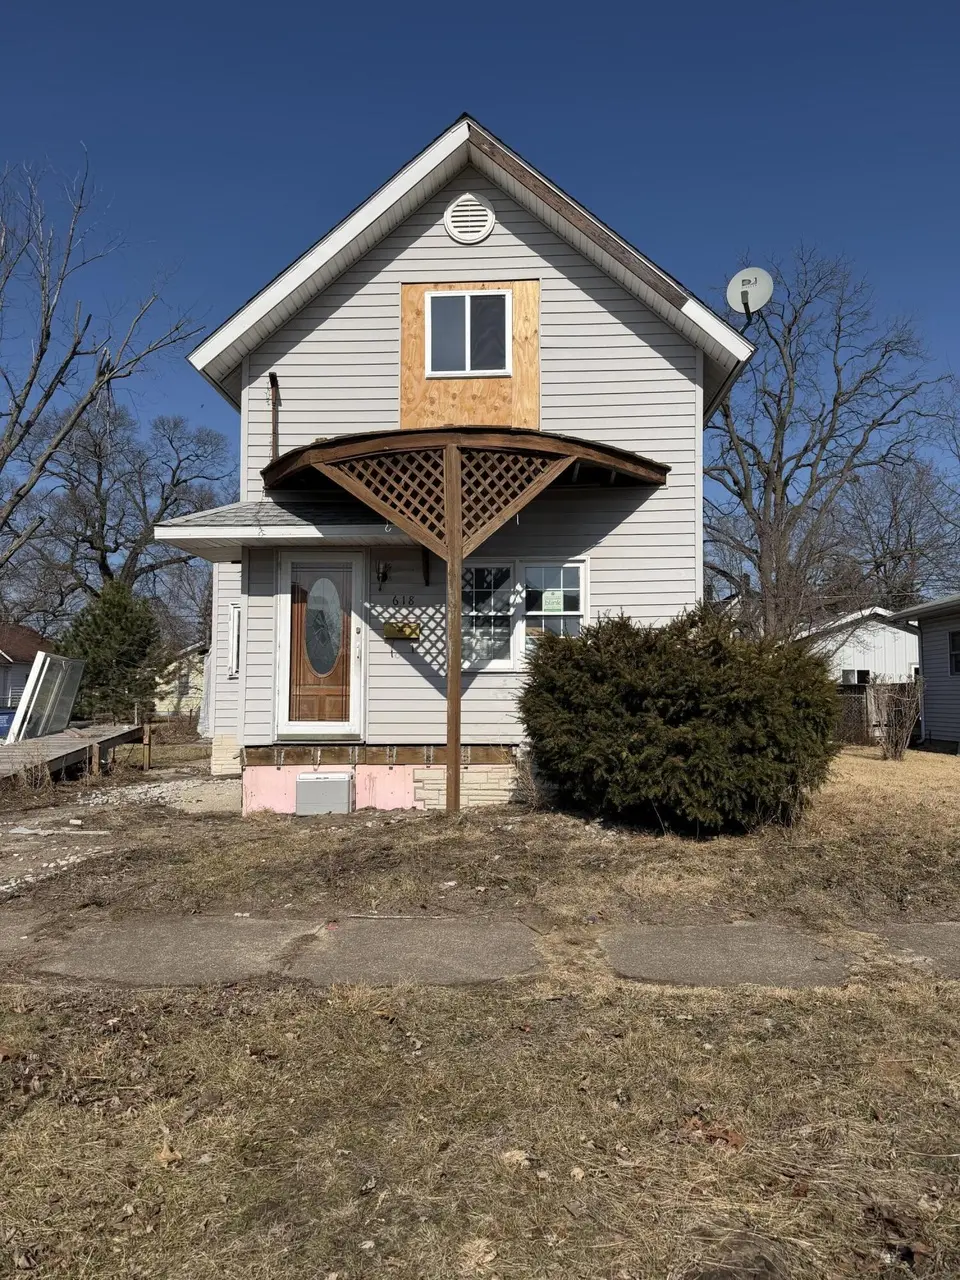
618 Dupage St · Michigan City, IN
Flood risk 1/10 · Minimal
- FEMA flood zone
- X (unshaded)
- Chance of flooding over 30 yrs
- 0.0%
- Est. flood insurance / yr
- $473 – $860
Fire risk 3/10 · Minor
- Est. fire insurance / yr
- $717 – $1,331
Heat risk 3/10 · Minor
- Hot days now (above 100°F)
- 7 days/yr
- Hot days in 30 yrs
- 14 days/yr
Wind risk 2/10 · Minimal
- Chance of severe wind over 30 yrs
- —
Air-quality risk 3/10 · Minor
- Unhealthy air days now
- 2 days/yr
- Unhealthy air days in 30 yrs
- 3 days/yr
Risk factors via First Street. Map © Google.
Why this score? — see what drove the B+ grade
The composite is a weighted blend of 9 inputs, each scored 0–100. Each bar is that input's sub-score; the figure is the points it added to the 100-point composite (weight × sub-score).
- Cash flow +30.0/30.0
- ARV discount +15.0/15.0
- 1% rule +10.0/10.0
- DSCR +10.0/10.0
- Rent growth +4.9/5.0
- Livability +4.0/5.0
- Condition / age +2.5/5.0
- Schools +2.2/10.0
- Appreciation +0.0/10.0
$83,500
🖨 Deal sheet 📄 Offer letter ✓ Due diligence
Listing remarks MLS
* * INVESTOR SPECIAL * * priced at 89,900! This 1 1/2 story home has been gutted, offering a clean slate with architectural blueprints already completed to create a more functional and modern floor plan. Skip the design phase and move straight to execution-major planning is done! Located in a convenient area just minutes from downtown, this property is ideal for investors or builders looking for their next renovation project. Sold As-Is.
Key facts
- Convenient area
- 5,500 sq ft lot
- Garage
Tags
Neighborhood map
What this means for you Summary
Snapshot
- This is a 3-bed/1.5-bath single-family listed at $84k.
Deal economics
- At list price, monthly cash flow is $385 ($5k/yr) — positive.
- The deal already cash-flows at list — no discount required.
- Meets the 1% rule at list price ($1k rent vs $84k).
- Recommended offer: $76k (9.0% below list) — sets the bar for market timing.
- Cap rate 11.8% vs local median 2.7% in Michigan City — top-decile yield for the area; either an underpriced asset or a hidden risk that comps aren't pricing in. Stress-test before assuming the spread holds.
Location & tenants
- Location reads 81/100 on livability (#15 in IN, #1,317 nationally) — a professional / high-income tenant draw. Strengths: commute A+, cost of living A+, housing A+; Watch: employment D, schools D-, amenities D-.
- Michigan City Area Schools (urban): math 23% / reading 28% proficiency, ranked #262 of 301 in IN (top 87%) — low school quality limits family demand, transient renter base, plan for 1-2y turnover; 68% free/reduced lunch — lower-income household profile, screen leases tightly.
- Market conditions: Rents rising fast (+9.7%/yr); 371 active listings in the ZIP; 7 comparable units currently listed for rent nearby; rentals lingering (median 44d on market — plan ~5-8 weeks vacancy on turnover, expect pricing pressure); 100% of comp listings sitting > 30 days — soft ceiling on asking rent; 216 units permitted in LaPorte County in 2024 (75 in 5+ unit buildings).
Forward outlook
- Local home prices are declining (-3.0%/yr); year-one equity from $577 of loan paydown is wiped out by about $3k of value loss. Plan a longer hold.
- LaPorte County population projected to shrink 7% by 2050 — rents likely to lag national; underwrite the cash flow, not the appreciation.
- At projected returns (-3.0% appreciation + 8.0% rent growth), your $23k cash investment doubles in ~5 years — after that, you're playing with house money.
Negotiation context
- It's been on market 120 days — a 9% lower offer ($76k) is reasonable based on typical stale-listing flexibility.
Risks & watch-outs
- Watch-outs: property tax is 2.9% of price; built in 1885 — expect roof / HVAC / electrical / plumbing capex.
Questions for the listing agent
- It's been on market 120 days. Have you received any prior offers? Is the seller open to a 9% concession, seller financing, or rate buy-down credit?
- Built in 1885 — when were the roof, HVAC, electrical panel, plumbing, and water heater last replaced?
- Property tax is high relative to price — has the assessment been appealed recently, and will the sale trigger a re-assessment?
- Why hasn't it sold? Are there any deal-killer items the seller is aware of (foundation, flood, title, zoning, code violations)?
- Is there a deadline driving the sale (1031 exchange, divorce, estate, relocation)? That informs how much negotiation room exists.
- Schools are D-rated, which usually means shorter tenancies and higher turnover. Who's the typical renter profile here, and what's been the actual vacancy rate?
- What's the average days-on-market for RENTAL listings here right now (not sales)? A rising rental-DOM trend means longer vacancies and softer asking-rent achievability than the comps imply.
- What's the recent tenant-quality profile in this submarket — average credit score on applications, eviction rate, late-payment / NSF rate, and stable-employment percentage? A property-management company in the area should have these aggregated.
- How much new for-sale + rental construction is in the pipeline within 1–3 miles? Heavy new supply typically softens prices + rents 12–24 months out; constrained supply supports both.
Investment metrics
- 1% rule
- 1.61% ✓
- Cap rate
- 11.82%
- Cash-on-cash
- 19.74%
- DSCR
- 1.88
- GRM
- 5.2
CMA / ARV
- ARV (median comp)
- $148,681
- List price
- $83,500
- Delta
- -43.84%
- Verdict
- UNDERPRICED
- Comps
- 20 within 1.0 mi
Show comp detail 12 sales within ~0.75 mi
| Address | Dist | Beds/Ba | Sqft | Sold | Price | $/sf | Match |
|---|---|---|---|---|---|---|---|
| 506 Tremont St | 0.16mi | 3/1.5 | 1,248 (-1%) | 9mo | $183,000 | $147 | 83 |
| 601 E 10th St | 0.37mi | 3/1.5 | 1,262 (+0%) | 0mo | $134,000 | $106 | 83 |
| 707 E 11th St | 0.27mi | 3/1.0 | 1,260 (-0%) | 8mo | $125,000 | $99 | 78 |
| 624 Cleveland Ave | 0.21mi | 3/1.0 | 1,181 (-6%) | 1mo | $99,000 | $84 | 77 |
| 722 Madison St | 0.11mi | 3/1.5 | 1,400 (+11%) | 5mo | $225,000 | $161 | 73 |
| 405 Madison St | 0.22mi | 3/1.0 | 1,410 (+12%) | 2mo | $156,000 | $111 | 66 |
| 813 Main St | 0.15mi | 3/1.0 | 1,404 (+11%) | 8mo | $134,000 | $95 | 65 |
| 426 Hendricks St | 0.37mi | 3/1.0 | 1,336 (+6%) | 8mo | $150,000 | $112 | 64 |
| 523 Grace St | 0.64mi | 3/1.0 | 1,392 (+10%) | 2mo | $176,000 | $126 | 49 |
| 215 Green St | 0.73mi | 2/1.0 (-1) | 1,156 (-8%) | 1mo | $65,000 | $56 | 44 |
| 222 May Ave | 0.74mi | 3/1.0 | 1,138 (-10%) | 5mo | $164,400 | $144 | 43 |
| 701 S Dickson St | 0.62mi | 2/1.0 (-1) | 1,394 (+10%) | 6mo | $155,000 | $111 | 41 |
Match score weights: distance 35% · size 25% · config 20% · recency 20%. Top-matched comps best support the ARV.
Projected returns pro-forma
-3.0% appreciation · 8.0% rent growth · sell at horizon
- IRR
- 17.9%
- Equity multiple
- 1.78×
- Total profit
- $18,127
- Equity at exit
- $12,450
- IRR
- 30.0%
- Equity multiple
- 4.42×
- Total profit
- $79,905
- Equity at exit
- $7,220
Cash invested: $23,380 (down + closing). Projections, not guarantees.
Landlord ↔ Tenant lean methodology
- Overall (STATE)
- 90 Strongly Landlord-Friendly
- State Indiana
- 90 Strongly Landlord-Friendly · R+11
- County
- — inherits STATE
- City
- — inherits STATE
ZIP-level market 46360
- Rents YoY
- 9.7%
- Active inventory
- 371
- Price-to-rent
- 5.2×
Monthly cashflow live
- Estimated rent
- $1,341 high interval (Pro) →
- Mortgage (P&I)
- −$438
- Tax from tax record
- −$202 /mo · $2,428/yr
- Insurance
- −$35
- HOA
- −$0
- Vacancy / Maint / Mgmt
- −$282
- Net cashflow
- $385
Break-even live
UW: 25.0% down · 7.5% · 30yr · 1.5% tax · 5.0% vac · 8.0% maint · 8.0% mgmt
Financing live
Cash to close
- Down payment
- $20,875
- Closing costs
- $2,505
- Reserves months
- —
- Total cash needed
- —
Loan-product check · same deal, 3 products live
Conventional
25% down · 7.5% · 30yr
- Down + closing
- —
- Monthly P&I
- —
- Monthly cashflow
- —
- DSCR
- —
- Eligible?
- —
Personal DTI + credit; lowest rate.
DSCR
20% down · 8.5% · 30yr
- Down + closing
- —
- Monthly P&I
- —
- Monthly cashflow
- —
- DSCR
- —
- Eligible?
- —
No personal income docs; deal must DSCR.
Hard money
10% down · 12.0% · 12mo
- Down + closing
- —
- Monthly P&I
- —
- Monthly cashflow
- —
- DSCR
- —
- Eligible?
- —
Short-term bridge; refi at stabilization.
Rent comps 7 comps
| Address | Beds | Baths | Sqft | Rent | $/sqft | DOM | Units | Dist |
|---|---|---|---|---|---|---|---|---|
| 121 S Porter St Unit A Michigan City, IN | 2.0 | 2.0 | 1050 | $925 | $0.88 | 43d | 1 | 0.31mi |
| 416 E 9th St Unit 2 Michigan City, IN | 3.0 | 2.0 | 1400 | $1,325 | $0.95 | 43d | 1 | 0.50mi |
| 215 N Woodland Ave Michigan City, IN | 3.0 | 1.0 | 1112 | $1,395 | $1.25 | 43d | 1 | 0.65mi |
| 1810 E Barker Ave Michigan City, IN | 1.0–2.0 | 1.0 | 900 | $1,250 | $1.39 | 43d | 1 | 0.75mi |
| 1303 Buffalo St Unit 1 Michigan City, IN | 3.0 | 1.0 | 1700 | $1,700 | $1.00 | 43d | 1 | 0.82mi |
| 910 S Carroll Ave Michigan City, IN | 2.0–3.0 | 2.0 | 1187 | $1,600 | $1.35 | 43d | 3 | 1.21mi |
| 934 Henry St Michigan City, IN | 3.0 | 1.0 | 1100 | $1,250 | $1.14 | 43d | 1 | 1.48mi |
Listing history 21 events
-
2026-06-19days on market $83,500 Active 120 DOM
-
2026-06-18days on market $83,500 Active 119 DOM
-
2026-06-17days on market $83,500 Active 118 DOM
-
2026-06-16days on market $83,500 Active 117 DOM
-
2026-06-15days on market $83,500 Active 116 DOM
-
2026-06-14days on market $83,500 Active 114 DOM
-
2026-06-13days on market $83,500 Active 113 DOM
-
2026-06-10days on market $83,500 Active 111 DOM
-
2026-06-09days on market $83,500 Active 110 DOM
-
2026-06-09remarks 644-char remark
-
2026-06-09price $83,500 Active 109 DOM
-
2026-06-08days on market $89,900 Active 109 DOM
-
2026-06-07days on market $89,900 Active 108 DOM
-
2026-06-03days on market $89,900 Active 104 DOM
-
2026-06-02days on market $89,900 Active 103 DOM
-
2026-06-01days on market $89,900 Active 102 DOM
-
2026-05-31days on market $89,900 Active 101 DOM
-
2026-05-30days on market $89,900 Active 100 DOM
-
2026-05-19price $89,900 444-char remark
Show marketing remark (444 chars)
* * INVESTOR SPECIAL * * priced at 89,900! This 1 1/2 story home has been gutted, offering a clean slate with architectural blueprints already completed to create a more functional and modern floor plan. Skip the design phase and move straight to execution-major planning is done! Located in a convenient area just minutes from downtown, this property is ideal for investors or builders looking for their next renovation project. Sold As-Is.
-
2026-03-14price $94,900 444-char remark
Show marketing remark (444 chars)
* * INVESTOR SPECIAL * * priced at 89,900! This 1 1/2 story home has been gutted, offering a clean slate with architectural blueprints already completed to create a more functional and modern floor plan. Skip the design phase and move straight to execution-major planning is done! Located in a convenient area just minutes from downtown, this property is ideal for investors or builders looking for their next renovation project. Sold As-Is.
-
2026-02-19$99,900 Active 444-char remark
Show marketing remark (444 chars)
* * INVESTOR SPECIAL * * priced at 89,900! This 1 1/2 story home has been gutted, offering a clean slate with architectural blueprints already completed to create a more functional and modern floor plan. Skip the design phase and move straight to execution-major planning is done! Located in a convenient area just minutes from downtown, this property is ideal for investors or builders looking for their next renovation project. Sold As-Is.
ⓘ Source: listings_history table (triggers on properties + properties_extension) + one-shot
backfill from property_details.listing_events for pre-trigger history.
Tax reassessment forecast IN · Partial reset (capped growth)
- Current annual tax
- $2,428 · $202/mo
- Projected year-2 tax
- $2,428 · $202/mo
- Expected delta
- $0/yr ($0/mo · 0.0%)
ⓘ Screening estimate from a state-policy table — verify with the county assessor before closing.
Climate risk First Street
- Flood 1/10 Low FEMA zone X (unshaded) · 0% chance over 30 yrs
- Wildfire 3/10 Moderate
- Heat 3/10 Moderate 7 d/yr ≥100°F today · 14 d/yr by 30 yrs out
- Wind 2/10 Low
- Air quality 3/10 Moderate 2 unhealthy d/yr today · 3 by 30 yrs out
Nearby sold comps map
Loading sold comps map…
Walkable amenities ~0.75 mi
Loading nearby amenities…
Taxation est. · year 1
- Rental income
- $16,094
- − Mortgage interest
- −$4,677
- − Property taxes
- −$2,428
- − Insurance
- −$418
- − Repairs & maintenance
- −$1,288
- − Management
- −$1,288
- − Depreciation
- −$2,429
- Taxable income
- $3,567
- Est. tax owed @ 24.0%
- −$856
- After-tax cash flow
- $3,758/yr
For passive investors: Depreciation is non-cash, so a rental often shows a tax loss while cash-flowing — sheltering income. Rental losses are passive: they offset passive income freely, and up to $25,000/yr can offset ordinary (W-2) income if you actively participate and your MAGI is under $100k (phasing out to $0 by $150k); unused losses carry forward. On sale, claimed depreciation is recaptured at up to 25%, and gains may owe capital-gains tax (a 1031 exchange can defer both). Figures are a year-1 estimate at your 24.0% rate — not tax advice; consult a CPA.
Schools (NCES district)
- District
- Michigan City Area Schools
- NCES district ID
- 1806570
- Math proficiency
- 23% ▼ -16.00%
- Reading proficiency
- 28% ▼ -10.00%
- Median HH income
- $42,629
- Composite
- 21.76/100
- National rank
- #8257
- State rank
- #262 of 301 in IN
Livability — Michigan City
- Score
- 81/100
- State rank
- #15
- US rank
- #1317
Category grades
Schools grade is shown separately in the Schools card above.
Census & demographics
- Census place
- Michigan City, IN
- County
- La Porte County · 88,580 people
- City population
- 43,817
- Metro
- Michigan City-La Porte, IN
- Population (ZIP)
- 43,817
- Household income
- $59,266
- Rent vs Own
- Severe rent burden
- 1152.0
Population outlook (LaPorte County) Hauer SSP2
- Today (2025)
- 109,757 people
- By 2030
- 108,288 · -1.3%
- By 2040
- 105,070 · -4.3%
- By 2050
- 102,330 · -6.8%
- By 2075
- 97,009 · -11.6%
- By 2100
- 86,459 · -21.2%
Race, ethnicity, and origin ACS 2023
- Neighborhood character
- Predominantly White (67%)
- Race & ethnicity
- White 67% Black 20% Hispanic / Latino 8% Two or more races 7%
- Hispanic origin (detail)
- Mexican 5%
- Common ancestry
- Romanian 11% Lithuanian 2% Iranian 1%
- Foreign-born
- 3% · Canada
- Languages at home
- 95% English-only · Spanish 3%
Political lean MEDSL · LaPorte
- 2024 margin
- R (+14.1) · D 42.1% · R 56.2% · Other 1.7%
- 2008→2024 swing
- -19.1pp toward R · 2008: 5.0pp · 2024: -14.1pp
- All cycles
- 2024: R+14.1 2020: R+7.2 2016: R+6.4 2012: D+12.6 2008: D+5.0
Not yet ingested
- Civics
- —
Market trends
- HPI YoY
- ▼ -210.27%
- Current HPI
- 206.0882
- Rent YoY
- ▲ 9.72%
- Metro
- Michigan City-La Porte, IN
- State GDP YoY
- ▲ 2.90%
- F500 in state
- 18
Industry mix (Fortune 500 HQ in IN)
| Industry | F500 HQs | Revenue |
|---|---|---|
| Industrial Machinery | 2 | $37B |
|
||
| Healthcare | 1 | $177B |
|
||
| Pharmaceuticals | 1 | $45B |
|
||
| Metals / Steel | 1 | $18B |
|
||
| Agriculture | 1 | $17B |
|
||
| Packaging | 1 | $12B |
|
||
Price history
-10.0% since first listed3 events — show timeline
- 2026-05-19 Price Changed $89,900 NIRA MLS as Distributed by MLS Grid
- 2026-03-14 Price Changed $94,900 NIRA MLS as Distributed by MLS Grid
- 2026-02-19 Listed $99,900 NIRA MLS as Distributed by MLS Grid
Property tax history
+5.1%/yrLatest (2024): $2,428 · +3.1% YoY. Source: county tax records.
Cash-flow waterfall
monthlySold comps — $/sqft
last 12 mo · ≤1 miLoading sold comps…