390 NW 134th Ave · Plantation, FL
Flood risk 1/10 · Minimal
- FEMA flood zone
- X (shaded)
- Chance of flooding over 30 yrs
- 0.0%
- Est. flood insurance / yr
- $507 – $1,088
Fire risk 1/10 · Minimal
- Est. fire insurance / yr
- $947 – $1,759
Heat risk 10/10 · Severe
- Hot days now (above 106°F)
- 7 days/yr
- Hot days in 30 yrs
- 26 days/yr
Wind risk 10/10 · Severe
- Chance of severe wind over 30 yrs
- 99.0%
Air-quality risk 3/10 · Minor
- Unhealthy air days now
- 2 days/yr
- Unhealthy air days in 30 yrs
- 3 days/yr
Risk factors via First Street. Map © Google.
Why this score? — see what drove the C grade
The composite is a weighted blend of 9 inputs, each scored 0–100. Each bar is that input's sub-score; the figure is the points it added to the 100-point composite (weight × sub-score).
- Cash flow +25.2/30.0
- DSCR +8.3/10.0
- 1% rule +5.9/10.0
- ARV discount +5.4/15.0
- Schools +4.1/10.0
- Livability +4.1/5.0
- Condition / age +2.5/5.0
- Rent growth +2.3/5.0
- Appreciation +0.0/10.0
$280,000
🖨 Deal sheet (PDF) 📄 Offer letter ✓ Due diligence
Listing remarks MLS
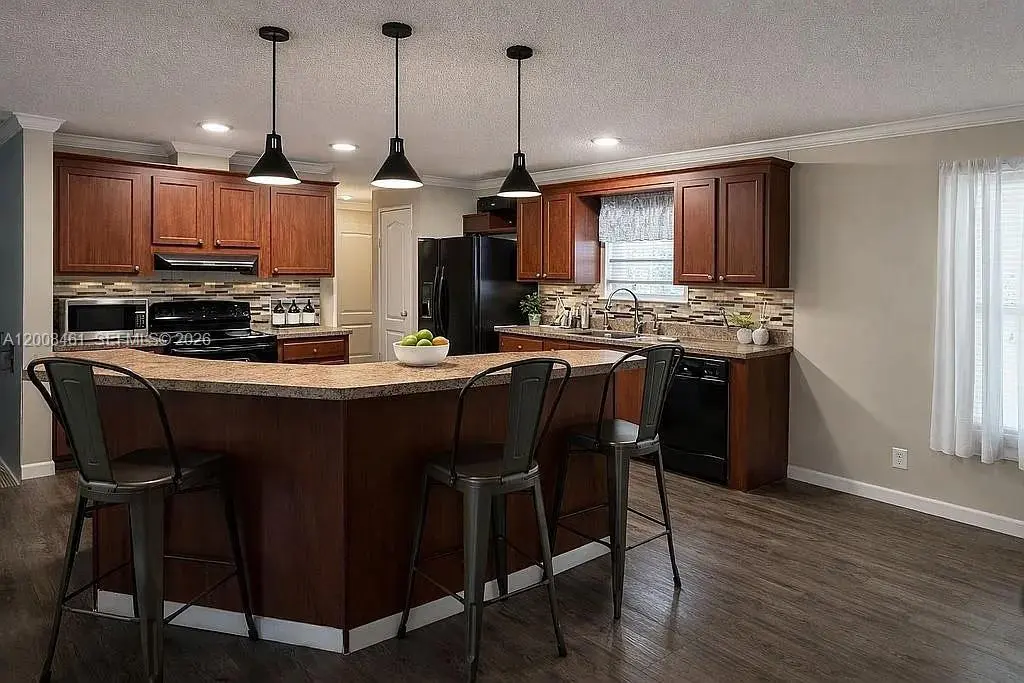
Beautiful manufactured home in a great community, sale includes property and land. Open and spacious floor plan, bright home featuring 3 bedrooms and 2 bathrooms. Metal terrace, private patio and canal front. Master bathroom features hot tub and shower, walk-in closet in each bedroom. Painted in elegant colors. Community pool, and low association fees. Great investment opportunity, generous CAP rate.
Key facts
- Waterfront home
- No lot rent
- Spacious kitchen
Tags
Property features AI
Finance
- HOA & community: Monthly association fee of $65; Community clubhouse and pool
Exterior
- Parking: Covered parking; 2-car garage
- Utilities: Public water; Public sewer
- Home design: Single-story manufactured home; East-facing
- Construction: Manufactured construction; Aluminum roof; Resale
- Exterior features: Awnings; Storage shed; Canal-front waterfront; Community pool; Clubhouse
Interior
- Kitchen: Dishwasher; Microwave
- Bedrooms: Bedroom on main level
- Flooring: Vinyl
- Bathrooms: 2 full bathrooms
- Heating & cooling: Central heating; Central air conditioning
- Interior features: First floor entry; Main-level bedroom; Laundry room; Storage room; Utility room
- Laundry & utility: Washer; Dryer
Neighborhood map
What this means for you Summary
Snapshot
- This is a 3-bed/2.0-bath manufactured listed at $280k.
Deal economics
- At list price, monthly cash flow is $629 ($8k/yr) — positive.
- The deal already cash-flows at list — no discount required.
- Meets the 1% rule at list price ($3k rent vs $280k).
- Cap rate 9.0% vs local median 3.4% in Plantation — top-decile yield for the area; either an underpriced asset or a hidden risk that comps aren't pricing in. Stress-test before assuming the spread holds.
Location & tenants
- Location reads 82/100 on livability (#70 in FL, #1,174 nationally) — a professional / high-income tenant draw. Strengths: commute A+, housing A+, health & safety A+; Watch: amenities C-, cost of living D-.
- Broward (suburban): math 42% / reading 53% proficiency, ranked #46 of 73 in FL (top 63%) — families likely to look elsewhere, expect single-tenant / working-renter base with shorter leases.
- Market conditions: Rents soft (-0.9%/yr); 177 active listings in the ZIP; 36 comparable units currently listed for rent nearby; rentals at typical pace (median 25d on market — plan ~3-4 weeks tenant-placement turnaround); solid renter incomes; 2,111 units permitted in Broward County in 2024 (1,265 in 5+ unit buildings).
- This rent runs 36% of the median local income ($101k/yr) — at the standard rent-burdened threshold; future hikes will face affordability resistance.
Forward outlook
- Local home prices are declining (-3.0%/yr); year-one equity from $2k of loan paydown is wiped out by about $8k of value loss. Plan a longer hold.
- Broward County population projected at +34% by 2050 — long-run rental-demand tailwind backs the buy-and-hold thesis.
Negotiation context
- Only 8 days on market — expect competitive offers; lowballing is unlikely to land.
- 2 sale attempts since 9y ago with the ask held roughly flat each time — persistent listings suggest the price (not the market) is what's stuck; bring a comps-based counter.
- Current owner paid $120k; list at $280k implies a 133% gain — meaningful room to come down on a strong offer.
Risks & watch-outs
- Climate carrying-cost: severe wind risk, 99% chance of damaging wind over 30y; extreme-heat days projected 7→26/yr by 2055 (HVAC capex compounding) — expect insurance premiums to compound above CPI over the hold.
Questions for the listing agent
- What does the HOA fee cover, when was the last increase, and are there any pending special assessments or reserve-fund shortfalls?
- Is there a deadline driving the sale (1031 exchange, divorce, estate, relocation)? That informs how much negotiation room exists.
- Schools are B-rated — typically a magnet for longer-tenancy family renters. What's the average tenant stay here, and is there a school-zone premium baked into asking?
- What's the average days-on-market for RENTAL listings here right now (not sales)? A rising rental-DOM trend means longer vacancies and softer asking-rent achievability than the comps imply.
- What's the recent tenant-quality profile in this submarket — average credit score on applications, eviction rate, late-payment / NSF rate, and stable-employment percentage? A property-management company in the area should have these aggregated.
- How much new for-sale + rental construction is in the pipeline within 1–3 miles? Heavy new supply typically softens prices + rents 12–24 months out; constrained supply supports both.
Investment metrics
- 1% rule
- 1.09% ✓
- Cap rate
- 8.99%
- Cash-on-cash
- 9.62%
- DSCR
- 1.43
- GRM
- 7.6
CMA / ARV
- ARV (on-the-fly)
- $267,786
- Comps found
- 1
Show comp detail 1 sale within ~0.75 mi
| Address | Dist | Beds/Ba | Sqft | Sold | Price | $/sf | Match |
|---|---|---|---|---|---|---|---|
| 390 NW 134th Ave | 0.00mi | 3/2.0 | 1,566 (0%) | 1mo | $268,000 | $171 | 99 |
Match score weights: distance 35% · size 25% · config 20% · recency 20%. Top-matched comps best support the ARV.
Projected returns pro-forma
-3.0% appreciation · 0.0% rent growth · sell at horizon
- IRR
- -5.1%
- Equity multiple
- 0.82×
- Total profit
- $-14,332
- Equity at exit
- $41,749
- IRR
- 0.9%
- Equity multiple
- 1.05×
- Total profit
- $4,295
- Equity at exit
- $24,209
Cash invested: $78,400 (down + closing). Projections, not guarantees.
Landlord ↔ Tenant lean methodology
- Overall (STATE)
- 87 Strongly Landlord-Friendly
- State Florida
- 87 Strongly Landlord-Friendly · R+3
- County
- — inherits STATE
- City
- — inherits STATE
ZIP-level market 33325
- Rents YoY
- -0.9%
- Active inventory
- 177
- Price-to-rent
- 7.6×
Monthly cashflow live
- Estimated rent
- $3,054 high interval (Pro) →
- Mortgage (P&I)
- −$1,468
- Tax from tax record
- −$134 /mo · $1,608/yr
- Insurance
- −$117
- HOA
- −$65
- Vacancy / Maint / Mgmt
- −$641
- Net cashflow
- $629
Break-even live
Sensitivity live
| Price | -10% $787 | -5% $708 | +0% $629 | +5% $549 | +10% $470 |
|---|---|---|---|---|---|
| Rent | -10% $387 | -5% $508 | +0% $629 | +5% $749 | +10% $870 |
| Rate | -1.0pp $770 | -0.5pp $700 | base $629 | +0.5pp $556 | +1.0pp $482 |
UW: 25.0% down · 7.5% · 30yr · 1.5% tax · 5.0% vac · 8.0% maint · 8.0% mgmt
Financing live
Cash to close
- Down payment
- $70,000
- Closing costs
- $8,400
- Reserves months
- —
- Total cash needed
- —
Loan-product check · same deal, 3 products live
Conventional
25% down · 7.5% · 30yr
- Down + closing
- —
- Monthly P&I
- —
- Monthly cashflow
- —
- DSCR
- —
- Eligible?
- —
Personal DTI + credit; lowest rate.
DSCR
20% down · 8.5% · 30yr
- Down + closing
- —
- Monthly P&I
- —
- Monthly cashflow
- —
- DSCR
- —
- Eligible?
- —
No personal income docs; deal must DSCR.
Hard money
10% down · 12.0% · 12mo
- Down + closing
- —
- Monthly P&I
- —
- Monthly cashflow
- —
- DSCR
- —
- Eligible?
- —
Short-term bridge; refi at stabilization.
Rent comps 36 comps
| Address | Beds | Baths | Sqft | Rent | $/sqft | DOM | Units | Dist |
|---|---|---|---|---|---|---|---|---|
| 13500 NW 3rd St Plantation, FL | 1.0–3.0 | 1.0–2.5 | 1099 | $3,725 | $3.39 | 3d | 21 | 0.12mi |
| 400 Commodore Dr #308 Plantation, FL | 2.0 | 2.5 | 1296 | $2,400 | $1.85 | 6d | 1 | 0.14mi |
| 430 Commodore Dr #210 Plantation, FL | 2.0 | 2.0 | 1130 | $2,100 | $1.86 | 25d | 1 | 0.14mi |
| 430 Commodore Dr Unit 430 Plantation, FL | 2.0 | 2.5 | 1296 | $2,400 | $1.85 | 5d | 1 | 0.14mi |
| 200 Commodore Dr Plantation, FL | 2.0 | 2.0 | 1078 | $2,743 | $2.54 | 23d | 1 | 0.24mi |
| 200 Commodore Dr Plantation, FL | 3.0 | 2.0 | 1124 | $2,913 | $2.59 | 20d | 1 | 0.24mi |
| 200 Commodore Dr Plantation, FL | 3.0 | 2.0 | 1124 | $3,014 | $2.68 | 25d | 1 | 0.24mi |
| 617 NW 132nd Ter Unit 617 Plantation, FL | 3.0 | 2.5 | 1577 | $2,750 | $1.74 | 25d | 1 | 0.27mi |
| 113 Riverwalk Cir W #141 Plantation, FL | 3.0 | 2.5 | 1892 | $3,600 | $1.90 | 25d | 1 | 0.48mi |
| 118 Riverwalk Cir Sunrise, FL | 3.0 | 2.5 | 1447 | $3,100 | $2.14 | 25d | 1 | 0.51mi |
| 13017 Riverwalk Cir S Plantation, FL | 3.0 | 2.5 | 1892 | $3,990 | $2.11 | 25d | 1 | 0.54mi |
| 141 SW 127th Ter Unit 141 Plantation, FL | 3.0 | 2.5 | 1720 | $3,600 | $2.09 | 25d | 1 | 0.63mi |
| 12950 Vista Isles Dr #421 Plantation, FL | 2.0 | 2.0 | 1105 | $2,300 | $2.08 | 25d | 1 | 0.65mi |
| 12471 NW 3rd St Unit D1 Plantation, FL | 3.0 | 2.0 | 1681 | $3,500 | $2.08 | 25d | 1 | 0.77mi |
| 12447 Emerald Creek Mnr Davie, FL | 3.0 | 2.5 | 1872 | $3,100 | $1.66 | 25d | 1 | 0.78mi |
| 13761 Newport Mnr Davie, FL | 3.0 | 2.0 | 1249 | $3,500 | $2.80 | 25d | 1 | 0.79mi |
| 14025 Langley Pl Davie, FL | 3.0 | 2.0 | 1360 | $3,250 | $2.39 | 13d | 1 | 0.83mi |
| 14025 Langley Pl Davie, FL | 3.0 | 2.0 | 1360 | $3,250 | $2.39 | 14d | 1 | 0.83mi |
| 663 Vista Isles Dr #1711 Plantation, FL | 2.0 | 2.0 | 1105 | $2,350 | $2.13 | 8d | 1 | 0.85mi |
| 12430 Vista Isles Dr #1318 Plantation, FL | 2.0 | 2.0 | 1065 | $2,200 | $2.07 | 25d | 1 | 0.86mi |
| 651 Shiloh Ter Unit 651 Davie, FL | 3.0 | 2.0 | 1249 | $4,700 | $3.76 | 25d | 1 | 0.88mi |
| 12773 NW 11th Ct Sunrise, FL | 3.0 | 2.0 | 1727 | $3,700 | $2.14 | 25d | 1 | 0.90mi |
| 12619 NW 11th Pl Sunrise, FL | 4.0 | 2.5 | 1847 | $3,800 | $2.06 | 25d | 1 | 1.06mi |
| 14721 Vista Verdi Rd Davie, FL | 3.0 | 2.0 | 1565 | $4,000 | $2.56 | 5d | 1 | 1.18mi |
| 1246 NW 125th Ter #1246 Sunrise, FL | 3.0 | 2.5 | 1628 | $3,795 | $2.33 | 25d | 1 | 1.25mi |
| 1246 NW 125th Ter #1246 Sunrise, FL | 3.0 | 2.5 | 1628 | $3,750 | $2.30 | 5d | 1 | 1.25mi |
| 12698 NW 14th Pl Sunrise, FL | 3.0 | 2.5 | 1401 | $3,100 | $2.21 | 25d | 1 | 1.28mi |
| 821 E Village Cir #821 Davie, FL | 3.0 | 2.5 | 1835 | $3,650 | $1.99 | 5d | 1 | 1.34mi |
| 821 E Village Cir #821 Davie, FL | 3.0 | 2.5 | 1835 | $3,750 | $2.04 | 21d | 1 | 1.34mi |
| 1640 NW 128th Dr Sunrise, FL | 1.0–3.0 | 1.0–2.0 | 961 | $3,226 | $3.36 | 3d | 24 | 1.42mi |
| 785 SW 148th Ave #1406 Davie, FL | 3.0 | 3.0 | 1285 | $2,550 | $1.98 | 25d | 1 | 1.45mi |
| 1501 NW 124th Ter Sunrise, FL | 1.0–3.0 | 1.0–2.0 | 1089 | $2,903 | $2.67 | 2d | 15 | 1.46mi |
| 781 SW 148th Ave Davie, FL | 1.0–3.0 | 1.0–3.0 | 1176 | $2,750 | $2.34 | 15d | 3 | 1.46mi |
| 781 SW 148th Ave Davie, FL | 3.0 | 3.0 | 1285 | $2,675 | $2.08 | 25d | 2 | 1.46mi |
| 771 SW 148th Ave #1305 Davie, FL | 2.0 | 1.0 | 1068 | $2,250 | $2.11 | 3d | 1 | 1.48mi |
| 735 SW 148th Ave Davie, FL | 3.0 | 3.0 | 1285 | $2,575 | $2.00 | 25d | 2 | 1.49mi |
HOA detail
- Monthly dues
- $65 · $780/yr
- Likely covers
- pool
Listing history 7 events
-
2026-05-05status Pending
-
2026-04-27$280,000 Active
-
2017-07-05soldstatus $120,000 Sold 403-char remark
Show marketing remark (403 chars)
Beautiful manufactured home in a great community, sale includes property and land. Open and spacious floor plan, bright home featuring 3 bedrooms and 2 bathrooms. Metal terrace, private patio and canal front. Master bathroom features hot tub and shower, walk-in closet in each bedroom. Painted in elegant colors. Community pool, and low association fees. Great investment opportunity, generous CAP rate.
-
2017-06-30soldstatus $120,000
-
2017-05-04status Pending 403-char remark
Show marketing remark (403 chars)
Beautiful manufactured home in a great community, sale includes property and land. Open and spacious floor plan, bright home featuring 3 bedrooms and 2 bathrooms. Metal terrace, private patio and canal front. Master bathroom features hot tub and shower, walk-in closet in each bedroom. Painted in elegant colors. Community pool, and low association fees. Great investment opportunity, generous CAP rate.
-
2017-04-17$129,000 Active 403-char remark
Show marketing remark (403 chars)
Beautiful manufactured home in a great community, sale includes property and land. Open and spacious floor plan, bright home featuring 3 bedrooms and 2 bathrooms. Metal terrace, private patio and canal front. Master bathroom features hot tub and shower, walk-in closet in each bedroom. Painted in elegant colors. Community pool, and low association fees. Great investment opportunity, generous CAP rate.
-
2017-03-22soldstatus $85,000
ⓘ Source: listings_history table (triggers on properties + properties_extension) + one-shot
backfill from property_details.listing_events for pre-trigger history.
Tax reassessment forecast FL · Resets to sale price
- Current annual tax
- $1,608 · $134/mo
- Projected year-2 tax
- $2,324 · $194/mo
- Expected delta
- +$716/yr (+$60/mo · 44.5%)
ⓘ Screening estimate from a state-policy table — verify with the county assessor before closing.
Climate risk First Street
- Flood 1/10 Low FEMA zone X (shaded) · 0% chance over 30 yrs
- Wildfire 1/10 Low
- Heat 10/10 Extreme 7 d/yr ≥106°F today · 26 d/yr by 30 yrs out
- Wind 10/10 Extreme 99% chance of damaging wind over 30 yrs
- Air quality 3/10 Moderate 2 unhealthy d/yr today · 3 by 30 yrs out
Nearby sold comps map
Loading sold comps map…
Walkable amenities ~0.75 mi
Loading nearby amenities…
Taxation est. · year 1
- Rental income
- $36,647
- − Mortgage interest
- −$15,684
- − Property taxes
- −$1,608
- − Insurance
- −$1,400
- − Repairs & maintenance
- −$2,932
- − Management
- −$2,932
- − HOA
- −$780
- − Depreciation
- −$8,145
- Taxable income
- $3,166
- Est. tax owed @ 24.0%
- −$760
- After-tax cash flow
- $6,783/yr
For passive investors: Depreciation is non-cash, so a rental often shows a tax loss while cash-flowing — sheltering income. Rental losses are passive: they offset passive income freely, and up to $25,000/yr can offset ordinary (W-2) income if you actively participate and your MAGI is under $100k (phasing out to $0 by $150k); unused losses carry forward. On sale, claimed depreciation is recaptured at up to 25%, and gains may owe capital-gains tax (a 1031 exchange can defer both). Figures are a year-1 estimate at your 24.0% rate — not tax advice; consult a CPA.
Schools (NCES district)
- District
- Broward
- NCES district ID
- 1200180
- Math proficiency
- 42% ▼ -18.00%
- Reading proficiency
- 53% ▼ -5.00%
- Median HH income
- $52,139
- Composite
- 40.88/100
- National rank
- #3621
- State rank
- #46 of 73 in FL
Livability — Plantation
- Score
- 82/100
- State rank
- #70
- US rank
- #1174
Category grades
Schools grade is shown separately in the Schools card above.
Census & demographics
- Census place
- Plantation, FL
- County
- Broward County · 1,963,430 people
- City population
- 111,690
- Metro
- Miami-Fort Lauderdale-Pompano Beach, FL
- Population (ZIP)
- 32,399
- Household income
- $100,553
- Rent vs Own
- Severe rent burden
- 924.0
Population outlook (Broward County) Hauer SSP2
- Today (2025)
- 2,207,033 people
- By 2030
- 2,360,704 · +7.0%
- By 2040
- 2,661,208 · +20.6%
- By 2050
- 2,946,698 · +33.5%
- By 2075
- 3,602,273 · +63.2%
- By 2100
- 3,970,984 · +79.9%
Race, ethnicity, and origin ACS 2023
- Neighborhood character
- Diverse neighborhood (Simpson 0.62)
- Race & ethnicity
- Hispanic / Latino 51% White 33% Two or more races 31% Black 6% Asian 3%
- Hispanic origin (detail)
- Mexican 3% Puerto Rican 8% Cuban 9% Dominican 1% Salvadoran 1%
- Common ancestry
- Italian 3% Romanian 1% Scotch-Irish 1%
- Foreign-born
- 35% · Canada, Jamaica, Dominican Republic
- Languages at home
- 49% English-only · Spanish 46% Other Indo-European 2% French/Haitian/Cajun 2%
Political lean MEDSL · Broward
- 2024 margin
- D (+17.0) · D 58.0% · R 41.0%
- 2008→2024 swing
- -17.8pp toward R · 2008: 34.7pp · 2024: 17.0pp
- All cycles
- 2024: D+17.0 2020: D+29.8 2016: D+35.0 2012: D+34.9 2008: D+34.7
Not yet ingested
- Civics
- —
Market trends
- HPI YoY
- ▼ -437.64%
- Current HPI
- 385.1467
- Rent YoY
- ▼ -0.88%
- Metro
- Miami-Fort Lauderdale-Pompano Beach, FL
- State GDP YoY
- ▲ 3.28%
- F500 in state
- 36
Industry mix (Fortune 500 HQ in FL)
| Industry | F500 HQs | Revenue |
|---|---|---|
| Industrial Technology | 2 | $29B |
|
||
| Insurance | 2 | $17B |
|
||
| Retail | 1 | $60B |
|
||
| Technology Distribution | 1 | $58B |
|
||
| Homebuilding | 1 | $35B |
|
||
| Technology Manufacturing | 1 | $35B |
|
||
Price history
+229.4% since first listed7 events — show timeline
- 2026-05-05 Pending — MARMLS
- 2026-04-27 Listed $280,000 MARMLS
- 2017-07-05 Sold (MLS) $120,000 MARMLS
- 2017-06-30 Sold (Public Records) $120,000 Public Records
- 2017-05-04 Pending — MARMLS
- 2017-04-17 Listed $129,000 MARMLS
- 2017-03-22 Sold (Public Records) $85,000 Public Records
Property tax history
+6.6%/yrLatest (2025): $1,608 · +3.0% YoY. Source: county tax records.
Cash-flow waterfall
monthlySold comps — $/sqft
last 12 mo · ≤1 miLoading sold comps…