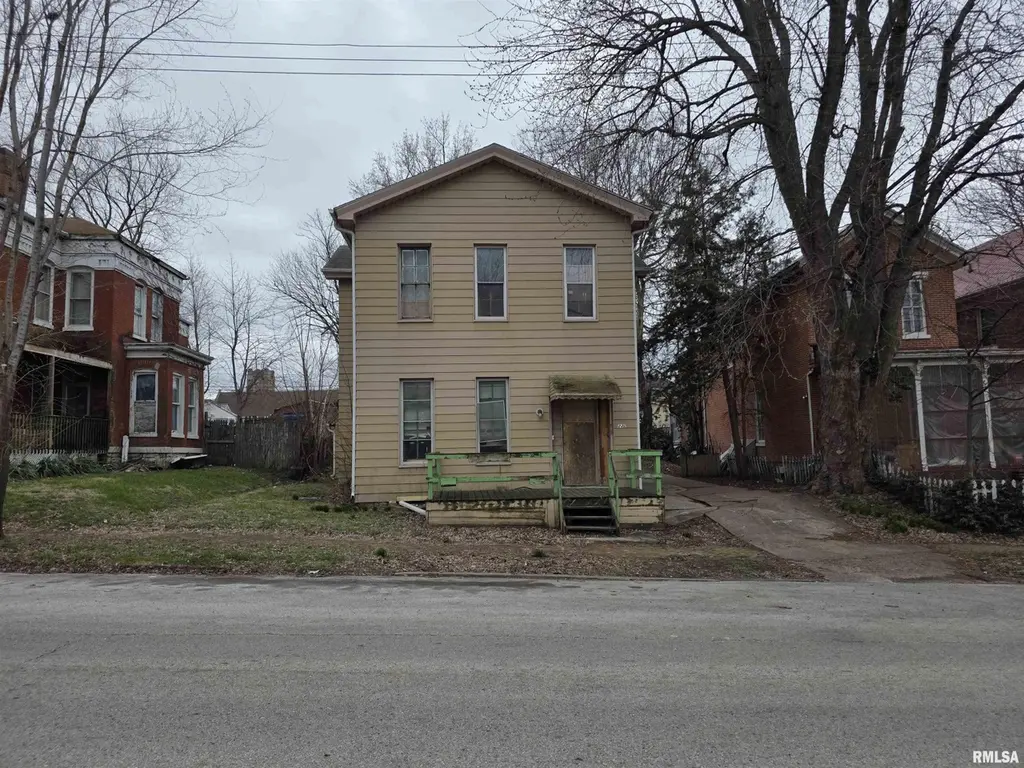
622 Spring St · Quincy, IL
Flood risk 1/10 · Minimal
- FEMA flood zone
- X (unshaded)
- Chance of flooding over 30 yrs
- 0.0%
- Est. flood insurance / yr
- $473 – $860
Fire risk 1/10 · Minimal
- Est. fire insurance / yr
- $804 – $1,492
Heat risk 4/10 · Minor
- Hot days now (above 106°F)
- 7 days/yr
- Hot days in 30 yrs
- 17 days/yr
Wind risk 2/10 · Minimal
- Chance of severe wind over 30 yrs
- —
Air-quality risk 2/10 · Minimal
- Unhealthy air days now
- 1 days/yr
- Unhealthy air days in 30 yrs
- 1 days/yr
Risk factors via First Street. Map © Google.
Why this score? — see what drove the D+ grade
The composite is a weighted blend of 9 inputs, each scored 0–100. Each bar is that input's sub-score; the figure is the points it added to the 100-point composite (weight × sub-score).
- Cash flow +15.0/30.0
- ARV discount +7.5/15.0
- 1% rule +5.0/10.0
- DSCR +5.0/10.0
- Rent growth +5.0/5.0
- Livability +3.4/5.0
- Condition / age +2.5/5.0
- Schools +2.2/10.0
- Appreciation +0.0/10.0
$15,000
🖨 Deal sheet (PDF) 📄 Offer letter ✓ Due diligence
Listing remarks MLS
Property sold strictly AS-IS. All contents are to convey with the property. This two-story home offers approximately 1,300+ sq ft of finished living space with a flexible layout that may support a two-apartment configuration, including potential for separate entrances and kitchens on each level(buyer to verify zoning and use). The home features two HVAC systems and two water heaters, both updated, supporting independent living areas. Electric has been updated. The basement is unfinished. Exterior includes fenced in backyard. NOTE: The additional land beyond the fence on the alley is not part of this parcel. Significant cleanout and improvements are needed. Property presents an opportunity for an investor, rehab buyer, or owner-occupant seeking value-add potential.
Key facts
- Fenced in backyard
- Two hvac systems
- Two story home
Tags
Neighborhood map
What this means for you Summary
Snapshot
- This is a 2-bed/2.0-bath single-family listed at $15k.
Deal economics
- At list price, monthly cash flow is $1k ($14k/yr) — positive.
- The deal already cash-flows at list — no discount required.
- Meets the 1% rule at list price ($2k rent vs $15k).
- Recommended offer: $14k (6.0% below list) — sets the bar for market timing.
- Cap rate 97.3% vs local median 4.3% in Quincy — top-decile yield for the area; either an underpriced asset or a hidden risk that comps aren't pricing in. Stress-test before assuming the spread holds.
Location & tenants
- Location reads 67/100 on livability (#506 in IL) — a middle-class / working-renter tenant base. Strengths: cost of living A+, housing A+; Watch: schools D+, crime D, employment D.
- Quincy SD 172 (town): math 24% / reading 27% proficiency, ranked #328 of 620 in IL (top 53%) — low school quality limits family demand, transient renter base, plan for 1-2y turnover.
- Market conditions: Rents rising fast (+10.8%/yr); 180 active listings in the ZIP; 3 comparable units currently listed for rent nearby; rentals lingering (median 45d on market — plan ~5-8 weeks vacancy on turnover, expect pricing pressure); 100% of comp listings sitting > 30 days — soft ceiling on asking rent; 68 units permitted in Adams County in 2024 (0 in 5+ unit buildings).
- This rent runs 37% of the median local income ($52k/yr) — at the standard rent-burdened threshold; future hikes will face affordability resistance.
Forward outlook
- Local home prices are declining (-3.0%/yr); year-one equity from $104 of loan paydown is wiped out by about $450 of value loss. Plan a longer hold.
- Adams County population projected at -14% by 2050 — secular population decline; favor cash flow + early exit over multi-decade hold.
- At projected returns (-3.0% appreciation + 8.0% rent growth), your $4k cash investment doubles in ~1 year — after that, you're playing with house money.
Negotiation context
- It's been on market 81 days — a 6% lower offer ($14k) is reasonable based on typical stale-listing flexibility.
- 3 sale attempts since 21y ago; this cycle's ask has dropped $5k (25%) from the opening price — seller is motivated, your offer sets the floor, not the list.
- Current owner paid $12k; 27% above their basis — modest negotiation headroom, anchor on the comps not their cost.
Risks & watch-outs
- Watch-outs: property tax is 2.9% of price.
Questions for the listing agent
- It's been on market 81 days. Have you received any prior offers? Is the seller open to a 6% concession, seller financing, or rate buy-down credit?
- Property tax is high relative to price — has the assessment been appealed recently, and will the sale trigger a re-assessment?
- Why hasn't it sold? Are there any deal-killer items the seller is aware of (foundation, flood, title, zoning, code violations)?
- Is there a deadline driving the sale (1031 exchange, divorce, estate, relocation)? That informs how much negotiation room exists.
- Schools are D-rated, which usually means shorter tenancies and higher turnover. Who's the typical renter profile here, and what's been the actual vacancy rate?
- Crime grade is D in this area — have there been break-ins, vandalism, or insurance claims at this property in the last 3 years? What carrier currently insures it and at what premium?
- The area grade is low — what's the realistic commute time and amenity access for the typical tenant pool here? Any planned neighborhood developments (good or bad) we should know about?
- What's the average days-on-market for RENTAL listings here right now (not sales)? A rising rental-DOM trend means longer vacancies and softer asking-rent achievability than the comps imply.
- What's the recent tenant-quality profile in this submarket — average credit score on applications, eviction rate, late-payment / NSF rate, and stable-employment percentage? A property-management company in the area should have these aggregated.
- How much new for-sale + rental construction is in the pipeline within 1–3 miles? Heavy new supply typically softens prices + rents 12–24 months out; constrained supply supports both.
Investment metrics
- 1% rule
- 10.62% ✓
- Cap rate
- 97.31%
- Cash-on-cash
- 325.06%
- DSCR
- 15.46
- GRM
- 0.8
CMA / ARV
- ARV (median comp)
- $81,470
- List price
- $15,000
- Delta
- -81.59%
- Verdict
- UNDERPRICED
- Comps
- 20 within 1.0 mi
Show comp detail 12 sales within ~0.75 mi
| Address | Dist | Beds/Ba | Sqft | Sold | Price | $/sf | Match |
|---|---|---|---|---|---|---|---|
| 525 Chestnut St | 0.46mi | 2/1.0 | 1,357 (-1%) | 9mo | $25,000 | $18 | 66 |
| 702 Spring St | 0.06mi | 3/1.5 (+1) | 1,245 (-9%) | 14mo | $12,000 | $10 | 64 |
| 530 Lind St | 0.35mi | 3/1.0 (+1) | 1,277 (-7%) | 3mo | $29,000 | $23 | 61 |
| 313 Lind St | 0.47mi | 2/1.0 | 1,420 (+4%) | 10mo | $49,500 | $35 | 59 |
| 1406 Hampshire St | 0.71mi | 2/1.0 | 1,413 (+3%) | 1mo | $135,000 | $96 | 56 |
| 623 N 8th | 0.18mi | 3/1.5 (+1) | 1,519 (+11%) | 14mo | $35,000 | $23 | 54 |
| 624 York St | 0.53mi | 3/1.0 (+1) | 1,363 (-0%) | 15mo | $61,666 | $45 | 53 |
| 1221 Elm St | 0.59mi | 3/1.0 (+1) | 1,470 (+8%) | 0mo | $58,000 | $39 | 51 |
| 1223 N 5 | 0.67mi | 3/2.0 (+1) | 1,376 (+1%) | 15mo | $135,500 | $98 | 50 |
| 1346 Chestnut St | 0.74mi | 2/1.0 | 1,247 (-9%) | 4mo | $98,000 | $79 | 43 |
| 622 York St | 0.53mi | 3/1.0 (+1) | 1,497 (+9%) | 15mo | $61,666 | $41 | 38 |
| 1415 Elm St | 0.72mi | 2/1.0 | 1,570 (+15%) | 16mo | $132,100 | $84 | 24 |
Match score weights: distance 35% · size 25% · config 20% · recency 20%. Top-matched comps best support the ARV.
Projected returns pro-forma
-3.0% appreciation · 8.0% rent growth · sell at horizon
- IRR
- —
- Equity multiple
- 19.69×
- Total profit
- $78,484
- Equity at exit
- $2,237
- IRR
- —
- Equity multiple
- 48.64×
- Total profit
- $200,106
- Equity at exit
- $1,297
Cash invested: $4,200 (down + closing). Projections, not guarantees.
Landlord ↔ Tenant lean methodology
- Overall (STATE)
- 43 Moderately Tenant-Leaning
- State Illinois
- 43 Moderately Tenant-Leaning · D+7
- County
- — inherits STATE
- City
- — inherits STATE
ZIP-level market 62301
- Rents YoY
- 10.8%
- Active inventory
- 180
- Price-to-rent
- 0.8×
Monthly cashflow live
- Estimated rent
- $1,593 medium interval (Pro) →
- Mortgage (P&I)
- −$79
- Tax from tax record
- −$36 /mo · $431/yr
- Insurance
- −$6
- HOA
- −$0
- Vacancy / Maint / Mgmt
- −$335
- Net cashflow
- $1,138
Break-even live
Sensitivity live
| Price | -10% $1,146 | -5% $1,142 | +0% $1,138 | +5% $1,133 | +10% $1,129 |
|---|---|---|---|---|---|
| Rent | -10% $1,012 | -5% $1,075 | +0% $1,138 | +5% $1,201 | +10% $1,264 |
| Rate | -1.0pp $1,145 | -0.5pp $1,142 | base $1,138 | +0.5pp $1,134 | +1.0pp $1,130 |
UW: 25.0% down · 7.5% · 30yr · 1.5% tax · 5.0% vac · 8.0% maint · 8.0% mgmt
Financing live
Cash to close
- Down payment
- $3,750
- Closing costs
- $450
- Reserves months
- —
- Total cash needed
- —
Loan-product check · same deal, 3 products live
Conventional
25% down · 7.5% · 30yr
- Down + closing
- —
- Monthly P&I
- —
- Monthly cashflow
- —
- DSCR
- —
- Eligible?
- —
Personal DTI + credit; lowest rate.
DSCR
20% down · 8.5% · 30yr
- Down + closing
- —
- Monthly P&I
- —
- Monthly cashflow
- —
- DSCR
- —
- Eligible?
- —
No personal income docs; deal must DSCR.
Hard money
10% down · 12.0% · 12mo
- Down + closing
- —
- Monthly P&I
- —
- Monthly cashflow
- —
- DSCR
- —
- Eligible?
- —
Short-term bridge; refi at stabilization.
Rent comps 3 comps
| Address | Beds | Baths | Sqft | Rent | $/sqft | DOM | Units | Dist |
|---|---|---|---|---|---|---|---|---|
| 500 Maine St Quincy, IL | 1.0 | 1.0 | 937 | $700 | $0.75 | 44d | 1 | 0.39mi |
| 116 N 3rd St Quincy, IL | 1.0–4.0 | 1.0–2.0 | 1950 | $3,067 | $1.57 | 44d | 12 | 0.42mi |
| 201 S 8th St Quincy, IL | 2.0 | 2.5 | 1785 | $1,800 | $1.01 | 44d | 1 | 0.46mi |
Listing history 28 events
-
2026-06-19days on market $15,000 Under Contract 81 DOM
-
2026-06-18days on market $15,000 Under Contract 80 DOM
-
2026-06-17days on market $15,000 Under Contract 79 DOM
-
2026-06-16days on market $15,000 Under Contract 78 DOM
-
2026-06-15days on market $15,000 Under Contract 77 DOM
-
2026-06-14days on market $15,000 Under Contract 75 DOM
-
2026-06-12statusdays on market $15,000 Under Contract 74 DOM
-
2026-06-09days on market $15,000 Active 71 DOM
-
2026-06-08days on market $15,000 Active 70 DOM
-
2026-06-07pricedays on market $15,000 Active 69 DOM
-
2026-06-03days on market $20,000 Active 65 DOM
-
2026-06-02days on market $20,000 Active 64 DOM
-
2026-06-01days on market $20,000 Active 63 DOM
-
2026-05-31days on market $20,000 Active 62 DOM
-
2026-05-30days on market $20,000 Active 61 DOM
-
2026-05-03status Active 784-char remark
Show marketing remark (784 chars)
Property sold strictly AS-IS. All contents are to convey with the property. This two-story home offers approximately 1,300+ sq ft of finished living space with a flexible layout that may support a two-apartment configuration, including potential for separate entrances and kitchens on each level(buyer to verify zoning and use). The home features two HVAC systems and two water heaters, both updated, supporting independent living areas. Electric has been updated. The basement is unfinished. Exterior includes fenced in backyard. NOTE: The additional land beyond the fence on the alley is not part of this parcel. Significant cleanout and improvements are needed. Property presents an opportunity for an investor, rehab buyer, or owner-occupant seeking value-add potential.
-
2026-04-04historical Under Contract 784-char remark
Show marketing remark (784 chars)
Property sold strictly AS-IS. All contents are to convey with the property. This two-story home offers approximately 1,300+ sq ft of finished living space with a flexible layout that may support a two-apartment configuration, including potential for separate entrances and kitchens on each level(buyer to verify zoning and use). The home features two HVAC systems and two water heaters, both updated, supporting independent living areas. Electric has been updated. The basement is unfinished. Exterior includes fenced in backyard. NOTE: The additional land beyond the fence on the alley is not part of this parcel. Significant cleanout and improvements are needed. Property presents an opportunity for an investor, rehab buyer, or owner-occupant seeking value-add potential.
-
2026-03-27$20,000 Active 784-char remark
Show marketing remark (784 chars)
Property sold strictly AS-IS. All contents are to convey with the property. This two-story home offers approximately 1,300+ sq ft of finished living space with a flexible layout that may support a two-apartment configuration, including potential for separate entrances and kitchens on each level(buyer to verify zoning and use). The home features two HVAC systems and two water heaters, both updated, supporting independent living areas. Electric has been updated. The basement is unfinished. Exterior includes fenced in backyard. NOTE: The additional land beyond the fence on the alley is not part of this parcel. Significant cleanout and improvements are needed. Property presents an opportunity for an investor, rehab buyer, or owner-occupant seeking value-add potential.
-
2022-09-27historical
-
2022-09-27historical
-
2022-09-27historical
-
2022-09-27historical
-
2012-01-19historical
-
2011-06-15historical
-
2005-09-19soldstatus $11,800
-
2005-07-21$18,000
-
2005-03-25historical
-
2004-10-10historical
ⓘ Source: listings_history table (triggers on properties + properties_extension) + one-shot
backfill from property_details.listing_events for pre-trigger history.
Tax reassessment forecast IL · Partial reset (capped growth)
- Current annual tax
- $431 · $36/mo
- Projected year-2 tax
- $431 · $36/mo
- Expected delta
- $0/yr ($0/mo · 0.0%)
ⓘ Screening estimate from a state-policy table — verify with the county assessor before closing.
Climate risk First Street
- Flood 1/10 Low FEMA zone X (unshaded) · 0% chance over 30 yrs
- Wildfire 1/10 Low
- Heat 4/10 Moderate 7 d/yr ≥106°F today · 17 d/yr by 30 yrs out
- Wind 2/10 Low
- Air quality 2/10 Low 1 unhealthy d/yr today · 1 by 30 yrs out
Nearby sold comps map
Loading sold comps map…
Walkable amenities ~0.75 mi
Loading nearby amenities…
Taxation est. · year 1
- Rental income
- $19,117
- − Mortgage interest
- −$840
- − Property taxes
- −$431
- − Insurance
- −$75
- − Repairs & maintenance
- −$1,529
- − Management
- −$1,529
- − Depreciation
- −$436
- Taxable income
- $14,276
- Est. tax owed @ 24.0%
- −$3,426
- After-tax cash flow
- $10,226/yr
For passive investors: Depreciation is non-cash, so a rental often shows a tax loss while cash-flowing — sheltering income. Rental losses are passive: they offset passive income freely, and up to $25,000/yr can offset ordinary (W-2) income if you actively participate and your MAGI is under $100k (phasing out to $0 by $150k); unused losses carry forward. On sale, claimed depreciation is recaptured at up to 25%, and gains may owe capital-gains tax (a 1031 exchange can defer both). Figures are a year-1 estimate at your 24.0% rate — not tax advice; consult a CPA.
Schools (NCES district)
- District
- Quincy SD 172
- NCES district ID
- 1733000
- Math proficiency
- 24% ▬ 0.00%
- Reading proficiency
- 27% ▬ 0.00%
- Median HH income
- $44,132
- Composite
- 21.91/100
- National rank
- #8229
- State rank
- #328 of 620 in IL
Livability — Quincy
- Score
- 67/100
- State rank
- #506
- US rank
- #10458
Category grades
Schools grade is shown separately in the Schools card above.
Census & demographics
- Census place
- Quincy, IL
- County
- Adams County · 30,746 people
- City population
- 30,746
- Metro
- Quincy, IL-MO
- Population (ZIP)
- 30,746
- Household income
- $52,055
- Rent vs Own
- Severe rent burden
- 1238.0
Population outlook (Adams County) Hauer SSP2
- Today (2025)
- 65,795 people
- By 2030
- 64,436 · -2.1%
- By 2040
- 61,007 · -7.3%
- By 2050
- 56,851 · -13.6%
- By 2075
- 46,424 · -29.4%
- By 2100
- 34,305 · -47.9%
Race, ethnicity, and origin ACS 2023
- Neighborhood character
- Predominantly White (84%)
- Race & ethnicity
- White 84% Two or more races 7% Black 6% Hispanic / Latino 3% Asian 1%
- Common ancestry
- Slovak 2% Iranian 1% Lithuanian 1%
- Foreign-born
- 2% · Canada
- Languages at home
- 96% English-only · Spanish 2%
Political lean MEDSL · Adams
- 2024 margin
- Solid R (+47.4) · D 25.6% · R 73.0% · Other 1.5%
- 2008→2024 swing
- -25.0pp toward R · 2008: -22.4pp · 2024: -47.4pp
- All cycles
- 2024: R+47.4 2020: R+46.5 2016: R+47.5 2012: R+35.2 2008: R+22.4
Not yet ingested
- Civics
- —
Market trends
- HPI YoY
- ▼ -121.44%
- Current HPI
- 131.7344
- Rent YoY
- ▲ 10.78%
- Metro
- Quincy, IL-MO
- State GDP YoY
- ▲ 1.59%
- F500 in state
- 60
Industry mix (Fortune 500 HQ in IL)
| Industry | F500 HQs | Revenue |
|---|---|---|
| Insurance | 4 | $201B |
|
||
| Consumer Goods | 4 | $87B |
|
||
| Industrial Machinery | 3 | $64B |
|
||
| Healthcare | 2 | $55B |
|
||
| Retail / Pharmacy | 1 | $148B |
|
||
| Agriculture / Food | 1 | $86B |
|
||
Price history
+11.1% since first listed13 events — show timeline
- 2026-05-03 Relisted — RMLSA as Distributed by MLS Grid
- 2026-04-04 Contingent — RMLSA as Distributed by MLS Grid
- 2026-03-27 Listed $20,000 RMLSA as Distributed by MLS Grid
- 2022-09-27 Listing Removed — RMLSA as Distributed by MLS Grid
- 2022-09-27 Listing Removed — RMLSA as Distributed by MLS Grid
- 2022-09-27 Listing Removed — RMLSA as Distributed by MLS Grid
- 2022-09-27 Listing Removed — RMLSA as Distributed by MLS Grid
- 2012-01-19 Listing Removed — MRED as Distributed by MLS Grid
- 2011-06-15 Listing Removed — MRED as Distributed by MLS Grid
- 2005-09-19 Sold (MLS) $11,800 RMLSA as Distributed by MLS Grid
- 2005-07-21 Listed $18,000 RMLSA as Distributed by MLS Grid
- 2005-03-25 Listing Removed — MRED as Distributed by MLS Grid
- 2004-10-10 Listing Removed — MRED as Distributed by MLS Grid
Property tax history
+2.7%/yrLatest (2023): $431 · +5.7% YoY. Source: county tax records.
Cash-flow waterfall
monthlySold comps — $/sqft
last 12 mo · ≤1 miLoading sold comps…