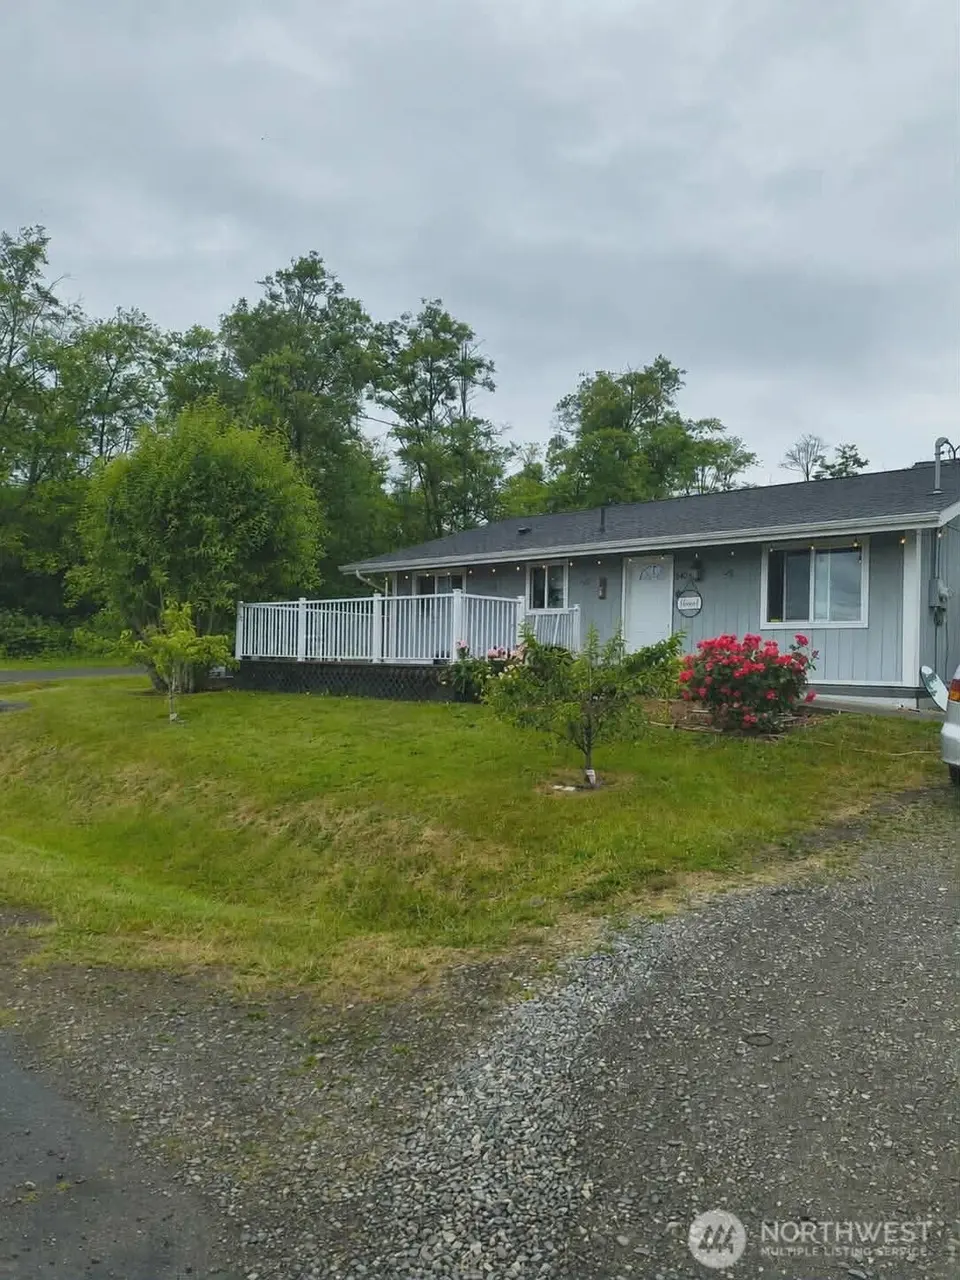
8404 Treevue · Birch Bay, WA
Flood risk 1/10 · Minimal
- FEMA flood zone
- X (unshaded)
- Chance of flooding over 30 yrs
- 0.0%
- Est. flood insurance / yr
- $507 – $1,088
Fire risk 1/10 · Minimal
- Est. fire insurance / yr
- $604 – $1,122
Heat risk 3/10 · Minor
- Hot days now (above 79°F)
- 7 days/yr
- Hot days in 30 yrs
- 20 days/yr
Wind risk 1/10 · Minimal
- Chance of severe wind over 30 yrs
- —
Air-quality risk 6/10 · Moderate
- Unhealthy air days now
- 9 days/yr
- Unhealthy air days in 30 yrs
- 10 days/yr
Risk factors via First Street. Map © Google.
Why this score? — see what drove the D+ grade
The composite is a weighted blend of 9 inputs, each scored 0–100. Each bar is that input's sub-score; the figure is the points it added to the 100-point composite (weight × sub-score).
- ARV discount +15.0/15.0
- Appreciation +10.0/10.0
- Cash flow +6.6/30.0
- Schools +4.7/10.0
- Rent growth +3.3/5.0
- Livability +3.1/5.0
- Condition / age +2.5/5.0
- 1% rule +1.0/10.0
- DSCR +0.9/10.0
$300,000
🖨 Deal sheet 📄 Offer letter ✓ Due diligence
Listing remarks
Great home avilable. Open floor plan. it is spacious and open with the bedrooms around the main living spaces making it feel large and comfortable. without wasted space for partition walls. One bath is off the primary bedroom. One level home with a good size lot and parking spaces. Very close to Birch Bay and stores. convenient for investor looking for positive cash flow properties. More photos coming soon.
Key facts
- Close to birch bay
- Open floor plan
- Parking spaces
Tags
Property features AI
Finance
- Other: Living area reported as 864 square feet; Lot size approximately 0.1628 acres; Buyer broker compensation 2.5%
- Financial info: Listing terms: Cash, Conventional, FHA
Exterior
- Parking: 2 covered spaces; 1 uncovered space; Detached carport; Driveway
- Utilities: Electric energy source; Public water; Sewer connected; Electric water heater; Power provided by PSE
- Home design: Single-family residence; One story; Built on lot; Faces south; Good condition
- Construction: Wood construction; Composition roof; Slab foundation; House structure; Built in one level
- Exterior features: Wood exterior and wood products; Deck; Patio; Outbuildings; Cable TV available; Corner lot; Partial slope topography; Has a view
Interior
- Kitchen: Dishwasher; Refrigerator; Stove/Range
- Bedrooms: 3 bedrooms (all on the main level)
- Flooring: Ceramic tile; Laminate; Vinyl; Carpet
- Bathrooms: 1 full bath and 1 three-quarter bath (both on the main level); 2 total showers
- Heating & cooling: Forced air heating; No central cooling
- Interior features: Water heater; No basement
- Laundry & utility: Washer; Dryer; Water heater located in the laundry room
Neighborhood map
What this means for you Summary
Snapshot
- This is a 1-bed/2.0-bath single-family listed at $300k.
Deal economics
- At list price, monthly cash flow is $-493 ($-6k/yr) — negative.
- To cash-flow at today's rent, offer at most $213k (29.0% below list).
- To meet the 1% rule (rent ≥ 1% of price), the offer needs to be $180k (40.0% below list).
- Recommended offer: $180k (40.0% below list) — sets the bar for 1% rule.
- Cap rate 4.3% vs local median 2.6% in Birch Bay — top-decile yield for the area; either an underpriced asset or a hidden risk that comps aren't pricing in. Stress-test before assuming the spread holds.
Location & tenants
- Location reads 62/100 on livability (#406 in WA) — a middle-class / working-renter tenant base. Strengths: housing A; Watch: cost of living D+, health & safety D, schools F.
- Blaine School District (town): math 49% / reading 55% proficiency, ranked #120 of 291 in WA (top 41%) — acceptable for families but not a draw, mixed tenant base, ~2y average lease.
- Market conditions: Rents rising (+3.1%/yr); 454 active listings in the ZIP; solid renter incomes; 1,190 units permitted in Whatcom County in 2024 (327 in 5+ unit buildings).
Forward outlook
- In year one you build about $32k of equity ($2k loan paydown + $30k appreciation (10.0% local appreciation)).
- Whatcom County population projected at +28% by 2050 — long-run rental-demand tailwind backs the buy-and-hold thesis.
- By year 2, paydown + projected appreciation supports a ~$52k cash-out refi (75% LTV) — recoverable capital for the next deal without selling this one.
Negotiation context
- Only 9 days on market — expect competitive offers; lowballing is unlikely to land.
- 3 sale attempts since 17y ago; this cycle's ask has dropped $90k (23%) from the opening price — seller is motivated, your offer sets the floor, not the list.
- Current owner paid $226k; 33% above their basis — modest negotiation headroom, anchor on the comps not their cost.
Questions for the listing agent
- What do current leases actually rent for vs. the listed asking? Can we see a recent rent roll and the last 12 months of T-12 income?
- Is there a deadline driving the sale (1031 exchange, divorce, estate, relocation)? That informs how much negotiation room exists.
- Schools are F-rated, which usually means shorter tenancies and higher turnover. Who's the typical renter profile here, and what's been the actual vacancy rate?
- The area grade is low — what's the realistic commute time and amenity access for the typical tenant pool here? Any planned neighborhood developments (good or bad) we should know about?
- What's the average days-on-market for RENTAL listings here right now (not sales)? A rising rental-DOM trend means longer vacancies and softer asking-rent achievability than the comps imply.
- What's the recent tenant-quality profile in this submarket — average credit score on applications, eviction rate, late-payment / NSF rate, and stable-employment percentage? A property-management company in the area should have these aggregated.
- How much new for-sale + rental construction is in the pipeline within 1–3 miles? Heavy new supply typically softens prices + rents 12–24 months out; constrained supply supports both.
Investment metrics
- 1% rule
- 0.60% ✗
- Cap rate
- 4.32%
- Cash-on-cash
- -7.04%
- DSCR
- 0.69
- GRM
- 13.9
CMA / ARV
- ARV (on-the-fly)
- $419,904
- Comps found
- 1
Show comp detail 1 sale within ~0.75 mi
| Address | Dist | Beds/Ba | Sqft | Sold | Price | $/sf | Match |
|---|---|---|---|---|---|---|---|
| 8215 Quinault Rd | 0.52mi | 2/1.0 (+1) | 800 (-7%) | 2mo | $389,000 | $486 | 52 |
Match score weights: distance 35% · size 25% · config 20% · recency 20%. Top-matched comps best support the ARV.
Projected returns pro-forma
10.0% appreciation · 3.1% rent growth · sell at horizon
- IRR
- 19.3%
- Equity multiple
- 2.57×
- Total profit
- $132,129
- Equity at exit
- $270,264
- IRR
- 17.8%
- Equity multiple
- 5.93×
- Total profit
- $413,996
- Equity at exit
- $582,834
Cash invested: $84,000 (down + closing). Projections, not guarantees.
Landlord ↔ Tenant lean methodology
- Overall (STATE)
- 28 Tenant-Leaning
- State Washington
- 28 Tenant-Leaning · D+8
- County
- — inherits STATE
- City
- — inherits STATE
ZIP-level market 98230
- Home prices YoY
- 14.0%
- Rents YoY
- 3.1%
- Active inventory
- 454
- Price-to-rent
- 13.9×
Monthly cashflow live
- Estimated rent
- $1,800 medium interval (Pro) →
- Mortgage (P&I)
- −$1,573
- Tax from tax record
- −$216 /mo · $2,596/yr
- Insurance
- −$125
- HOA
- −$0
- Vacancy / Maint / Mgmt
- −$378
- Net cashflow
- $-493
Break-even live
UW: 25.0% down · 7.5% · 30yr · 1.5% tax · 5.0% vac · 8.0% maint · 8.0% mgmt
Financing live
Cash to close
- Down payment
- $75,000
- Closing costs
- $9,000
- Reserves months
- —
- Total cash needed
- —
Loan-product check · same deal, 3 products live
Conventional
25% down · 7.5% · 30yr
- Down + closing
- —
- Monthly P&I
- —
- Monthly cashflow
- —
- DSCR
- —
- Eligible?
- —
Personal DTI + credit; lowest rate.
DSCR
20% down · 8.5% · 30yr
- Down + closing
- —
- Monthly P&I
- —
- Monthly cashflow
- —
- DSCR
- —
- Eligible?
- —
No personal income docs; deal must DSCR.
Hard money
10% down · 12.0% · 12mo
- Down + closing
- —
- Monthly P&I
- —
- Monthly cashflow
- —
- DSCR
- —
- Eligible?
- —
Short-term bridge; refi at stabilization.
Listing history 10 events
-
2026-06-19status $300,000 Pending 9 DOM
-
2026-06-18days on market $300,000 Active 9 DOM
-
2026-06-17days on market $300,000 Active 8 DOM
-
2026-06-16pricedays on market $300,000 Active 7 DOM
-
2026-06-15days on market $320,000 Active 6 DOM
-
2026-06-14days on market $320,000 Active 4 DOM
-
2026-06-13remarks 410-char remark
-
2026-06-13pricedays on market $320,000 Active 3 DOM
-
2026-06-10remarks 362-char remark
-
2026-06-10$390,000 Active 1 DOM
ⓘ Source: listings_history table (triggers on properties + properties_extension) + one-shot
backfill from property_details.listing_events for pre-trigger history.
Tax reassessment forecast WA · Resets to sale price
- Current annual tax
- $2,596 · $216/mo
- Projected year-2 tax
- $2,940 · $245/mo
- Expected delta
- +$344/yr (+$29/mo · 13.3%)
ⓘ Screening estimate from a state-policy table — verify with the county assessor before closing.
Climate risk First Street
- Flood 1/10 Low FEMA zone X (unshaded) · 0% chance over 30 yrs
- Wildfire 1/10 Low
- Heat 3/10 Moderate 7 d/yr ≥79°F today · 20 d/yr by 30 yrs out
- Wind 1/10 Low
- Air quality 6/10 Major 9 unhealthy d/yr today · 10 by 30 yrs out
Nearby sold comps map
Loading sold comps map…
Walkable amenities ~0.75 mi
Loading nearby amenities…
Taxation est. · year 1
- Rental income
- $21,600
- − Mortgage interest
- −$16,805
- − Property taxes
- −$2,596
- − Insurance
- −$1,500
- − Repairs & maintenance
- −$1,728
- − Management
- −$1,728
- − Depreciation
- −$8,727
- Taxable loss
- −$11,484
- Est. tax savings @ 24.0%
- +$2,756
- After-tax cash flow
- $-3,154/yr
For passive investors: Depreciation is non-cash, so a rental often shows a tax loss while cash-flowing — sheltering income. Rental losses are passive: they offset passive income freely, and up to $25,000/yr can offset ordinary (W-2) income if you actively participate and your MAGI is under $100k (phasing out to $0 by $150k); unused losses carry forward. On sale, claimed depreciation is recaptured at up to 25%, and gains may owe capital-gains tax (a 1031 exchange can defer both). Figures are a year-1 estimate at your 24.0% rate — not tax advice; consult a CPA.
Schools (NCES district)
- District
- Blaine School District
- NCES district ID
- 5300570
- Math proficiency
- 49% ▼ -1.00%
- Reading proficiency
- 55% ▼ -2.00%
- Median HH income
- $57,085
- Composite
- 47.05/100
- National rank
- #5128
- State rank
- #120 of 291 in WA
Livability — Birch Bay
- Score
- 62/100
- State rank
- #406
- US rank
- #16180
Category grades
Schools grade is shown separately in the Schools card above.
Census & demographics
- Census place
- Birch Bay, WA
- County
- Whatcom County · 209,776 people
- Metro
- Bellingham, WA
- Population (ZIP)
- 18,744
- Household income
- $86,623
- Rent vs Own
- Severe rent burden
- 454.0
Population outlook (Whatcom County) Hauer SSP2
- Today (2025)
- 240,408 people
- By 2030
- 254,667 · +5.9%
- By 2040
- 281,365 · +17.0%
- By 2050
- 307,592 · +27.9%
- By 2075
- 375,576 · +56.2%
- By 2100
- 421,637 · +75.4%
Race, ethnicity, and origin ACS 2023
- Neighborhood character
- Predominantly White (77%)
- Race & ethnicity
- White 77% Two or more races 11% Hispanic / Latino 9% Asian 3% Pacific Islander 2% Black 1%
- Hispanic origin (detail)
- Mexican 5%
- Common ancestry
- Portuguese 6% Iranian 4% Lithuanian 3%
- Foreign-born
- 13% · Canada, China
- Languages at home
- 89% English-only · Spanish 4% Russian/Polish/Slavic 1% Other Indo-European 1%
Political lean MEDSL · Whatcom
- 2024 margin
- Strong D (+24.9) · D 60.8% · R 35.9% · Other 3.3%
- 2008→2024 swing
- +6.9pp toward D · 2008: 18.0pp · 2024: 24.9pp
- All cycles
- 2024: D+24.9 2020: D+23.9 2016: D+17.7 2012: D+12.1 2008: D+18.0
Not yet ingested
- Civics
- —
Market trends
- HPI YoY
- ▲ 106.58%
- Current HPI
- 868.68
- Rent YoY
- ▲ 3.10%
- Metro
- Bellingham, WA
- State GDP YoY
- ▲ 4.65%
- F500 in state
- 22
Industry mix (Fortune 500 HQ in WA)
| Industry | F500 HQs | Revenue |
|---|---|---|
| Retail | 2 | $269B |
|
||
| Technology / Retail | 1 | $638B |
|
||
| Technology | 1 | $245B |
|
||
| Telecommunications | 1 | $38B |
|
||
| Food / Beverage | 1 | $36B |
|
||
| Automotive / Trucks | 1 | $34B |
|
||
Price history
+1100.0% since first listed13 events — show timeline
- 2026-06-09 Listed $390,000 NWMLS as Distributed by MLS Grid
- 2018-08-31 Sold (Public Records) $226,000 Public Records
- 2018-08-31 Sold (Public Records) $226,000 Public Records
- 2018-08-31 Sold (MLS) $226,000 NWMLS as Distributed by MLS Grid
- 2018-08-20 Pending — NWMLS as Distributed by MLS Grid
- 2018-08-02 Pending — NWMLS as Distributed by MLS Grid
- 2018-07-31 Listed $216,000 NWMLS as Distributed by MLS Grid
- 2010-03-19 Sold (MLS) $57,500 NWMLS as Distributed by MLS Grid
- 2010-01-21 Pending — NWMLS as Distributed by MLS Grid
- 2009-12-18 Pending — NWMLS as Distributed by MLS Grid
- 2009-12-07 Listed $65,000 NWMLS as Distributed by MLS Grid
- 2004-05-14 Sold (Public Records) $88,500 Public Records
- 1989-10-06 Sold (Public Records) $32,500 Public Records
Property tax history
+8.8%/yrLatest (2026): $2,596 · +2.1% YoY. Source: county tax records.
Cash-flow waterfall
monthlySold comps — $/sqft
last 12 mo · ≤1 miLoading sold comps…