410 E Main St · Lincoln, MO
Flood risk 1/10 · Minimal
- FEMA flood zone
- X (unshaded)
- Chance of flooding over 30 yrs
- 0.0%
- Est. flood insurance / yr
- $473 – $860
Fire risk 6/10 · Moderate
- Est. fire insurance / yr
- $1,054 – $1,958
Heat risk 4/10 · Minor
- Hot days now (above 107°F)
- 7 days/yr
- Hot days in 30 yrs
- 18 days/yr
Wind risk 2/10 · Minimal
- Chance of severe wind over 30 yrs
- 0.0%
Air-quality risk 1/10 · Minimal
- Unhealthy air days now
- 0 days/yr
- Unhealthy air days in 30 yrs
- 0 days/yr
Risk factors via First Street. Map © Google.
Why this score? — see what drove the C grade
The composite is a weighted blend of 9 inputs, each scored 0–100. Each bar is that input's sub-score; the figure is the points it added to the 100-point composite (weight × sub-score).
- Cash flow +18.8/30.0
- Appreciation +8.3/10.0
- ARV discount +7.5/15.0
- DSCR +5.9/10.0
- 1% rule +3.9/10.0
- Schools +3.8/10.0
- Livability +3.4/5.0
- Rent growth +2.5/5.0
- Condition / age +2.5/5.0
$139,900
🖨 Deal sheet 📄 Offer letter ✓ Due diligence
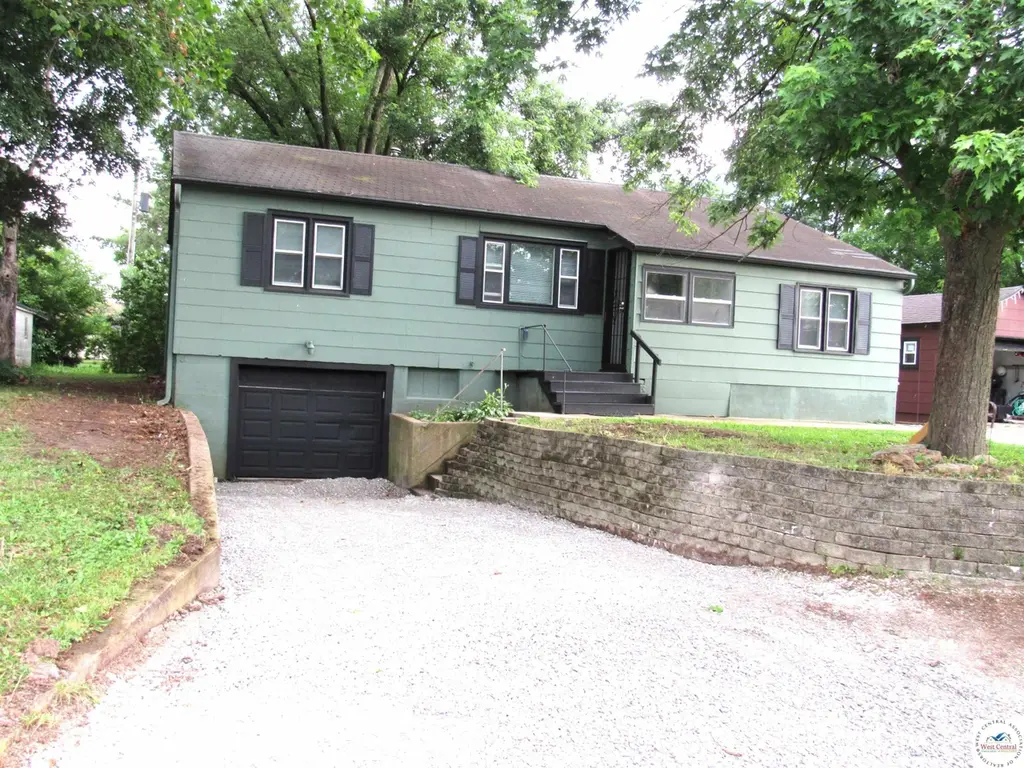
Listing remarks
4-bedroom, 1-bath move-in-ready home in Lincoln, close to 65 Hwy, great for commuting. Good starter home, investment property, or someone looking for a home at a great price. Fresh paint, hardwood floors in the living room and two of the bedrooms, and new carpet in the other two bedrooms, plus recent updates in the kitchen and bathroom. Big backyard. This home is close to everything, only 20 minutes to Clinton and Sedalia, and only 10 minutes to Warsaw. Access to the lakes is only minutes away.
Key facts
- Big backyard
- Move-in-ready
- New carpet
Tags
Property features AI
Finance
- HOA & community: Subdivision: Lincoln City
Exterior
- Parking: Attached garage (1 covered parking space, 1 total garage space)
- Home design: Single-family residence; Residential property; Located on E Main St, on the south side of the street
- Exterior features: Lot measures approximately 60 x 140 feet (about 0.19 acres)
Interior
- Bathrooms: One full bathroom
- Interior features: Basement
Neighborhood map
What this means for you Summary
Snapshot
- This is a 4-bed/1.0-bath other listed at $140k.
Deal economics
- At list price, monthly cash flow is $140 ($2k/yr) — positive.
- The deal already cash-flows at list — no discount required.
- To meet the 1% rule (rent ≥ 1% of price), the offer needs to be $124k (11.1% below list).
- Recommended offer: $124k (11.1% below list) — sets the bar for 1% rule.
Location & tenants
- Location reads 68/100 on livability (#168 in MO) — a middle-class / working-renter tenant base. Strengths: cost of living A+, housing A+, health & safety A+; Watch: schools D, amenities F, commute F.
- Lincoln R-II (rural): math 43% / reading 50% proficiency, ranked #91 of 324 in MO (top 28%) — families likely to look elsewhere, expect single-tenant / working-renter base with shorter leases.
- Market conditions: 61 active listings in the ZIP; 9 units permitted in Benton County in 2024 (0 in 5+ unit buildings).
Forward outlook
- In year one you build about $10k of equity ($967 loan paydown + $9k appreciation (6.5% local appreciation)).
- Benton County population projected at -21% by 2050 — secular population decline; favor cash flow + early exit over multi-decade hold.
- At projected returns (6.5% appreciation + 3.0% rent growth), your $39k cash investment doubles in ~4 years — after that, you're playing with house money.
- By year 4, paydown + projected appreciation supports a ~$34k cash-out refi (75% LTV) — recoverable capital for the next deal without selling this one.
Negotiation context
- Only 14 days on market — expect competitive offers; lowballing is unlikely to land.
- 2 sale attempts since 5y ago; this cycle's ask has dropped $108k (44%) from the opening price — seller is motivated, your offer sets the floor, not the list.
Risks & watch-outs
- Watch-outs: built in 1955 — expect roof / HVAC / electrical / plumbing capex.
- Climate carrying-cost: major wildfire risk — expect insurance premiums to compound above CPI over the hold.
Questions for the listing agent
- Built in 1955 — when were the roof, HVAC, electrical panel, plumbing, and water heater last replaced?
- Is there a deadline driving the sale (1031 exchange, divorce, estate, relocation)? That informs how much negotiation room exists.
- Schools are D-rated, which usually means shorter tenancies and higher turnover. Who's the typical renter profile here, and what's been the actual vacancy rate?
- What's the average days-on-market for RENTAL listings here right now (not sales)? A rising rental-DOM trend means longer vacancies and softer asking-rent achievability than the comps imply.
- What's the recent tenant-quality profile in this submarket — average credit score on applications, eviction rate, late-payment / NSF rate, and stable-employment percentage? A property-management company in the area should have these aggregated.
- How much new for-sale + rental construction is in the pipeline within 1–3 miles? Heavy new supply typically softens prices + rents 12–24 months out; constrained supply supports both.
Investment metrics
- 1% rule
- 0.89% ✗
- Cap rate
- 7.50%
- Cash-on-cash
- 4.29%
- DSCR
- 1.19
- GRM
- 9.4
CMA / ARV
No comps found within radius.
Projected returns pro-forma
6.5% appreciation · 3.0% rent growth · sell at horizon
- IRR
- 20.0%
- Equity multiple
- 2.36×
- Total profit
- $53,455
- Equity at exit
- $92,409
- IRR
- 19.1%
- Equity multiple
- 4.81×
- Total profit
- $149,148
- Equity at exit
- $171,571
Cash invested: $39,172 (down + closing). Projections, not guarantees.
Landlord ↔ Tenant lean methodology
- Overall (STATE)
- 81 Strongly Landlord-Friendly
- State Missouri
- 81 Strongly Landlord-Friendly · R+10
- County
- — inherits STATE
- City
- — inherits STATE
ZIP-level market 65338
- Home prices YoY
- 2.8%
- Active inventory
- 61
- Price-to-rent
- 9.4×
Monthly cashflow live
- Estimated rent
- $1,243 medium interval (Pro) →
- Mortgage (P&I)
- −$734
- Tax from tax record
- −$50 /mo · $599/yr
- Insurance
- −$58
- HOA
- −$0
- Vacancy / Maint / Mgmt
- −$261
- Net cashflow
- $140
Break-even live
UW: 25.0% down · 7.5% · 30yr · 1.5% tax · 5.0% vac · 8.0% maint · 8.0% mgmt
Financing live
Cash to close
- Down payment
- $34,975
- Closing costs
- $4,197
- Reserves months
- —
- Total cash needed
- —
Loan-product check · same deal, 3 products live
Conventional
25% down · 7.5% · 30yr
- Down + closing
- —
- Monthly P&I
- —
- Monthly cashflow
- —
- DSCR
- —
- Eligible?
- —
Personal DTI + credit; lowest rate.
DSCR
20% down · 8.5% · 30yr
- Down + closing
- —
- Monthly P&I
- —
- Monthly cashflow
- —
- DSCR
- —
- Eligible?
- —
No personal income docs; deal must DSCR.
Hard money
10% down · 12.0% · 12mo
- Down + closing
- —
- Monthly P&I
- —
- Monthly cashflow
- —
- DSCR
- —
- Eligible?
- —
Short-term bridge; refi at stabilization.
Listing history 12 events
-
2026-06-18days on market $139,900 Active 14 DOM
-
2026-06-17days on market $139,900 Active 13 DOM
-
2026-06-16days on market $139,900 Active 12 DOM
-
2026-06-15days on market $139,900 Active 11 DOM
-
2026-06-13days on market $139,900 Active 9 DOM
-
2026-06-12remarks 499-char remark
-
2026-06-12pricedays on market $139,900 Active 8 DOM
-
2026-06-09days on market $147,900 Active 5 DOM
-
2026-06-08days on market $147,900 Active 4 DOM
-
2026-06-07days on market $147,900 Active 3 DOM
-
2026-06-07remarks 451-char remark
-
2026-06-07$147,900 Active 2 DOM
ⓘ Source: listings_history table (triggers on properties + properties_extension) + one-shot
backfill from property_details.listing_events for pre-trigger history.
Tax reassessment forecast MO · Resets to sale price
- Current annual tax
- $599 · $50/mo
- Projected year-2 tax
- $1,357 · $113/mo
- Expected delta
- +$758/yr (+$63/mo · 126.5%)
ⓘ Screening estimate from a state-policy table — verify with the county assessor before closing.
Climate risk First Street
- Flood 1/10 Low FEMA zone X (unshaded) · 0% chance over 30 yrs
- Wildfire 6/10 Major
- Heat 4/10 Moderate 7 d/yr ≥107°F today · 18 d/yr by 30 yrs out
- Wind 2/10 Low 0% chance of damaging wind over 30 yrs
- Air quality 1/10 Low 0 unhealthy d/yr today · 0 by 30 yrs out
Nearby sold comps map
Loading sold comps map…
Walkable amenities ~0.75 mi
Loading nearby amenities…
Taxation est. · year 1
- Rental income
- $14,917
- − Mortgage interest
- −$7,837
- − Property taxes
- −$599
- − Insurance
- −$700
- − Repairs & maintenance
- −$1,193
- − Management
- −$1,193
- − Depreciation
- −$4,070
- Taxable loss
- −$675
- Est. tax savings @ 24.0%
- +$162
- After-tax cash flow
- $1,844/yr
For passive investors: Depreciation is non-cash, so a rental often shows a tax loss while cash-flowing — sheltering income. Rental losses are passive: they offset passive income freely, and up to $25,000/yr can offset ordinary (W-2) income if you actively participate and your MAGI is under $100k (phasing out to $0 by $150k); unused losses carry forward. On sale, claimed depreciation is recaptured at up to 25%, and gains may owe capital-gains tax (a 1031 exchange can defer both). Figures are a year-1 estimate at your 24.0% rate — not tax advice; consult a CPA.
Schools (NCES district)
- District
- Lincoln R-II
- NCES district ID
- 2918670
- Math proficiency
- 43% ▼ -4.00%
- Reading proficiency
- 50% ▲ 8.00%
- Median HH income
- $35,713
- Composite
- 38.49/100
- National rank
- #4182
- State rank
- #91 of 324 in MO
Livability — Lincoln
- Score
- 68/100
- State rank
- #168
- US rank
- #9077
Category grades
Schools grade is shown separately in the Schools card above.
Census & demographics
- Census place
- Lincoln, MO
- Population (ZIP)
- 3,403
Population outlook (Benton County) Hauer SSP2
- Today (2025)
- 17,355 people
- By 2030
- 16,513 · -4.9%
- By 2040
- 14,898 · -14.2%
- By 2050
- 13,662 · -21.3%
- By 2075
- 11,308 · -34.8%
- By 2100
- 8,755 · -49.6%
Race, ethnicity, and origin ACS 2023
- Neighborhood character
- Predominantly White (90%)
- Race & ethnicity
- White 90% Two or more races 3% Black 3% Hispanic / Latino 2%
- Common ancestry
- Serbian 3% Lithuanian 1% Italian 1%
- Foreign-born
- 1% · Canada, Jamaica
- Languages at home
- 96% English-only · German/W. Germanic 2% Spanish 1%
Political lean MEDSL · Benton
- 2024 margin
- Solid R (+59.1) · D 20.1% · R 79.2%
- 2008→2024 swing
- -36.8pp toward R · 2008: -22.3pp · 2024: -59.1pp
- All cycles
- 2024: R+59.1 2020: R+56.6 2016: R+54.1 2012: R+34.3 2008: R+22.3
Not yet ingested
- Civics
- —
Market trends
- HPI YoY
- ▲ 6.50%
- Current HPI
- 236.0122
- Rent YoY
- —
- Metro
- —
- State GDP YoY
- ▲ 1.84%
- F500 in state
- 20
Industry mix (Fortune 500 HQ in MO)
| Industry | F500 HQs | Revenue |
|---|---|---|
| Healthcare | 1 | $163B |
|
||
| Insurance | 1 | $21B |
|
||
| Industrial Technology | 1 | $17B |
|
||
| Retail | 1 | $16B |
|
||
| Industrial Distribution | 1 | $10B |
|
||
| Utilities | 1 | $9B |
|
||
Price history
+395.8% since first listed5 events — show timeline
- 2026-06-05 Listed $247,900 WCAR
- 2026-06-05 Price Changed $147,900 WCAR
- 2021-07-06 Sold (MLS) — WCAR
- 2021-06-08 Listed $50,000 WCAR
- 1970-10-01 Sold (Public Records) — Public Records
Property tax history
+2.4%/yrLatest (2025): $599 · +8.3% YoY. Source: county tax records.
Cash-flow waterfall
monthlySold comps — $/sqft
last 12 mo · ≤1 miLoading sold comps…