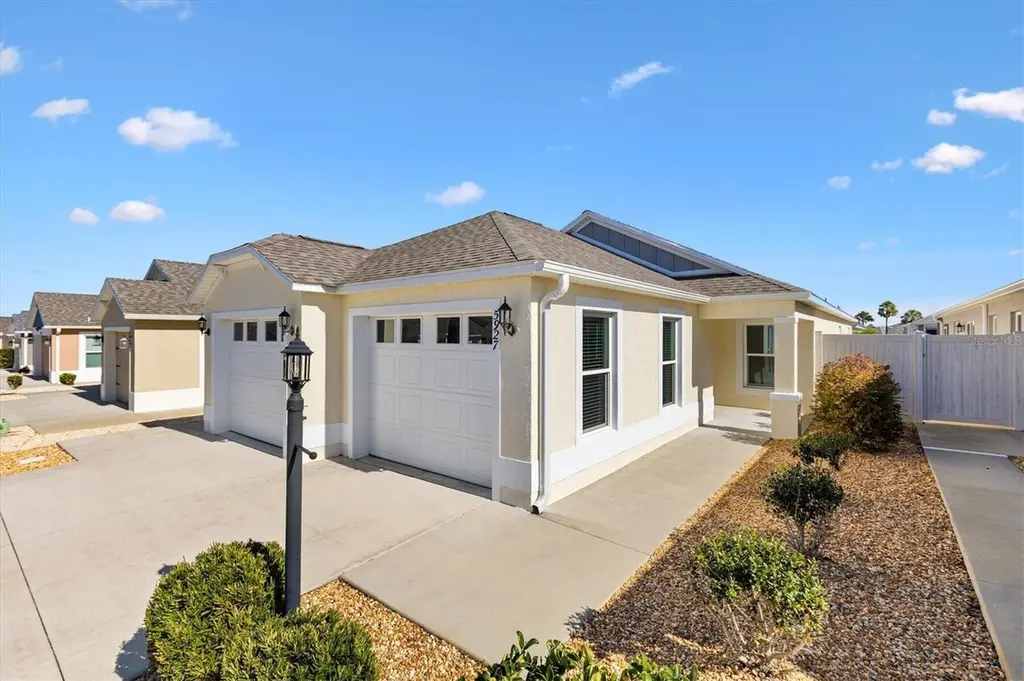
5927 Walters Ct · Wildwood, FL
Flood risk 1/10 · Minimal
- FEMA flood zone
- X (unshaded)
- Chance of flooding over 30 yrs
- 0.0%
- Est. flood insurance / yr
- $507 – $1,088
Fire risk 5/10 · Moderate
- Est. fire insurance / yr
- $947 – $1,759
Heat risk 8/10 · Major
- Hot days now (above 108°F)
- 7 days/yr
- Hot days in 30 yrs
- 22 days/yr
Wind risk 10/10 · Severe
- Chance of severe wind over 30 yrs
- 99.0%
Air-quality risk 2/10 · Minimal
- Unhealthy air days now
- 1 days/yr
- Unhealthy air days in 30 yrs
- 2 days/yr
Risk factors via First Street. Map © Google.
Why this score? — see what drove the D- grade
The composite is a weighted blend of 9 inputs, each scored 0–100. Each bar is that input's sub-score; the figure is the points it added to the 100-point composite (weight × sub-score).
- Appreciation +10.0/10.0
- ARV discount +7.7/15.0
- Cash flow +5.4/30.0
- Schools +5.2/10.0
- Livability +3.5/5.0
- Rent growth +2.5/5.0
- Condition / age +2.5/5.0
- 1% rule +1.9/10.0
- DSCR +0.0/10.0
$369,000
🖨 Deal sheet (PDF) 📄 Offer letter ✓ Due diligence
Listing remarks
Location truly matters—and this home delivers. Just steps from the vibrant energy of Sawgrass Grove, this like-new 3BR/2BA Charlotte model has exceptional convenience in the highly desirable Village of St. Catherine. This courtyard villa is set on a private, fully fenced lot with attractive, low-maintenance rock landscaping. Inside, the home impresses immediately with its spotless condition and careful upkeep. The kitchen stands out with its generous pantry, large island with seating, and an inviting layout for both casual meals and entertaining guests. Durable tile flooring extends through the main living areas, kitchen, bathrooms, and laundry room, enhancing the home’s clean,
Key facts
- 4,640 sq ft lot
- 2 garage spots
- Built 2021
Property features AI
Finance
- Other: Community Development District (CDD) present
- HOA & community: Homeowners association with a required monthly fee of $198; Association fee totals $2,376 annually; Association contact: [email protected]; Senior community; Pets allowed
Exterior
- Parking: Attached garage; 2-car garage
- Utilities: Public water; Public sewer; Cable connected; High-speed internet available; Electricity connected; Natural gas connected; Sewer connected; Water connected; Underground utilities; Sprinkler meter
- Home design: Single-family residence; One story; West-facing
- Construction: Block and stucco construction; Shingle roof; Slab foundation; Completed condition
- Exterior features: Irrigation system; Asphalt road access; 0.11 acre lot (approximately)
Interior
- Kitchen: Dishwasher; Disposal; Microwave; Range hood; Refrigerator; Tankless water heater
- Bedrooms: 3 bedrooms
- Flooring: Carpet; Tile
- Bathrooms: 2 full bathrooms
- Heating & cooling: Heat pump; Central air
- Interior features: Cathedral ceilings; Ceiling fans; Kitchen/family room combo; Living room/dining room combo; Thermostat; Tray ceilings; Walk-in closets; Window treatments; 10 total rooms
- Laundry & utility: Washer; Dryer; Indoor laundry
Neighborhood map
What this means for you Summary
Snapshot
- This is a 3-bed/2.0-bath single-family listed at $369k.
Deal economics
- At list price, monthly cash flow is $-810 ($-10k/yr) — negative.
- To cash-flow at today's rent, offer at most $226k (38.8% below list).
- To meet the 1% rule (rent ≥ 1% of price), the offer needs to be $254k (31.2% below list).
- Recommended offer: $226k (38.8% below list) — sets the bar for cash-flow.
Location & tenants
- Location reads 69/100 on livability (#471 in FL) — a middle-class / working-renter tenant base. Strengths: health & safety A+, cost of living A, crime A-; Watch: amenities F, commute F, employment D-.
- Sumter (rural): math 61% / reading 61% proficiency, ranked #11 of 73 in FL (top 15%) — acceptable for families but not a draw, mixed tenant base, ~2y average lease.
- Zoned schools: Wildwood Elementary School (math 49% / reading 52%, grade D+, #1,055 of 2,144 statewide, top 50%, 940 students, 76% FRL); South Sumter Middle School (math 55% / reading 54%, grade B-, #183 of 571 statewide, top 34%, 897 students, 61% FRL) — zoned schools average 68% FRL vs 51% district-wide (18 pts higher); higher-poverty schools than district average — tighter screening recommended.
- Market conditions: 269 active listings in the ZIP; 4 comparable units currently listed for rent nearby; rentals at typical pace (median 23d on market — plan ~3-4 weeks tenant-placement turnaround); solid renter incomes; 3,961 units permitted in Sumter County in 2024 (248 in 5+ unit buildings).
- This rent runs 31% of the median local income ($97k/yr) — at the standard rent-burdened threshold; future hikes will face affordability resistance.
Forward outlook
- In year one you build about $39k of equity ($3k loan paydown + $37k appreciation (10.0% local appreciation)).
- Sumter County population projected at +45% by 2050 — long-run rental-demand tailwind backs the buy-and-hold thesis.
- By year 2, paydown + projected appreciation supports a ~$63k cash-out refi (75% LTV) — recoverable capital for the next deal without selling this one.
Negotiation context
- It's been on market 137 days — a 12% lower offer ($325k) is reasonable based on typical stale-listing flexibility.
- 2 sale attempts with the ask held roughly flat each time — persistent listings suggest the price (not the market) is what's stuck; bring a comps-based counter.
Risks & watch-outs
- Climate carrying-cost: severe wind risk, 99% chance of damaging wind over 30y; moderate wildfire risk; extreme-heat days projected 7→22/yr by 2055 (HVAC capex compounding) — expect insurance premiums to compound above CPI over the hold.
Questions for the listing agent
- What do current leases actually rent for vs. the listed asking? Can we see a recent rent roll and the last 12 months of T-12 income?
- It's been on market 137 days. Have you received any prior offers? Is the seller open to a 39% concession, seller financing, or rate buy-down credit?
- What does the HOA fee cover, when was the last increase, and are there any pending special assessments or reserve-fund shortfalls?
- Why hasn't it sold? Are there any deal-killer items the seller is aware of (foundation, flood, title, zoning, code violations)?
- Is there a deadline driving the sale (1031 exchange, divorce, estate, relocation)? That informs how much negotiation room exists.
- The area grade is low — what's the realistic commute time and amenity access for the typical tenant pool here? Any planned neighborhood developments (good or bad) we should know about?
- What's the average days-on-market for RENTAL listings here right now (not sales)? A rising rental-DOM trend means longer vacancies and softer asking-rent achievability than the comps imply.
- What's the recent tenant-quality profile in this submarket — average credit score on applications, eviction rate, late-payment / NSF rate, and stable-employment percentage? A property-management company in the area should have these aggregated.
- How much new for-sale + rental construction is in the pipeline within 1–3 miles? Heavy new supply typically softens prices + rents 12–24 months out; constrained supply supports both.
Investment metrics
- 1% rule
- 0.69% ✗
- Cap rate
- 3.66%
- Cash-on-cash
- -9.40%
- DSCR
- 0.58
- GRM
- 12.1
CMA / ARV
- ARV (on-the-fly)
- $371,000
- Comps found
- 12
Show comp detail 12 sales within ~0.75 mi
| Address | Dist | Beds/Ba | Sqft | Sold | Price | $/sf | Match |
|---|---|---|---|---|---|---|---|
| 578 Kaolin Path | 0.22mi | 3/2.0 | 1,484 (0%) | 6mo | $383,000 | $258 | 84 |
| 493 Kayla Ct | 0.38mi | 3/2.0 | 1,426 (-4%) | 0mo | $338,000 | $237 | 76 |
| 744 Barron Pl | 0.26mi | 3/2.0 | 1,611 (+9%) | 0mo | $400,000 | $248 | 74 |
| 5978 Conley Ct | 0.29mi | 3/2.0 | 1,527 (+3%) | 12mo | $360,000 | $236 | 72 |
| 6370 Danielson Loop | 0.52mi | 3/2.0 | 1,459 (-2%) | 1mo | $395,000 | $271 | 72 |
| 449 Gilson Loop | 0.37mi | 3/2.0 | 1,496 (+1%) | 13mo | $355,000 | $237 | 71 |
| 802 Nancy Dr | 0.27mi | 3/2.0 | 1,392 (-6%) | 14mo | $384,355 | $276 | 66 |
| 767 Barron Pl | 0.30mi | 3/2.0 | 1,611 (+9%) | 8mo | $355,000 | $220 | 65 |
| 6316 Danielson Loop | 0.56mi | 3/2.0 | 1,392 (-6%) | 1mo | $360,000 | $259 | 63 |
| 6222 Dingman Way | 0.75mi | 3/2.0 | 1,524 (+3%) | 8mo | $530,000 | $348 | 54 |
| 781 Nancy Dr | 0.26mi | 2/2.0 (-1) | 1,262 (-15%) | 14mo | $315,000 | $250 | 47 |
| 530 Casteel Ave | 0.62mi | 3/2.0 | 1,704 (+15%) | 9mo | $405,000 | $238 | 39 |
Match score weights: distance 35% · size 25% · config 20% · recency 20%. Top-matched comps best support the ARV.
Projected returns pro-forma
10.0% appreciation · 3.0% rent growth · sell at horizon
- IRR
- 17.7%
- Equity multiple
- 2.45×
- Total profit
- $149,594
- Equity at exit
- $332,424
- IRR
- 16.6%
- Equity multiple
- 5.66×
- Total profit
- $481,486
- Equity at exit
- $716,886
Cash invested: $103,320 (down + closing). Projections, not guarantees.
Landlord ↔ Tenant lean methodology
- Overall (STATE)
- 87 Strongly Landlord-Friendly
- State Florida
- 87 Strongly Landlord-Friendly · R+3
- County
- — inherits STATE
- City
- — inherits STATE
ZIP-level market 32163
- Home prices YoY
- 9.8%
- Active inventory
- 269
- Price-to-rent
- 12.1×
Monthly cashflow live
- Estimated rent
- $2,537 medium interval (Pro) →
- Mortgage (P&I)
- −$1,935
- Tax from tax record
- −$527 /mo · $6,330/yr
- Insurance
- −$154
- HOA
- −$198
- Vacancy / Maint / Mgmt
- −$533
- Net cashflow
- $-810
Break-even live
Sensitivity live
| Price | -10% $-601 | -5% $-705 | +0% $-810 | +5% $-914 | +10% $-1,019 |
|---|---|---|---|---|---|
| Rent | -10% $-1,010 | -5% $-910 | +0% $-810 | +5% $-710 | +10% $-609 |
| Rate | -1.0pp $-624 | -0.5pp $-716 | base $-810 | +0.5pp $-905 | +1.0pp $-1,003 |
UW: 25.0% down · 7.5% · 30yr · 1.5% tax · 5.0% vac · 8.0% maint · 8.0% mgmt
Financing live
Cash to close
- Down payment
- $92,250
- Closing costs
- $11,070
- Reserves months
- —
- Total cash needed
- —
Loan-product check · same deal, 3 products live
Conventional
25% down · 7.5% · 30yr
- Down + closing
- —
- Monthly P&I
- —
- Monthly cashflow
- —
- DSCR
- —
- Eligible?
- —
Personal DTI + credit; lowest rate.
DSCR
20% down · 8.5% · 30yr
- Down + closing
- —
- Monthly P&I
- —
- Monthly cashflow
- —
- DSCR
- —
- Eligible?
- —
No personal income docs; deal must DSCR.
Hard money
10% down · 12.0% · 12mo
- Down + closing
- —
- Monthly P&I
- —
- Monthly cashflow
- —
- DSCR
- —
- Eligible?
- —
Short-term bridge; refi at stabilization.
Rent comps 4 comps
| Address | Beds | Baths | Sqft | Rent | $/sqft | DOM | Units | Dist |
|---|---|---|---|---|---|---|---|---|
| 5806 Winn Way Unit 1525269P Wildwood, FL | 3.0 | 2.0 | 1550 | $1,770 | $1.14 | 23d | 1 | 1.15mi |
| 6502 McKnight Loop Unit 1525259P The Villages, FL | 3.0 | 2.0 | 1442 | $1,711 | $1.19 | 0d | 1 | 1.19mi |
| 5541 Goodman Ct The Villages, FL | 2.0 | 2.0 | 1203 | $1,990 | $1.65 | 23d | 1 | 1.27mi |
| 6551 Mason Pl Unit 1545857P The Villages, FL | 3.0 | 2.0 | 1593 | $4,056 | $2.55 | 18d | 1 | 1.48mi |
HOA detail
- Monthly dues
- $198 · $2,376/yr
- Likely covers
- landscaping
Listing history 9 events
-
2026-06-03status $369,000 Pending 137 DOM
-
2026-06-02days on market $369,000 Active 137 DOM
-
2026-06-01days on market $369,000 Active 136 DOM
-
2026-05-31days on market $369,000 Active 135 DOM
-
2026-05-30days on market $369,000 Active 134 DOM
-
2026-05-20price $369,000
-
2026-04-08price $379,000
-
2026-01-16status Active
-
2026-01-16$383,500 Active
ⓘ Source: listings_history table (triggers on properties + properties_extension) + one-shot
backfill from property_details.listing_events for pre-trigger history.
Tax reassessment forecast FL · Resets to sale price
- Current annual tax
- $6,330 · $527/mo
- Projected year-2 tax
- $6,330 · $527/mo
- Expected delta
- $0/yr ($0/mo · -0.0%)
ⓘ Screening estimate from a state-policy table — verify with the county assessor before closing.
Climate risk First Street
- Flood 1/10 Low FEMA zone X (unshaded) · 0% chance over 30 yrs
- Wildfire 5/10 Major
- Heat 8/10 Severe 7 d/yr ≥108°F today · 22 d/yr by 30 yrs out
- Wind 10/10 Extreme 99% chance of damaging wind over 30 yrs
- Air quality 2/10 Low 1 unhealthy d/yr today · 2 by 30 yrs out
Nearby sold comps map
Loading sold comps map…
Walkable amenities ~0.75 mi
Loading nearby amenities…
Taxation est. · year 1
- Rental income
- $30,449
- − Mortgage interest
- −$20,670
- − Property taxes
- −$6,330
- − Insurance
- −$1,845
- − Repairs & maintenance
- −$2,436
- − Management
- −$2,436
- − HOA
- −$2,376
- − Depreciation
- −$10,735
- Taxable loss
- −$16,378
- Est. tax savings @ 24.0%
- +$3,931
- After-tax cash flow
- $-5,786/yr
For passive investors: Depreciation is non-cash, so a rental often shows a tax loss while cash-flowing — sheltering income. Rental losses are passive: they offset passive income freely, and up to $25,000/yr can offset ordinary (W-2) income if you actively participate and your MAGI is under $100k (phasing out to $0 by $150k); unused losses carry forward. On sale, claimed depreciation is recaptured at up to 25%, and gains may owe capital-gains tax (a 1031 exchange can defer both). Figures are a year-1 estimate at your 24.0% rate — not tax advice; consult a CPA.
Schools (NCES district)
- District
- Sumter
- NCES district ID
- 1201800
- Math proficiency
- 61% ▼ -4.00%
- Reading proficiency
- 61% ▼ -2.00%
- Median HH income
- $48,240
- Composite
- 51.74/100
- National rank
- #1682
- State rank
- #11 of 73 in FL
Livability — Wildwood
- Score
- 69/100
- State rank
- #471
- US rank
- #8500
Category grades
Schools grade is shown separately in the Schools card above.
Census & demographics
- Census place
- Wildwood, FL
- County
- Sumter County · 110,591 people
- City population
- 21,568
- Metro
- The Villages, FL
- Population (ZIP)
- 28,549
- Household income
- $96,775
- Rent vs Own
- Severe rent burden
- 307.0
Population outlook (Sumter County) Hauer SSP2
- Today (2025)
- 161,172 people
- By 2030
- 180,083 · +11.7%
- By 2040
- 209,892 · +30.2%
- By 2050
- 234,186 · +45.3%
- By 2075
- 284,602 · +76.6%
- By 2100
- 317,039 · +96.7%
Race, ethnicity, and origin ACS 2023
- Neighborhood character
- Predominantly White (95%)
- Race & ethnicity
- White 95% Two or more races 2% Hispanic / Latino 2% Asian 1%
- Common ancestry
- Romanian 6% Lithuanian 3% Iranian 3%
- Foreign-born
- 6% · Canada, Vietnam
- Languages at home
- 96% English-only · Spanish 2% Vietnamese 1% Other Indo-European 0%
Political lean MEDSL · Sumter
- 2024 margin
- Solid R (+37.6) · D 30.9% · R 68.6%
- 2008→2024 swing
- -10.6pp toward R · 2008: -27.0pp · 2024: -37.6pp
- All cycles
- 2024: R+37.6 2020: R+36.1 2016: R+39.2 2012: R+34.9 2008: R+27.0
Not yet ingested
- Civics
- —
Market trends
- HPI YoY
- ▲ 20.47%
- Current HPI
- 229.0075
- Rent YoY
- —
- Metro
- The Villages, FL
- State GDP YoY
- ▲ 3.28%
- F500 in state
- 36
Industry mix (Fortune 500 HQ in FL)
| Industry | F500 HQs | Revenue |
|---|---|---|
| Industrial Technology | 2 | $29B |
|
||
| Insurance | 2 | $17B |
|
||
| Retail | 1 | $60B |
|
||
| Technology Distribution | 1 | $58B |
|
||
| Homebuilding | 1 | $35B |
|
||
| Technology Manufacturing | 1 | $35B |
|
||
Price history
-3.8% since first listed4 events — show timeline
- 2026-05-20 Price Changed $369,000 Stellar MLS as Distributed by MLS Grid
- 2026-04-08 Price Changed $379,000 Stellar MLS as Distributed by MLS Grid
- 2026-01-16 Relisted — Stellar MLS as Distributed by MLS Grid
- 2026-01-16 Listed $383,500 Stellar MLS as Distributed by MLS Grid
Property tax history
+26.4%/yrLatest (2025): $6,330 · +1.2% YoY. Source: county tax records.
Cash-flow waterfall
monthlySold comps — $/sqft
last 12 mo · ≤1 miLoading sold comps…