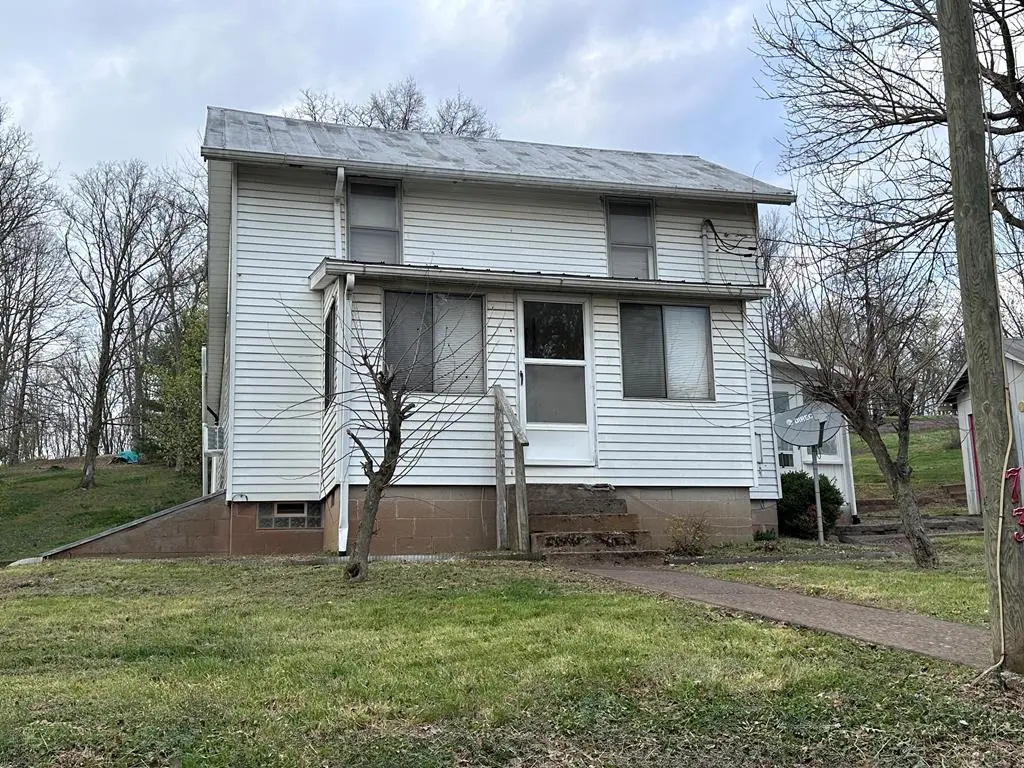
73 Cherry St · Vincent, OH
Flood risk 1/10 · Minimal
- FEMA flood zone
- X (unshaded)
- Chance of flooding over 30 yrs
- 0.0%
- Est. flood insurance / yr
- $473 – $860
Fire risk 1/10 · Minimal
- Est. fire insurance / yr
- $713 – $1,323
Heat risk 4/10 · Minor
- Hot days now (above 100°F)
- 7 days/yr
- Hot days in 30 yrs
- 18 days/yr
Wind risk 2/10 · Minimal
- Chance of severe wind over 30 yrs
- 1.0%
Air-quality risk 1/10 · Minimal
- Unhealthy air days now
- 0 days/yr
- Unhealthy air days in 30 yrs
- 0 days/yr
Risk factors via First Street. Map © Google.
Why this score? — see what drove the C grade
The composite is a weighted blend of 9 inputs, each scored 0–100. Each bar is that input's sub-score; the figure is the points it added to the 100-point composite (weight × sub-score).
- Cash flow +17.1/30.0
- Appreciation +10.0/10.0
- ARV discount +7.5/15.0
- DSCR +5.3/10.0
- Schools +5.3/10.0
- 1% rule +4.2/10.0
- Livability +3.5/5.0
- Rent growth +2.5/5.0
- Condition / age +2.5/5.0
$119,900
🖨 Deal sheet (PDF) 📄 Offer letter ✓ Due diligence
Listing remarks MLS
Move in ready! Home offers many updates, newly remodeled bathroom, large spacious eat-in kitchen that has been nicely updated. New second floor offering 2 bedrooms, forced air furnace and hot water tank in 2011, aluminum roof recoated in 2011, enclosed front porch with enclosed side porch sunroom open to beautiful patio with retaining wall, 2 car detached garage, new French drains around entire home, fire pit with lots of landscaping, dog kennel, play ground area. Enclosed front porch 6'x15', side porch/enclosed sun room 9'x20'. Very nice! #742 Elem: Barlow-Vincent Elementary Scho Elem/Bus: Y JrHigh: Warren Middle JrHigh/Bus: Y High: Warren High School High/Bus: Y Fire: VOL Police: SHF PossFreeGas: N ; SQFT=Fin L1:768, Fin L2:384, Fin Bsmt:0, Fin Above:1152, Fin Total:1152, Unfin Bsmt:384, Unfin Above:384;GAR= 2 Car Det
Key facts
- Enclosed side porch
- Shed
- Rear concrete patio
Tags
Property features AI
Finance
- Financial info: $1,872 annual tax (listed)
Exterior
- Parking: Detached gravel parking; 2 covered parking spaces; 2 garage spaces (detached); 2 total parking spaces; Open parking available
- Utilities: 200+ amp electrical service; Water: Other; Sewer: Other
- Home design: Single-family residence; Two levels; Residential property
- Construction: Vinyl siding; Built with standard foundation
- Exterior features: Porch; Metal roof
Interior
- Bedrooms: 2 main-level bedrooms
- Flooring: Ceramic tile; Carpet; Vinyl; Laminate
- Bathrooms: 1 full bathroom on the main level
- Heating & cooling: Forced air heating (natural gas); No central cooling
- Interior features: Gas water heater; Partial basement
Neighborhood map
What this means for you Summary
Snapshot
- This is a 4-bed/1.0-bath single-family listed at $120k.
Deal economics
- At list price, monthly cash flow is $83 ($993/yr) — positive.
- The deal already cash-flows at list — no discount required.
- To meet the 1% rule (rent ≥ 1% of price), the offer needs to be $111k (7.5% below list).
- Recommended offer: $111k (7.5% below list) — sets the bar for 1% rule.
Location & tenants
- Location reads 70/100 on livability (#456 in OH) — a middle-class / working-renter tenant base. Strengths: cost of living A+, housing A+, employment A; Watch: crime C-, health & safety D, amenities F.
- Warren Local (rural): math 57% / reading 67% proficiency, ranked #253 of 656 in OH (top 39%) — acceptable for families but not a draw, mixed tenant base, ~2y average lease.
- Market conditions: 17 active listings in the ZIP; solid renter incomes; 3 units permitted in Washington County in 2024 (0 in 5+ unit buildings).
- This rent is only 17% of the median local income ($80k/yr) — well below the 30% rent-burden line; pricing power to push rent on renewal without tenant pushback.
Forward outlook
- In year one you build about $13k of equity ($829 loan paydown + $12k appreciation (10.0% local appreciation)).
- Washington County population projected at -12% by 2050 — secular population decline; favor cash flow + early exit over multi-decade hold.
- At projected returns (10.0% appreciation + 3.0% rent growth), your $34k cash investment doubles in ~3 years — after that, you're playing with house money.
- By year 3, paydown + projected appreciation supports a ~$32k cash-out refi (75% LTV) — recoverable capital for the next deal without selling this one.
Negotiation context
- It's been on market 20 days — a 2% lower offer ($118k) is reasonable based on typical stale-listing flexibility.
- 2 sale attempts since 12y ago with the ask held roughly flat each time — persistent listings suggest the price (not the market) is what's stuck; bring a comps-based counter.
- Current owner paid $89k; 34% above their basis — modest negotiation headroom, anchor on the comps not their cost.
Risks & watch-outs
- Watch-outs: built in 1951 — expect roof / HVAC / electrical / plumbing capex.
Questions for the listing agent
- Built in 1951 — when were the roof, HVAC, electrical panel, plumbing, and water heater last replaced?
- Is there a deadline driving the sale (1031 exchange, divorce, estate, relocation)? That informs how much negotiation room exists.
- Schools are B-rated — typically a magnet for longer-tenancy family renters. What's the average tenant stay here, and is there a school-zone premium baked into asking?
- What's the average days-on-market for RENTAL listings here right now (not sales)? A rising rental-DOM trend means longer vacancies and softer asking-rent achievability than the comps imply.
- What's the recent tenant-quality profile in this submarket — average credit score on applications, eviction rate, late-payment / NSF rate, and stable-employment percentage? A property-management company in the area should have these aggregated.
- How much new for-sale + rental construction is in the pipeline within 1–3 miles? Heavy new supply typically softens prices + rents 12–24 months out; constrained supply supports both.
Investment metrics
- 1% rule
- 0.92% ✗
- Cap rate
- 7.12%
- Cash-on-cash
- 2.96%
- DSCR
- 1.13
- GRM
- 9.0
CMA / ARV
No comps found within radius.
Projected returns pro-forma
10.0% appreciation · 3.0% rent growth · sell at horizon
- IRR
- 26.4%
- Equity multiple
- 3.10×
- Total profit
- $70,566
- Equity at exit
- $108,015
- IRR
- 23.2%
- Equity multiple
- 7.07×
- Total profit
- $203,651
- Equity at exit
- $232,939
Cash invested: $33,572 (down + closing). Projections, not guarantees.
Landlord ↔ Tenant lean methodology
- Overall (STATE)
- 73 Landlord-Friendly
- State Ohio
- 73 Landlord-Friendly · R+6
- County
- — inherits STATE
- City
- — inherits STATE
ZIP-level market 45784
- Home prices YoY
- 10.5%
- Active inventory
- 17
- Price-to-rent
- 9.0×
Monthly cashflow live
- Estimated rent
- $1,109 medium interval (Pro) →
- Mortgage (P&I)
- −$629
- Tax from tax record
- −$114 /mo · $1,373/yr
- Insurance
- −$50
- HOA
- −$0
- Vacancy / Maint / Mgmt
- −$233
- Net cashflow
- $83
Break-even live
Sensitivity live
| Price | -10% $151 | -5% $117 | +0% $83 | +5% $49 | +10% $15 |
|---|---|---|---|---|---|
| Rent | -10% $-5 | -5% $39 | +0% $83 | +5% $127 | +10% $170 |
| Rate | -1.0pp $143 | -0.5pp $113 | base $83 | +0.5pp $52 | +1.0pp $20 |
UW: 25.0% down · 7.5% · 30yr · 1.5% tax · 5.0% vac · 8.0% maint · 8.0% mgmt
Financing live
Cash to close
- Down payment
- $29,975
- Closing costs
- $3,597
- Reserves months
- —
- Total cash needed
- —
Loan-product check · same deal, 3 products live
Conventional
25% down · 7.5% · 30yr
- Down + closing
- —
- Monthly P&I
- —
- Monthly cashflow
- —
- DSCR
- —
- Eligible?
- —
Personal DTI + credit; lowest rate.
DSCR
20% down · 8.5% · 30yr
- Down + closing
- —
- Monthly P&I
- —
- Monthly cashflow
- —
- DSCR
- —
- Eligible?
- —
No personal income docs; deal must DSCR.
Hard money
10% down · 12.0% · 12mo
- Down + closing
- —
- Monthly P&I
- —
- Monthly cashflow
- —
- DSCR
- —
- Eligible?
- —
Short-term bridge; refi at stabilization.
Listing history 14 events
-
2026-06-21days on market $119,900 Active 20 DOM
-
2026-06-19days on market $119,900 Active 18 DOM
-
2026-06-18days on market $119,900 Active 17 DOM
-
2026-06-17days on market $119,900 Active 16 DOM
-
2026-06-16days on market $119,900 Active 15 DOM
-
2026-06-15days on market $119,900 Active 14 DOM
-
2026-06-14days on market $119,900 Active 12 DOM
-
2026-06-12days on market $119,900 Active 11 DOM
-
2026-06-09days on market $119,900 Active 8 DOM
-
2026-06-08days on market $119,900 Active 7 DOM
-
2026-06-07days on market $119,900 Active 6 DOM
-
2026-06-07days on market $119,900 Active 5 DOM
-
2026-06-01remarks 618-char remark
-
2026-06-01$119,900 Active 1 DOM
ⓘ Source: listings_history table (triggers on properties + properties_extension) + one-shot
backfill from property_details.listing_events for pre-trigger history.
Tax reassessment forecast OH · Partial reset (capped growth)
- Current annual tax
- $1,373 · $114/mo
- Projected year-2 tax
- $1,622 · $135/mo
- Expected delta
- +$249/yr (+$21/mo · 18.1%)
ⓘ Screening estimate from a state-policy table — verify with the county assessor before closing.
Climate risk First Street
- Flood 1/10 Low FEMA zone X (unshaded) · 0% chance over 30 yrs
- Wildfire 1/10 Low
- Heat 4/10 Moderate 7 d/yr ≥100°F today · 18 d/yr by 30 yrs out
- Wind 2/10 Low 100% chance of damaging wind over 30 yrs
- Air quality 1/10 Low 0 unhealthy d/yr today · 0 by 30 yrs out
Nearby sold comps map
Loading sold comps map…
Walkable amenities ~0.75 mi
Loading nearby amenities…
Taxation est. · year 1
- Rental income
- $13,304
- − Mortgage interest
- −$6,716
- − Property taxes
- −$1,373
- − Insurance
- −$600
- − Repairs & maintenance
- −$1,064
- − Management
- −$1,064
- − Depreciation
- −$3,488
- Taxable loss
- −$1,001
- Est. tax savings @ 24.0%
- +$240
- After-tax cash flow
- $1,233/yr
For passive investors: Depreciation is non-cash, so a rental often shows a tax loss while cash-flowing — sheltering income. Rental losses are passive: they offset passive income freely, and up to $25,000/yr can offset ordinary (W-2) income if you actively participate and your MAGI is under $100k (phasing out to $0 by $150k); unused losses carry forward. On sale, claimed depreciation is recaptured at up to 25%, and gains may owe capital-gains tax (a 1031 exchange can defer both). Figures are a year-1 estimate at your 24.0% rate — not tax advice; consult a CPA.
Schools (NCES district)
- District
- Warren Local
- NCES district ID
- 3910018
- Math proficiency
- 57% ▼ -3.00%
- Reading proficiency
- 67% ▼ -6.00%
- Median HH income
- $54,190
- Composite
- 53.1/100
- National rank
- #1515
- State rank
- #253 of 656 in OH
Livability — Vincent
- Score
- 70/100
- State rank
- #456
- US rank
- #7519
Category grades
Schools grade is shown separately in the Schools card above.
Census & demographics
- County
- Washington · 57,253 people
- Population (ZIP)
- 3,089
- Household income
- $80,096
- Rent vs Own
Population outlook (Washington County) Hauer SSP2
- Today (2025)
- 59,640 people
- By 2030
- 58,315 · -2.2%
- By 2040
- 55,186 · -7.5%
- By 2050
- 52,246 · -12.4%
- By 2075
- 45,893 · -23.0%
- By 2100
- 38,128 · -36.1%
Race, ethnicity, and origin ACS 2023
- Neighborhood character
- Predominantly White (98%)
- Race & ethnicity
- White 98% Hispanic / Latino 1% Two or more races 1%
- Common ancestry
- Slovak 3% Lithuanian 2% Iranian 2%
Political lean MEDSL · Washington
- 2024 margin
- Solid R (+43.8) · D 27.7% · R 71.5%
- 2008→2024 swing
- +40.2pp toward D · 2008: -83.9pp · 2024: -43.8pp
- All cycles
- 2024: R+43.8 2020: R+40.8 2016: R+41.6 2012: R+19.4 2008: R+83.9
Not yet ingested
- Civics
- —
Market trends
- HPI YoY
- ▲ 23.20%
- Current HPI
- 244.5918
- Rent YoY
- —
- Metro
- —
- State GDP YoY
- ▲ 1.98%
- F500 in state
- 48
Industry mix (Fortune 500 HQ in OH)
| Industry | F500 HQs | Revenue |
|---|---|---|
| Insurance | 3 | $145B |
|
||
| Industrial Machinery | 3 | $49B |
|
||
| Financial Services | 3 | $24B |
|
||
| Consumer Goods | 2 | $93B |
|
||
| Aerospace / Defense | 2 | $47B |
|
||
| Utilities | 2 | $33B |
|
||
Price history
+84.5% since first listed6 events — show timeline
- 2026-06-01 Listed $119,900 SVAR
- 2026-01-23 Sold (Public Records) $89,333 Public Records
- 2015-04-20 Sold (Public Records) $107,000 Public Records
- 2015-04-17 Sold (MLS) $107,000 MLSNOW
- 2014-11-24 Listed $109,900 MLSNOW
- 2013-06-11 Sold (Public Records) $65,000 Public Records
Property tax history
+9.1%/yrLatest (2025): $1,373 · +71.7% YoY. Source: county tax records.
Cash-flow waterfall
monthlySold comps — $/sqft
last 12 mo · ≤1 miLoading sold comps…