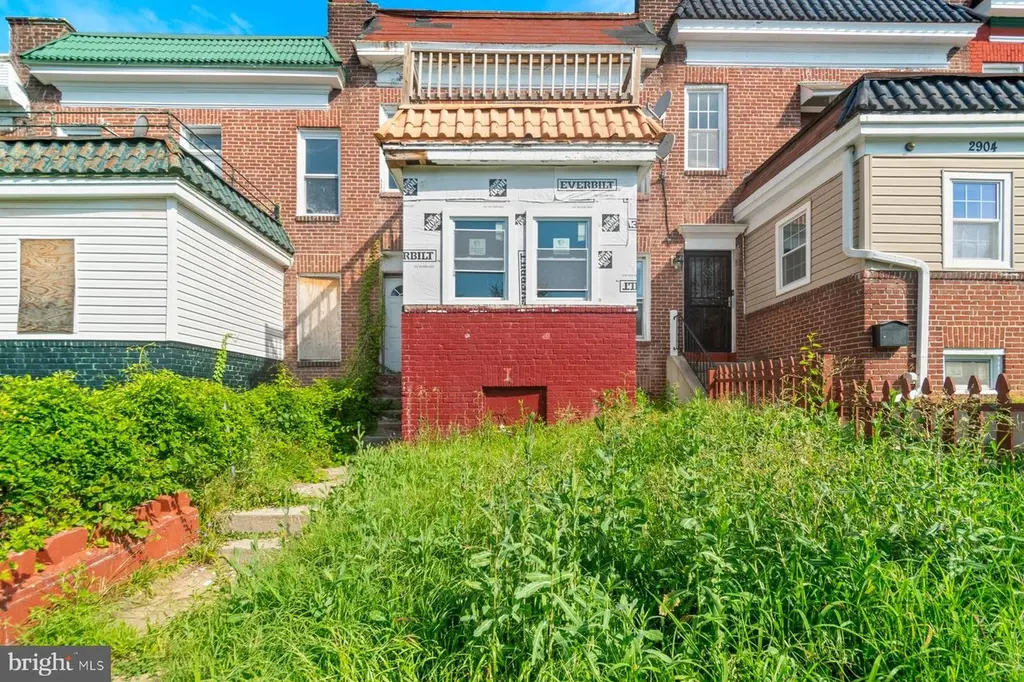
2906 Violet Ave · Baltimore, MD
Flood risk 1/10 · Minimal
- FEMA flood zone
- X (unshaded)
- Chance of flooding over 30 yrs
- 0.0%
- Est. flood insurance / yr
- $473 – $860
Fire risk 1/10 · Minimal
- Est. fire insurance / yr
- $755 – $1,403
Heat risk 7/10 · Major
- Hot days now (above 104°F)
- 7 days/yr
- Hot days in 30 yrs
- 15 days/yr
Wind risk 6/10 · Moderate
- Chance of severe wind over 30 yrs
- 27.0%
Air-quality risk 3/10 · Minor
- Unhealthy air days now
- 3 days/yr
- Unhealthy air days in 30 yrs
- 4 days/yr
Risk factors via First Street. Map © Google.
Why this score? — see what drove the B- grade
The composite is a weighted blend of 9 inputs, each scored 0–100. Each bar is that input's sub-score; the figure is the points it added to the 100-point composite (weight × sub-score).
- Cash flow +30.0/30.0
- 1% rule +10.0/10.0
- DSCR +10.0/10.0
- ARV discount +7.5/15.0
- Livability +3.8/5.0
- Rent growth +3.1/5.0
- Condition / age +2.5/5.0
- Schools +1.0/10.0
- Appreciation +0.0/10.0
$99,000
🖨 Deal sheet 📄 Offer letter ✓ Due diligence
Listing remarks MLS
Great opportunity to make this home your own or design the ideal investment property in the Park Circle District! Once renovated, this home offers the opportunity to become a charming 3BR/2.5BA residence. The rough-in electrical, plumbing, and HVAC inspections have already been completed, along with the framing inspection. It is ready for your vision and updates!
Key facts
- Built 1920
- Listed 97 days
Neighborhood map
What this means for you Summary
Snapshot
- This is a 3-bed/2.5-bath townhouse listed at $99k.
Deal economics
- At list price, monthly cash flow is $802 ($10k/yr) — positive.
- The deal already cash-flows at list — no discount required.
- Meets the 1% rule at list price ($2k rent vs $99k).
- Recommended offer: $90k (9.0% below list) — sets the bar for market timing.
- Cap rate 16.0% vs local median 6.0% in Baltimore — top-decile yield for the area; either an underpriced asset or a hidden risk that comps aren't pricing in. Stress-test before assuming the spread holds.
Location & tenants
- Location reads 76/100 on livability (#90 in MD, #3,396 nationally) — a middle-class / working-renter tenant base. Strengths: amenities A+, commute A+, housing A+; Watch: schools D, crime F.
- Baltimore City Public Schools (urban): math 7% / reading 16% proficiency, ranked #24 of 24 in MD (top 100%) — low school quality limits family demand, transient renter base, plan for 1-2y turnover; 79% free/reduced lunch — lower-income household profile, screen leases tightly.
- Market conditions: Rents rising (+2.4%/yr); 351 active listings in the ZIP; 40 comparable units currently listed for rent nearby; rentals at typical pace (median 24d on market — plan ~3-4 weeks tenant-placement turnaround); 45% of comp listings sitting > 30 days — soft ceiling on asking rent; 1,273 units permitted in Baltimore city in 2024 (1,104 in 5+ unit buildings).
- This rent runs 44% of the median local income ($52k/yr) — at the standard rent-burdened threshold; future hikes will face affordability resistance.
Forward outlook
- Local home prices are declining (-3.0%/yr); year-one equity from $684 of loan paydown is wiped out by about $3k of value loss. Plan a longer hold.
- Baltimore County population projected to shrink 4% by 2050 — rents likely to lag national; underwrite the cash flow, not the appreciation.
- At projected returns (-3.0% appreciation + 2.4% rent growth), your $28k cash investment doubles in ~4 years — after that, you're playing with house money.
Negotiation context
- It's been on market 97 days — a 9% lower offer ($90k) is reasonable based on typical stale-listing flexibility.
- 8 sale attempts since 3y ago with the ask held roughly flat each time — persistent listings suggest the price (not the market) is what's stuck; bring a comps-based counter.
- Current owner paid $40k; list at $99k implies a 148% gain — meaningful room to come down on a strong offer.
Risks & watch-outs
- Watch-outs: built in 1920 — expect roof / HVAC / electrical / plumbing capex.
- Climate carrying-cost: major wind risk, 27% chance of damaging wind over 30y; extreme-heat days projected 7→15/yr by 2055 (HVAC capex compounding) — expect insurance premiums to compound above CPI over the hold.
Questions for the listing agent
- It's been on market 97 days. Have you received any prior offers? Is the seller open to a 9% concession, seller financing, or rate buy-down credit?
- Built in 1920 — when were the roof, HVAC, electrical panel, plumbing, and water heater last replaced?
- Why hasn't it sold? Are there any deal-killer items the seller is aware of (foundation, flood, title, zoning, code violations)?
- Is there a deadline driving the sale (1031 exchange, divorce, estate, relocation)? That informs how much negotiation room exists.
- Schools are D-rated, which usually means shorter tenancies and higher turnover. Who's the typical renter profile here, and what's been the actual vacancy rate?
- Crime grade is F in this area — have there been break-ins, vandalism, or insurance claims at this property in the last 3 years? What carrier currently insures it and at what premium?
- What's the average days-on-market for RENTAL listings here right now (not sales)? A rising rental-DOM trend means longer vacancies and softer asking-rent achievability than the comps imply.
- What's the recent tenant-quality profile in this submarket — average credit score on applications, eviction rate, late-payment / NSF rate, and stable-employment percentage? A property-management company in the area should have these aggregated.
- How much new for-sale + rental construction is in the pipeline within 1–3 miles? Heavy new supply typically softens prices + rents 12–24 months out; constrained supply supports both.
Investment metrics
- 1% rule
- 1.90% ✓
- Cap rate
- 16.01%
- Cash-on-cash
- 34.71%
- DSCR
- 2.54
- GRM
- 4.4
CMA / ARV
- ARV (median comp)
- $207,805
- List price
- $99,000
- Delta
- -52.36%
- Verdict
- UNDERPRICED
- Comps
- 20 within 1.0 mi
Show comp detail 12 sales within ~0.75 mi
| Address | Dist | Beds/Ba | Sqft | Sold | Price | $/sf | Match |
|---|---|---|---|---|---|---|---|
| 3635 Wabash Ave | 0.25mi | 3/1.5 | 1,400 (-6%) | 4mo | $159,000 | $114 | 71 |
| 3206 Yosemite Ave | 0.20mi | 3/1.5 | 1,360 (-9%) | 2mo | $215,000 | $158 | 70 |
| 4027 Annellen Rd | 0.39mi | 4/2.0 (+1) | 1,452 (-3%) | 3mo | $220,900 | $152 | 68 |
| 3927 Cedardale Rd | 0.46mi | 3/2.0 | 1,578 (+6%) | 4mo | $208,000 | $132 | 64 |
| 4023 Reisterstown Rd | 0.36mi | 4/4.0 (+1) | 1,400 (-6%) | 2mo | $250,000 | $179 | 60 |
| 2531 Boarman Ave | 0.69mi | 4/2.5 (+1) | 1,479 (-1%) | 4mo | $254,000 | $172 | 58 |
| 3654 Malden Ave | 0.64mi | 3/1.5 | 1,431 (-4%) | 3mo | $254,000 | $177 | 57 |
| 3825 Pall Mall Rd | 0.35mi | 4/2.0 (+1) | 1,670 (+12%) | 2mo | $246,000 | $147 | 55 |
| 2523 Boarman Ave | 0.70mi | 3/1.0 | 1,450 (-3%) | 3mo | $82,500 | $57 | 54 |
| 3616 Keystone Ave | 0.70mi | 3/1.5 | 1,572 (+5%) | 2mo | $280,000 | $178 | 53 |
| 3911 Bareva Rd | 0.57mi | 4/2.0 (+1) | 1,620 (+9%) | 0mo | $112,100 | $69 | 52 |
| 3627 Keystone Ave | 0.73mi | 2/2.0 (-1) | 1,336 (-10%) | 2mo | $280,000 | $210 | 40 |
Match score weights: distance 35% · size 25% · config 20% · recency 20%. Top-matched comps best support the ARV.
Projected returns pro-forma
-3.0% appreciation · 2.41% rent growth · sell at horizon
- IRR
- 29.5%
- Equity multiple
- 2.22×
- Total profit
- $33,948
- Equity at exit
- $14,761
- IRR
- 36.5%
- Equity multiple
- 4.28×
- Total profit
- $90,937
- Equity at exit
- $8,560
Cash invested: $27,720 (down + closing). Projections, not guarantees.
Landlord ↔ Tenant lean methodology
- Overall (CITY)
- 12 Strongly Tenant-Friendly
- State Maryland
- 27 Tenant-Leaning · D+14
- County
- — inherits STATE
- City Baltimore
- 12 Strongly Tenant-Friendly · D+58
ZIP-level market 21215
- Rents YoY
- 2.4%
- Active inventory
- 351
- Price-to-rent
- 4.4×
Monthly cashflow live
- Estimated rent
- $1,886 high interval (Pro) →
- Mortgage (P&I)
- −$519
- Tax from tax record
- −$127 /mo · $1,529/yr
- Insurance
- −$41
- HOA
- −$0
- Vacancy / Maint / Mgmt
- −$396
- Net cashflow
- $802
Break-even live
UW: 25.0% down · 7.5% · 30yr · 1.5% tax · 5.0% vac · 8.0% maint · 8.0% mgmt
Financing live
Cash to close
- Down payment
- $24,750
- Closing costs
- $2,970
- Reserves months
- —
- Total cash needed
- —
Loan-product check · same deal, 3 products live
Conventional
25% down · 7.5% · 30yr
- Down + closing
- —
- Monthly P&I
- —
- Monthly cashflow
- —
- DSCR
- —
- Eligible?
- —
Personal DTI + credit; lowest rate.
DSCR
20% down · 8.5% · 30yr
- Down + closing
- —
- Monthly P&I
- —
- Monthly cashflow
- —
- DSCR
- —
- Eligible?
- —
No personal income docs; deal must DSCR.
Hard money
10% down · 12.0% · 12mo
- Down + closing
- —
- Monthly P&I
- —
- Monthly cashflow
- —
- DSCR
- —
- Eligible?
- —
Short-term bridge; refi at stabilization.
Rent comps 40 comps
| Address | Beds | Baths | Sqft | Rent | $/sqft | DOM | Units | Dist |
|---|---|---|---|---|---|---|---|---|
| 3204 Sequoia Ave Baltimore, MD | 4.0 | 2.5 | 1791 | $2,600 | $1.45 | 43d | 1 | 0.25mi |
| 3822 Pall Mall Rd Baltimore, MD | 3.0 | 1.5 | 1320 | $1,875 | $1.42 | 43d | 1 | 0.32mi |
| 4230 Towanda Ave Baltimore, MD | 3.0 | 2.0 | 1400 | $1,800 | $1.29 | 17d | 1 | 0.51mi |
| 2415 Loyola Southway Baltimore, MD | 3.0 | 1.5 | 1200 | $2,033 | $1.69 | 43d | 1 | 0.58mi |
| 2619 Loyola Northway Baltimore, MD | 3.0 | 2.0 | 1400 | $1,995 | $1.43 | 24d | 1 | 0.62mi |
| 3508 Grantley Rd Baltimore, MD | 2.0 | 1.0 | 1250 | $1,350 | $1.08 | 24d | 1 | 0.68mi |
| 2910 Reisterstown Rd Baltimore, MD | 1.0–3.0 | 1.0 | 950 | $1,414 | $1.49 | 14d | 4 | 0.72mi |
| 2454 W Cold Spring Ln Baltimore, MD | 3.0 | 1.0 | 1200 | $1,650 | $1.38 | 24d | 1 | 0.76mi |
| 3632 Parkdale Ave Baltimore, MD | 3.0 | 1.0 | 1400 | $3,000 | $2.14 | 43d | 1 | 0.78mi |
| 2915 Oakford Ave Baltimore, MD | 3.0 | 2.0 | 1102 | $1,600 | $1.45 | 17d | 1 | 0.78mi |
| 2080 Rockrose Ave Unit 2080-201 Baltimore, MD | 2.0 | 2.0 | 1080 | $2,100 | $1.94 | 24d | 1 | 0.80mi |
| 2078 Druid Park Dr Baltimore, MD | 2.0 | 3.0 | 1500 | $2,500 | $1.67 | 43d | 1 | 0.80mi |
| 2078 Druid Park Dr Unit 4 Baltimore, MD | 2.0 | 2.5 | 1500 | $2,500 | $1.67 | 43d | 1 | 0.80mi |
| 3104 Tioga Pkwy Baltimore, MD | 3.0 | 2.0 | 1640 | $2,050 | $1.25 | 22d | 1 | 0.87mi |
| 2824 Edgecombe Cir S Baltimore, MD | 2.0 | 2.0 | 950 | $1,475 | $1.55 | 22d | 1 | 0.87mi |
| 3001 Carlisle Ave Baltimore, MD | 3.0 | 1.0 | 1024 | $1,300 | $1.27 | 43d | 1 | 0.88mi |
| 2738 N Longwood St Baltimore, MD | 3.0 | 1.0 | 1024 | $1,399 | $1.37 | 43d | 1 | 0.88mi |
| 2742 N Rosedale St Baltimore, MD | 3.0 | 1.0 | 1024 | $1,350 | $1.32 | 43d | 2 | 0.92mi |
| 2530 Edgecombe Cir N Baltimore, MD | 2.0–3.0 | 1.0 | 920 | $1,325 | $1.44 | 2d | 4 | 0.92mi |
| 3403 Carlisle Ave Apt 1 Baltimore, MD | 2.0 | 1.0 | 1100 | $1,600 | $1.45 | 11d | 1 | 0.99mi |
| 3028 Hanlon Ave Baltimore, MD | 3.0 | 2.0 | 1200 | $1,711 | $1.43 | 24d | 1 | 1.01mi |
| 3784 Columbus Dr Baltimore, MD | 4.0 | 2.0 | 1250 | $2,200 | $1.76 | 24d | 1 | 1.03mi |
| 3401 Woodbrook Ave Unit 1 Baltimore, MD | 3.0 | 1.0 | 900 | $1,199 | $1.33 | 24d | 1 | 1.09mi |
| 4714 Greenspring Ave Baltimore, MD | 2.0 | 1.0 | 890 | $1,295 | $1.46 | 43d | 1 | 1.10mi |
| 4320 Roland Heights Ave Baltimore, MD | 3.0 | 2.5 | 1800 | $3,300 | $1.83 | 17d | 1 | 1.10mi |
| 4322 Roland Heights Ave Baltimore, MD | 3.0 | 3.0 | 1800 | $3,000 | $1.67 | 43d | 1 | 1.11mi |
| 3735 Manchester Ave Baltimore, MD | 2.0 | 1.0 | 1000 | $1,350 | $1.35 | 4d | 1 | 1.11mi |
| 4319 Medfield Ave Baltimore, MD | 3.0 | 2.5 | 1800 | $3,100 | $1.72 | 43d | 1 | 1.15mi |
| 4828 Beaufort Ave Baltimore, MD | 2.0 | 2.5 | 1200 | $1,850 | $1.54 | 24d | 1 | 1.16mi |
| 2330 Bryant Ave Unit 4 Baltimore, MD | 2.0 | 1.0 | 950 | $1,500 | $1.58 | 20d | 1 | 1.17mi |
| 3915 Liberty Heights Ave Gwynn Oak, MD | 1.0–2.0 | 1.0–2.0 | 680 | $1,345 | $1.98 | 12d | 5 | 1.18mi |
| 2001 W Cold Spring Ln Baltimore, MD | 1.0–3.0 | 1.0–2.0 | 1154 | $3,505 | $3.04 | 1d | 31 | 1.20mi |
| 3017 Poplar Ter Baltimore, MD | 2.0 | 1.0 | 880 | $1,349 | $1.53 | 24d | 1 | 1.24mi |
| 1527 W 36th St Unit 2ND FLOOR Baltimore, MD | 2.0 | 1.0 | 1200 | $1,600 | $1.33 | 43d | 1 | 1.24mi |
| 2301 Whittier Ave Unit 3 Baltimore, MD | 2.0 | 2.0 | 1104 | $1,650 | $1.49 | 43d | 1 | 1.25mi |
| 2301 Whittier Ave Unit 1 Baltimore, MD | 2.0 | 1.0 | 1104 | $1,400 | $1.27 | 43d | 1 | 1.25mi |
| 2301 Whittier Ave Unit 2 Baltimore, MD | 2.0 | 2.0 | 1104 | $1,400 | $1.27 | 43d | 1 | 1.25mi |
| 2201 Whittier Ave Baltimore, MD | 4.0 | 2.0 | 1750 | $1,700 | $0.97 | 17d | 1 | 1.25mi |
| 2201 Whittier Ave Baltimore, MD | 4.0 | 2.0 | 1750 | $1,700 | $0.97 | 43d | 1 | 1.25mi |
| 2812 Clifton Ave Baltimore, MD | 3.0 | 1.5 | 1650 | $1,850 | $1.12 | 43d | 1 | 1.27mi |
Listing history 31 events
-
2026-06-18days on market $99,000 Active 97 DOM
-
2026-06-17days on market $99,000 Active 96 DOM
-
2026-06-16days on market $99,000 Active 95 DOM
-
2026-06-15days on market $99,000 Active 94 DOM
-
2026-06-13days on market $99,000 Active 92 DOM
-
2026-06-09days on market $99,000 Active 88 DOM
-
2026-06-08days on market $99,000 Active 87 DOM
-
2026-06-07days on market $99,000 Active 86 DOM
-
2026-06-04days on market $99,000 Active 83 DOM
-
2026-06-03days on market $99,000 Active 82 DOM
-
2026-06-02days on market $99,000 Active 81 DOM
-
2026-06-01days on market $99,000 Active 80 DOM
-
2026-05-31days on market $99,000 Active 79 DOM
-
2026-03-13$99,000 Active 365-char remark
Show marketing remark (365 chars)
Great opportunity to make this home your own or design the ideal investment property in the Park Circle District! Once renovated, this home offers the opportunity to become a charming 3BR/2.5BA residence. The rough-in electrical, plumbing, and HVAC inspections have already been completed, along with the framing inspection. It is ready for your vision and updates!
-
2026-03-13historical
Show marketing remark (365 chars)
Great opportunity to make this home your own or design the ideal investment property in the Park Circle District! Once renovated, this home offers the opportunity to become a charming 3BR/2.5BA residence. The rough-in electrical, plumbing, and HVAC inspections have already been completed, along with the framing inspection. It is ready for your vision and updates!
-
2026-01-09$114,900 Active
-
2025-12-31historical
-
2025-09-03$129,900 Active
-
2025-09-03historical
-
2025-08-22$129,900 Active
-
2023-10-09historical
-
2023-07-01historical
-
2023-03-12status Active
-
2023-03-11status Active
-
2023-03-09status Pending
-
2023-03-09status Pending
-
2023-01-31$99,000 Active
-
2023-01-31$99,000 Active
-
2022-06-29soldstatus $40,000
-
1994-10-06soldstatus $15,000
-
1985-04-11soldstatus $17,000
ⓘ Source: listings_history table (triggers on properties + properties_extension) + one-shot
backfill from property_details.listing_events for pre-trigger history.
Tax reassessment forecast MD · Partial reset (capped growth)
- Current annual tax
- $1,529 · $127/mo
- Projected year-2 tax
- $1,529 · $127/mo
- Expected delta
- $0/yr ($0/mo · 0.0%)
ⓘ Screening estimate from a state-policy table — verify with the county assessor before closing.
Climate risk First Street
- Flood 1/10 Low FEMA zone X (unshaded) · 0% chance over 30 yrs
- Wildfire 1/10 Low
- Heat 7/10 Severe 7 d/yr ≥104°F today · 15 d/yr by 30 yrs out
- Wind 6/10 Major 27% chance of damaging wind over 30 yrs
- Air quality 3/10 Moderate 3 unhealthy d/yr today · 4 by 30 yrs out
Nearby sold comps map
Loading sold comps map…
Walkable amenities ~0.75 mi
Loading nearby amenities…
Taxation est. · year 1
- Rental income
- $22,629
- − Mortgage interest
- −$5,546
- − Property taxes
- −$1,529
- − Insurance
- −$495
- − Repairs & maintenance
- −$1,810
- − Management
- −$1,810
- − Depreciation
- −$2,880
- Taxable income
- $8,558
- Est. tax owed @ 24.0%
- −$2,054
- After-tax cash flow
- $7,569/yr
For passive investors: Depreciation is non-cash, so a rental often shows a tax loss while cash-flowing — sheltering income. Rental losses are passive: they offset passive income freely, and up to $25,000/yr can offset ordinary (W-2) income if you actively participate and your MAGI is under $100k (phasing out to $0 by $150k); unused losses carry forward. On sale, claimed depreciation is recaptured at up to 25%, and gains may owe capital-gains tax (a 1031 exchange can defer both). Figures are a year-1 estimate at your 24.0% rate — not tax advice; consult a CPA.
Schools (NCES district)
- District
- Baltimore City Public Schools
- NCES district ID
- 2400090
- Math proficiency
- 7% ▼ -9.00%
- Reading proficiency
- 16% ▼ -5.00%
- Median HH income
- $42,108
- Composite
- 10.08/100
- National rank
- #9805
- State rank
- #24 of 24 in MD
Livability — Baltimore
- Score
- 76/100
- State rank
- #90
- US rank
- #3396
Category grades
Schools grade is shown separately in the Schools card above.
Census & demographics
- Census place
- Baltimore, MD
- County
- Baltimore City · 558,601 people
- City population
- 588,727
- Metro
- Baltimore-Columbia-Towson, MD
- Population (ZIP)
- 52,229
- Household income
- $51,587
- Rent vs Own
- Severe rent burden
- 3644.0
Population outlook (Baltimore County) Hauer SSP2
- Today (2025)
- 624,249 people
- By 2030
- 621,541 · -0.4%
- By 2040
- 609,756 · -2.3%
- By 2050
- 597,249 · -4.3%
- By 2075
- 552,236 · -11.5%
- By 2100
- 513,934 · -17.7%
Race, ethnicity, and origin ACS 2023
- Neighborhood character
- Predominantly Black (73%)
- Race & ethnicity
- Black 73% White 17% Hispanic / Latino 5% Two or more races 4% Asian 1%
- Common ancestry
- Scotch-Irish 2% Romanian 2% Italian 1%
- Foreign-born
- 9% · Canada, South Korea
- Languages at home
- 91% English-only · Spanish 4% French/Haitian/Cajun 1% Other Indo-European 1%
Political lean MEDSL · Baltimore
- 2024 margin
- Solid D (+73.0) · D 85.2% · R 12.2% · Other 2.6%
- 2008→2024 swing
- -2.5pp toward R · 2008: 75.5pp · 2024: 73.0pp
- All cycles
- 2024: D+73.0 2020: D+76.6 2016: D+74.6 2012: D+76.4 2008: D+75.5
Not yet ingested
- Civics
- —
Market trends
- HPI YoY
- ▼ -318.58%
- Current HPI
- 291.4926
- Rent YoY
- ▲ 2.41%
- Metro
- Baltimore-Columbia-Towson, MD
- State GDP YoY
- ▲ 2.97%
- F500 in state
- 12
Industry mix (Fortune 500 HQ in MD)
| Industry | F500 HQs | Revenue |
|---|---|---|
| Aerospace / Defense | 1 | $71B |
|
||
| Utilities | 1 | $25B |
|
||
| Hotels | 1 | $24B |
|
||
| Consumer Goods | 1 | $7B |
|
||
| Real Estate | 1 | $6B |
|
||
| Chemicals | 1 | $2B |
|
||
Price history
+482.4% since first listed18 events — show timeline
- 2026-03-13 Listing Removed — BRIGHT MLS
- 2026-03-13 Listed $99,000 BRIGHT MLS
- 2026-01-09 Listed $114,900 BRIGHT MLS
- 2025-12-31 Listing Removed — BRIGHT MLS
- 2025-09-03 Listing Removed — BRIGHT MLS
- 2025-09-03 Listed $129,900 BRIGHT MLS
- 2025-08-22 Listed $129,900 BRIGHT MLS
- 2023-10-09 Listing Removed — BRIGHT MLS
- 2023-07-01 Listing Removed — BRIGHT MLS
- 2023-03-12 Relisted — BRIGHT MLS
- 2023-03-11 Relisted — BRIGHT MLS
- 2023-03-09 Pending — BRIGHT MLS
- 2023-03-09 Pending — BRIGHT MLS
- 2023-01-31 Listed $99,000 BRIGHT MLS
- 2023-01-31 Listed $99,000 BRIGHT MLS
- 2022-06-29 Sold (Public Records) $40,000 Public Records
- 1994-10-06 Sold (Public Records) $15,000 Public Records
- 1985-04-11 Sold (Public Records) $17,000 Public Records
Property tax history
+5.1%/yrLatest (2025): $1,529 · +30.9% YoY. Source: county tax records.
Cash-flow waterfall
monthlySold comps — $/sqft
last 12 mo · ≤1 miLoading sold comps…