2314 E 17th St · Cedar Grove, FL
Flood risk 1/10 · Minimal
- FEMA flood zone
- X (unshaded)
- Chance of flooding over 30 yrs
- 0.0%
- Est. flood insurance / yr
- $507 – $1,088
Fire risk 3/10 · Minor
- Est. fire insurance / yr
- $947 – $1,759
Heat risk 10/10 · Severe
- Hot days now (above 105°F)
- 6 days/yr
- Hot days in 30 yrs
- 17 days/yr
Wind risk 9/10 · Severe
- Chance of severe wind over 30 yrs
- 99.0%
Air-quality risk 1/10 · Minimal
- Unhealthy air days now
- 0 days/yr
- Unhealthy air days in 30 yrs
- 0 days/yr
Risk factors via First Street. Map © Google.
Why this score? — see what drove the B grade
The composite is a weighted blend of 9 inputs, each scored 0–100. Each bar is that input's sub-score; the figure is the points it added to the 100-point composite (weight × sub-score).
- Cash flow +30.0/30.0
- 1% rule +10.0/10.0
- DSCR +10.0/10.0
- ARV discount +7.5/15.0
- Schools +4.3/10.0
- Livability +3.5/5.0
- Rent growth +2.8/5.0
- Condition / age +2.5/5.0
- Appreciation +0.0/10.0
$85,000
🖨 Deal sheet 📄 Offer letter ✓ Due diligence
Listing remarks
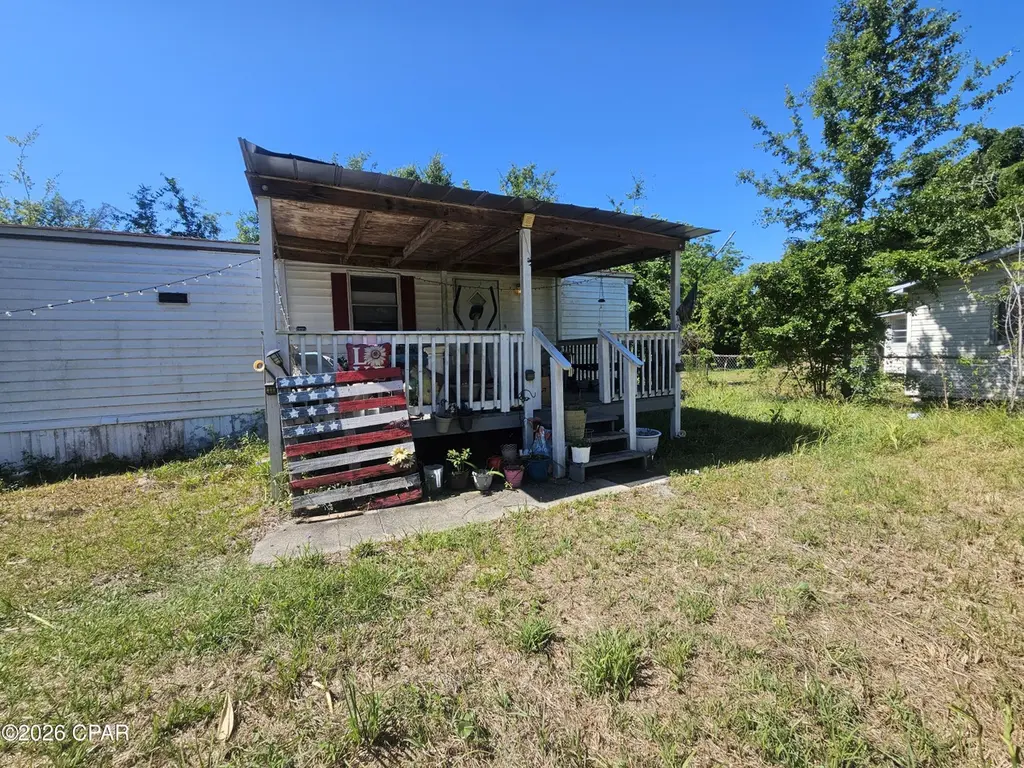
Discover a fantastic investment opportunity in Middle Panama City! This well-maintained singlewide trailer is nestled on a spacious lot, offering incredible rental potential. Whether you're looking to rent long-term or fix and flip, this property is perfectly positioned for consistent income. Just minutes from shopping, dining, and entertainment, this is an ideal location for a savvy buyer. Don't miss out--schedule your tour today!
Key facts
- Ideal location
- Spacious lot
- 9,888 sq ft lot
Tags
Property features AI
Finance
- Financial info: Lease in place through 2026-07-01
- HOA & community: Short-term rentals allowed
Exterior
- Parking: Unpaved parking; 1 covered parking space
- Utilities: Cable connected; Natural gas available; Underground utilities; Public sewer
- Home design: Single-wide mobile home; Entrance includes a covered porch; Zoned for city, mobile home, and single-family residential
- Construction: Vinyl siding; Shingle roof
- Exterior features: Partial fencing; Paved lot; City street frontage; Publicly maintained road
Interior
- Kitchen: Electric range
- Bedrooms: Two bedrooms on the first level (approx. 8.6 x 10 and 10.6 x 10)
- Bathrooms: One full bathroom
- Heating & cooling: Central heating; Central air conditioning
- Interior features: Covered front porch
Neighborhood map
What this means for you Summary
Snapshot
- This is a 2-bed/1.0-bath manufactured listed at $85k.
Deal economics
- At list price, monthly cash flow is $667 ($8k/yr) — positive.
- The deal already cash-flows at list — no discount required.
- Meets the 1% rule at list price ($2k rent vs $85k).
- Recommended offer: $84k (1.5% below list) — sets the bar for market timing.
Location & tenants
- Location reads 70/100 on livability (#445 in FL) — a middle-class / working-renter tenant base. Strengths: cost of living A+, housing A+, crime A; Watch: employment C-, schools F, amenities F.
- Bay (suburban): math 51% / reading 51% proficiency, ranked #29 of 73 in FL (top 40%) — acceptable for families but not a draw, mixed tenant base, ~2y average lease.
- Market conditions: Rents rising (+1.2%/yr); 381 active listings in the ZIP; 2 comparable units currently listed for rent nearby; 2,473 units permitted in Bay County in 2024 (559 in 5+ unit buildings).
Forward outlook
- Local home prices are declining (-3.0%/yr); year-one equity from $588 of loan paydown is wiped out by about $3k of value loss. Plan a longer hold.
- Bay County population projected at +24% by 2050 — long-run rental-demand tailwind backs the buy-and-hold thesis.
- At projected returns (-3.0% appreciation + 1.2% rent growth), your $24k cash investment doubles in ~4 years — after that, you're playing with house money.
Negotiation context
- It's been on market 22 days — a 2% lower offer ($84k) is reasonable based on typical stale-listing flexibility.
- 10 sale attempts since 21y ago with the ask held roughly flat each time — persistent listings suggest the price (not the market) is what's stuck; bring a comps-based counter.
- Current owner paid $61k; 40% above their basis — modest negotiation headroom, anchor on the comps not their cost.
Risks & watch-outs
- Climate carrying-cost: severe wind risk, 99% chance of damaging wind over 30y; extreme-heat days projected 6→17/yr by 2055 (HVAC capex compounding) — expect insurance premiums to compound above CPI over the hold.
Questions for the listing agent
- Is there a deadline driving the sale (1031 exchange, divorce, estate, relocation)? That informs how much negotiation room exists.
- Schools are F-rated, which usually means shorter tenancies and higher turnover. Who's the typical renter profile here, and what's been the actual vacancy rate?
- What's the average days-on-market for RENTAL listings here right now (not sales)? A rising rental-DOM trend means longer vacancies and softer asking-rent achievability than the comps imply.
- What's the recent tenant-quality profile in this submarket — average credit score on applications, eviction rate, late-payment / NSF rate, and stable-employment percentage? A property-management company in the area should have these aggregated.
- How much new for-sale + rental construction is in the pipeline within 1–3 miles? Heavy new supply typically softens prices + rents 12–24 months out; constrained supply supports both.
Investment metrics
- 1% rule
- 1.77% ✓
- Cap rate
- 15.71%
- Cash-on-cash
- 33.62%
- DSCR
- 2.50
- GRM
- 4.7
CMA / ARV
No comps found within radius.
Projected returns pro-forma
-3.0% appreciation · 1.24% rent growth · sell at horizon
- IRR
- 27.0%
- Equity multiple
- 2.09×
- Total profit
- $26,059
- Equity at exit
- $12,674
- IRR
- 33.5%
- Equity multiple
- 3.81×
- Total profit
- $66,942
- Equity at exit
- $7,349
Cash invested: $23,800 (down + closing). Projections, not guarantees.
Landlord ↔ Tenant lean methodology
- Overall (STATE)
- 87 Strongly Landlord-Friendly
- State Florida
- 87 Strongly Landlord-Friendly · R+3
- County
- — inherits STATE
- City
- — inherits STATE
ZIP-level market 32405
- Rents YoY
- 1.2%
- Active inventory
- 381
- Price-to-rent
- 4.7×
Monthly cashflow live
- Estimated rent
- $1,502 medium interval (Pro) →
- Mortgage (P&I)
- −$446
- Tax from tax record
- −$38 /mo · $462/yr
- Insurance
- −$35
- HOA
- −$0
- Vacancy / Maint / Mgmt
- −$315
- Net cashflow
- $667
Break-even live
UW: 25.0% down · 7.5% · 30yr · 1.5% tax · 5.0% vac · 8.0% maint · 8.0% mgmt
Financing live
Cash to close
- Down payment
- $21,250
- Closing costs
- $2,550
- Reserves months
- —
- Total cash needed
- —
Loan-product check · same deal, 3 products live
Conventional
25% down · 7.5% · 30yr
- Down + closing
- —
- Monthly P&I
- —
- Monthly cashflow
- —
- DSCR
- —
- Eligible?
- —
Personal DTI + credit; lowest rate.
DSCR
20% down · 8.5% · 30yr
- Down + closing
- —
- Monthly P&I
- —
- Monthly cashflow
- —
- DSCR
- —
- Eligible?
- —
No personal income docs; deal must DSCR.
Hard money
10% down · 12.0% · 12mo
- Down + closing
- —
- Monthly P&I
- —
- Monthly cashflow
- —
- DSCR
- —
- Eligible?
- —
Short-term bridge; refi at stabilization.
Rent comps 2 comps
| Address | Beds | Baths | Sqft | Rent | $/sqft | DOM | Units | Dist |
|---|---|---|---|---|---|---|---|---|
| 606 E 13th St Unit 1 Panama City, FL | 2.0 | 1.0 | 700 | $1,250 | $1.79 | 21d | 1 | 1.28mi |
| 2002 Wilson Ave Panama City, FL | 1.0–3.0 | 1.0–2.0 | 977 | $1,854 | $1.90 | 13d | 25 | 1.39mi |
Listing history 37 events
-
2026-06-19days on market $85,000 Active 22 DOM
-
2026-06-18days on market $85,000 Active 21 DOM
-
2026-06-17days on market $85,000 Active 20 DOM
-
2026-06-16days on market $85,000 Active 19 DOM
-
2026-06-15days on market $85,000 Active 18 DOM
-
2026-06-14days on market $85,000 Active 16 DOM
-
2026-06-13days on market $85,000 Active 15 DOM
-
2026-06-10days on market $85,000 Active 13 DOM
-
2026-06-09days on market $85,000 Active 12 DOM
-
2026-06-08days on market $85,000 Active 11 DOM
-
2026-06-07days on market $85,000 Active 10 DOM
-
2026-06-05days on market $85,000 Active 7 DOM
-
2026-06-03days on market $85,000 Active 6 DOM
-
2026-06-02days on market $85,000 Active 5 DOM
-
2026-06-01days on market $85,000 Active 4 DOM
-
2026-05-31days on market $85,000 Active 3 DOM
-
2026-05-30days on market $85,000 Active 2 DOM
-
2026-05-28$85,000 Active
-
2021-12-14historical
-
2021-12-14historical
-
2021-12-14historical
-
2021-12-14historical
-
2021-12-14historical
-
2021-12-14historical
-
2021-12-14historical
-
2021-12-09historical
-
2021-12-09historical
-
2010-07-13$52,000
-
2009-07-27$52,000
-
2008-12-19$34,900
-
2007-06-18$73,000
-
2006-09-14$73,000
-
2006-05-01$62,000
-
2005-11-14$62,000
-
2005-05-05$67,000
-
2005-05-05$67,000
-
2004-06-24soldstatus $60,800
ⓘ Source: listings_history table (triggers on properties + properties_extension) + one-shot
backfill from property_details.listing_events for pre-trigger history.
Tax reassessment forecast FL · Resets to sale price
- Current annual tax
- $462 · $38/mo
- Projected year-2 tax
- $706 · $59/mo
- Expected delta
- +$244/yr (+$20/mo · 52.8%)
ⓘ Screening estimate from a state-policy table — verify with the county assessor before closing.
Climate risk First Street
- Flood 1/10 Low FEMA zone X (unshaded) · 0% chance over 30 yrs
- Wildfire 3/10 Moderate
- Heat 10/10 Extreme 6 d/yr ≥105°F today · 17 d/yr by 30 yrs out
- Wind 9/10 Extreme 99% chance of damaging wind over 30 yrs
- Air quality 1/10 Low 0 unhealthy d/yr today · 0 by 30 yrs out
Nearby sold comps map
Loading sold comps map…
Walkable amenities ~0.75 mi
Loading nearby amenities…
Taxation est. · year 1
- Rental income
- $18,021
- − Mortgage interest
- −$4,761
- − Property taxes
- −$462
- − Insurance
- −$425
- − Repairs & maintenance
- −$1,442
- − Management
- −$1,442
- − Depreciation
- −$2,473
- Taxable income
- $7,017
- Est. tax owed @ 24.0%
- −$1,684
- After-tax cash flow
- $6,317/yr
For passive investors: Depreciation is non-cash, so a rental often shows a tax loss while cash-flowing — sheltering income. Rental losses are passive: they offset passive income freely, and up to $25,000/yr can offset ordinary (W-2) income if you actively participate and your MAGI is under $100k (phasing out to $0 by $150k); unused losses carry forward. On sale, claimed depreciation is recaptured at up to 25%, and gains may owe capital-gains tax (a 1031 exchange can defer both). Figures are a year-1 estimate at your 24.0% rate — not tax advice; consult a CPA.
Schools (NCES district)
- District
- Bay
- NCES district ID
- 1200090
- Math proficiency
- 51% ▼ -8.00%
- Reading proficiency
- 51% ▼ -7.00%
- Median HH income
- $47,740
- Composite
- 43.41/100
- National rank
- #3014
- State rank
- #29 of 73 in FL
Livability — Cedar Grove
- Score
- 70/100
- State rank
- #445
- US rank
- #8018
Category grades
Schools grade is shown separately in the Schools card above.
Census & demographics
- Census place
- Cedar Grove, FL
- County
- Bay County · 163,593 people
- Metro
- Panama City, FL
- Population (ZIP)
- 29,984
- Household income
- $73,373
- Rent vs Own
- Severe rent burden
- 1008.0
Population outlook (Bay County) Hauer SSP2
- Today (2025)
- 206,264 people
- By 2030
- 217,740 · +5.6%
- By 2040
- 238,738 · +15.7%
- By 2050
- 255,545 · +23.9%
- By 2075
- 288,295 · +39.8%
- By 2100
- 288,638 · +39.9%
Race, ethnicity, and origin ACS 2023
- Neighborhood character
- Predominantly White (67%)
- Race & ethnicity
- White 67% Black 17% Two or more races 8% Hispanic / Latino 7% Native American 1%
- Hispanic origin (detail)
- Mexican 2% Puerto Rican 3%
- Common ancestry
- Slovak 4% Lithuanian 2% Romanian 2%
- Foreign-born
- 7% · Canada
- Languages at home
- 89% English-only · Spanish 6% Arabic 1% French/Haitian/Cajun 1%
Political lean MEDSL · Bay
- 2024 margin
- Solid R (+47.4) · D 25.8% · R 73.1% · Other 1.1%
- 2008→2024 swing
- -6.6pp toward R · 2008: -40.7pp · 2024: -47.4pp
- All cycles
- 2024: R+47.4 2020: R+43.5 2016: R+46.3 2012: R+43.6 2008: R+40.7
Not yet ingested
- Civics
- —
Market trends
- HPI YoY
- ▼ -217.88%
- Current HPI
- 262.7854
- Rent YoY
- ▲ 1.24%
- Metro
- Panama City, FL
- State GDP YoY
- ▲ 3.28%
- F500 in state
- 36
Industry mix (Fortune 500 HQ in FL)
| Industry | F500 HQs | Revenue |
|---|---|---|
| Industrial Technology | 2 | $29B |
|
||
| Insurance | 2 | $17B |
|
||
| Retail | 1 | $60B |
|
||
| Technology Distribution | 1 | $58B |
|
||
| Homebuilding | 1 | $35B |
|
||
| Technology Manufacturing | 1 | $35B |
|
||
Price history
+39.8% since first listed20 events — show timeline
- 2026-05-28 Listed $85,000 CPARMLS
- 2021-12-14 Listing Removed — CPARMLS
- 2021-12-14 Listing Removed — CPARMLS
- 2021-12-14 Listing Removed — CPARMLS
- 2021-12-14 Listing Removed — CPARMLS
- 2021-12-14 Listing Removed — CPARMLS
- 2021-12-14 Listing Removed — CPARMLS
- 2021-12-14 Listing Removed — CPARMLS
- 2021-12-09 Listing Removed — CPARMLS
- 2021-12-09 Listing Removed — CPARMLS
- 2010-07-13 Listed $52,000 CPARMLS
- 2009-07-27 Listed $52,000 CPARMLS
- 2008-12-19 Listed $34,900 CPARMLS
- 2007-06-18 Listed $73,000 CPARMLS
- 2006-09-14 Listed $73,000 CPARMLS
- 2006-05-01 Listed $62,000 CPARMLS
- 2005-11-14 Listed $62,000 CPARMLS
- 2005-05-05 Listed $67,000 CPARMLS
- 2005-05-05 Listed $67,000 CPARMLS
- 2004-06-24 Sold (Public Records) $60,800 Public Records
Property tax history
+3.2%/yrLatest (2025): $462 · +14.9% YoY. Source: county tax records.
Cash-flow waterfall
monthlySold comps — $/sqft
last 12 mo · ≤1 miLoading sold comps…