 🏗️ New Construction
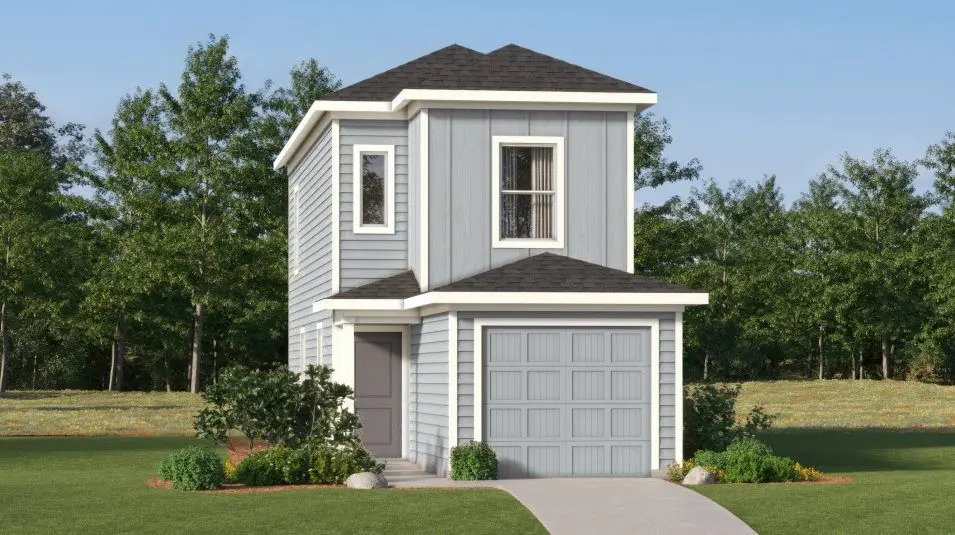
Kofa Plan · Houston, TX
Flood risk No data
- FEMA flood zone
- —
- Chance of flooding over 30 yrs
- —
- Est. flood insurance / yr
- —
Fire risk No data
- Est. fire insurance / yr
- —
Heat risk No data
- Hot days now (above threshold)
- —
- Hot days in 30 yrs
- —
Wind risk No data
- Chance of severe wind over 30 yrs
- —
Air-quality risk No data
- Unhealthy air days now
- —
- Unhealthy air days in 30 yrs
- —
Risk factors via First Street. Map © Google.
Why this score? — see what drove the D- grade
The composite is a weighted blend of 9 inputs, each scored 0–100. Each bar is that input's sub-score; the figure is the points it added to the 100-point composite (weight × sub-score).
- Cash flow +10.6/30.0
- ARV discount +7.5/15.0
- Condition / age +4.0/5.0
- Livability +3.7/5.0
- Schools +3.5/10.0
- 1% rule +3.1/10.0
- DSCR +3.0/10.0
- Rent growth +2.9/5.0
- Appreciation +0.0/10.0
$179,990
🖨 Deal sheet 📄 Offer letter ✓ Due diligence
Listing remarks MLS
The first floor of this two-story home opens into a shared living space between the kitchen and family room for easy entertaining, along with a convenient powder room. An owner's suite sprawls across the rear of the second floor and is comprised of an en-suite bathroom and walk-in closet. A versatile secondary bedroom and full-sized bathroom are also upstairs, ideal for household members or overnight guests.
Key facts
- Green space
- Low hoa fees
- Single family homes
Tags
Neighborhood map
What this means for you Summary
Snapshot
- This is a 2-bed/2.5-bath single-family listed at $180k. Condition is rated good.
Deal economics
- At list price, monthly cash flow is $-118 ($-1k/yr) — negative.
- The deal already cash-flows at list — no discount required.
- Meets the 1% rule at list price ($2k rent vs $180k).
- Recommended offer: $158k (12.0% below list) — sets the bar for market timing.
- Cap rate 5.7% vs local median 3.2% in Houston — top-decile yield for the area; either an underpriced asset or a hidden risk that comps aren't pricing in. Stress-test before assuming the spread holds.
Location & tenants
- Location reads 74/100 on livability (#184 in TX, #4,771 nationally) — a middle-class / working-renter tenant base. Strengths: amenities A+, cost of living A+, housing A+; Watch: schools D, crime F.
- Crosby ISD (rural): math 39% / reading 40% proficiency, ranked #369 of 826 in TX (top 45%) — families likely to look elsewhere, expect single-tenant / working-renter base with shorter leases.
- Market conditions: Rents rising (+1.5%/yr); 1172 active listings in the ZIP; 2 comparable units currently listed for rent nearby; solid renter incomes; 29,883 units permitted in Harris County in 2024 (8,621 in 5+ unit buildings).
Forward outlook
- Local home prices are declining (-3.0%/yr); year-one equity from $2k of loan paydown is wiped out by about $7k of value loss. Plan a longer hold.
- Harris County population projected at +47% by 2050 — long-run rental-demand tailwind backs the buy-and-hold thesis.
Negotiation context
- It's been on market 262 days — a 12% lower offer ($158k) is reasonable based on typical stale-listing flexibility.
Questions for the listing agent
- What do current leases actually rent for vs. the listed asking? Can we see a recent rent roll and the last 12 months of T-12 income?
- It's been on market 262 days. Have you received any prior offers? Is the seller open to a 12% concession, seller financing, or rate buy-down credit?
- Why hasn't it sold? Are there any deal-killer items the seller is aware of (foundation, flood, title, zoning, code violations)?
- Is there a deadline driving the sale (1031 exchange, divorce, estate, relocation)? That informs how much negotiation room exists.
- Schools are D-rated, which usually means shorter tenancies and higher turnover. Who's the typical renter profile here, and what's been the actual vacancy rate?
- Crime grade is F in this area — have there been break-ins, vandalism, or insurance claims at this property in the last 3 years? What carrier currently insures it and at what premium?
- The area grade is low — what's the realistic commute time and amenity access for the typical tenant pool here? Any planned neighborhood developments (good or bad) we should know about?
- What's the average days-on-market for RENTAL listings here right now (not sales)? A rising rental-DOM trend means longer vacancies and softer asking-rent achievability than the comps imply.
- What's the recent tenant-quality profile in this submarket — average credit score on applications, eviction rate, late-payment / NSF rate, and stable-employment percentage? A property-management company in the area should have these aggregated.
- How much new for-sale + rental construction is in the pipeline within 1–3 miles? Heavy new supply typically softens prices + rents 12–24 months out; constrained supply supports both.
Investment metrics
- 1% rule
- 0.81% ✗
- Cap rate
- 5.69%
- Cash-on-cash
- -2.15%
- DSCR
- 0.90
- GRM
- 10.3
CMA / ARV
- ARV (median comp)
- $235,621
- List price
- $179,990
- Delta
- -23.61%
- Verdict
- UNDERPRICED
- Comps
- 20 within 1.0 mi
Show comp detail 8 sales within ~0.75 mi
| Address | Dist | Beds/Ba | Sqft | Sold | Price | $/sf | Match |
|---|---|---|---|---|---|---|---|
| 20162 Green Mallard St | 0.01mi | 2/2.0 | 1,013 (0%) | 3mo | $181,990 | $180 | 95 |
| 20171 Green Mallard St | 0.01mi | 2/2.0 | 1,013 (0%) | 4mo | $181,990 | $180 | 94 |
| 20178 Green Mallard St | 0.01mi | 2/2.0 | 1,013 (0%) | 4mo | $181,990 | $180 | 94 |
| 20123 Green Mallard St | 0.40mi | 2/2.5 | 1,013 (0%) | 1mo | $125,241 | $124 | 81 |
| 20155 Green Mallard St | 0.37mi | 2/2.0 | 1,013 (0%) | 2mo | $181,990 | $180 | 79 |
| 20146 Green Mallard St | 0.37mi | 2/2.0 | 1,013 (0%) | 2mo | $181,990 | $180 | 79 |
| 20139 Green Mallard St | 0.38mi | 2/2.0 | 1,013 (0%) | 2mo | $181,990 | $180 | 78 |
| 1103 Silver Moon Trl | 0.64mi | 2/1.0 | 1,071 (+6%) | 21mo | $137,900 | $129 | 37 |
Match score weights: distance 35% · size 25% · config 20% · recency 20%. Top-matched comps best support the ARV.
Projected returns pro-forma
-3.0% appreciation · 1.48% rent growth · sell at horizon
- IRR
- -21.6%
- Equity multiple
- 0.26×
- Total profit
- $-48,567
- Equity at exit
- $35,132
- IRR
- -19.3%
- Equity multiple
- 0.04×
- Total profit
- $-63,338
- Equity at exit
- $20,372
Cash invested: $65,974 (down + closing). Projections, not guarantees.
Landlord ↔ Tenant lean methodology
- Overall (STATE)
- 87 Strongly Landlord-Friendly
- State Texas
- 87 Strongly Landlord-Friendly · R+5
- County
- — inherits STATE
- City
- — inherits STATE
ZIP-level market 77532
- Home prices YoY
- -28.6%
- Rents YoY
- 1.5%
- Active inventory
- 1172
- Price-to-rent
- 7.8×
Monthly cashflow live
- Estimated rent
- $1,911 medium interval (Pro) →
- Mortgage (P&I)
- −$1,236
- Tax est. 1.5%
- −$295 /mo · $3,534/yr
- Insurance
- −$98
- HOA
- −$0
- Vacancy / Maint / Mgmt
- −$401
- Net cashflow
- $-118
Break-even live
UW: 25.0% down · 7.5% · 30yr · 1.5% tax · 5.0% vac · 8.0% maint · 8.0% mgmt
Financing live
Cash to close
- Down payment
- $58,905
- Closing costs
- $7,069
- Reserves months
- —
- Total cash needed
- —
Loan-product check · same deal, 3 products live
Conventional
25% down · 7.5% · 30yr
- Down + closing
- —
- Monthly P&I
- —
- Monthly cashflow
- —
- DSCR
- —
- Eligible?
- —
Personal DTI + credit; lowest rate.
DSCR
20% down · 8.5% · 30yr
- Down + closing
- —
- Monthly P&I
- —
- Monthly cashflow
- —
- DSCR
- —
- Eligible?
- —
No personal income docs; deal must DSCR.
Hard money
10% down · 12.0% · 12mo
- Down + closing
- —
- Monthly P&I
- —
- Monthly cashflow
- —
- DSCR
- —
- Eligible?
- —
Short-term bridge; refi at stabilization.
Rent comps 2 comps
| Address | Beds | Baths | Sqft | Rent | $/sqft | DOM | Units | Dist |
|---|---|---|---|---|---|---|---|---|
| 20119 Iron Winds St Crosby, TX | 3.0 | 2.0 | 1418 | $1,875 | $1.32 | 13d | 1 | 0.20mi |
| 20034 White Dove Dr Crosby, TX | 3.0 | 2.0 | 1273 | $1,850 | $1.45 | 13d | 1 | 0.49mi |
Listing history 13 events
-
2026-06-18days on market $179,990 Active 262 DOM
-
2026-06-17days on market $179,990 Active 261 DOM
-
2026-06-16days on market $179,990 Active 260 DOM
-
2026-06-15days on market $179,990 Active 259 DOM
-
2026-06-13days on market $179,990 Active 257 DOM
-
2026-06-09days on market $179,990 Active 253 DOM
-
2026-06-08days on market $179,990 Active 252 DOM
-
2026-06-07days on market $179,990 Active 251 DOM
-
2026-06-04days on market $179,990 Active 248 DOM
-
2026-06-02days on market $179,990 Active 246 DOM
-
2026-06-01days on market $179,990 Active 245 DOM
-
2026-05-31days on market $179,990 Active 244 DOM
-
2025-09-29$179,990 Active 411-char remark
Show marketing remark (411 chars)
The first floor of this two-story home opens into a shared living space between the kitchen and family room for easy entertaining, along with a convenient powder room. An owner's suite sprawls across the rear of the second floor and is comprised of an en-suite bathroom and walk-in closet. A versatile secondary bedroom and full-sized bathroom are also upstairs, ideal for household members or overnight guests.
ⓘ Source: listings_history table (triggers on properties + properties_extension) + one-shot
backfill from property_details.listing_events for pre-trigger history.
Nearby sold comps map
Loading sold comps map…
Walkable amenities ~0.75 mi
Loading nearby amenities…
Taxation est. · year 1
- Rental income
- $22,937
- − Mortgage interest
- −$13,198
- − Property taxes
- −$3,534
- − Insurance
- −$1,178
- − Repairs & maintenance
- −$1,835
- − Management
- −$1,835
- − Depreciation
- −$6,854
- Taxable loss
- −$5,498
- Est. tax savings @ 24.0%
- +$1,320
- After-tax cash flow
- $-100/yr
For passive investors: Depreciation is non-cash, so a rental often shows a tax loss while cash-flowing — sheltering income. Rental losses are passive: they offset passive income freely, and up to $25,000/yr can offset ordinary (W-2) income if you actively participate and your MAGI is under $100k (phasing out to $0 by $150k); unused losses carry forward. On sale, claimed depreciation is recaptured at up to 25%, and gains may owe capital-gains tax (a 1031 exchange can defer both). Figures are a year-1 estimate at your 24.0% rate — not tax advice; consult a CPA.
Condition & rehab AI · 12 photos
This two-story home is in good condition with modern finishes and a well-maintained exterior. It offers a good balance of functionality and aesthetics, making it a solid investment.
Value-add opportunities
- Both Painting exterior and interior walls — Enhances curb appeal and interior aesthetics
- Both Landscaping improvements — Enhances curb appeal and adds value
- Both New flooring in bathrooms — Improves functionality and aesthetics
- Both New kitchen appliances — Modernizes the space and adds value
Renovation cost estimate screening
Value-add ROI direction
- Both Painting exterior and interior walls — Enhances curb appeal and interior aesthetics ↑
- Both Landscaping improvements — Enhances curb appeal and adds value ↑
- Both New flooring in bathrooms — Improves functionality and aesthetics ↑
- Both New kitchen appliances — Modernizes the space and adds value ↑
ⓘ Cost ranges are severity-bucket heuristics (US national rule-of-thumb). Get contractor quotes + a written scope before underwriting a rehab budget.
Schools (NCES district)
- District
- Crosby ISD
- NCES district ID
- 4815750
- Math proficiency
- 39% ▼ -13.00%
- Reading proficiency
- 40% ▼ -5.00%
- Median HH income
- $61,079
- Composite
- 35.14/100
- National rank
- #5012
- State rank
- #369 of 826 in TX
Livability — Houston
- Score
- 74/100
- State rank
- #184
- US rank
- #4771
Category grades
Schools grade is shown separately in the Schools card above.
Census & demographics
- County
- Harris County · 4,702,590 people
- City population
- 3,226,434
- Metro
- Houston-The Woodlands-Sugar Land, TX
- Population (ZIP)
- 33,780
- Household income
- $92,201
- Rent vs Own
- Severe rent burden
- 382.0
Population outlook (Harris County) Hauer SSP2
- Today (2025)
- 5,571,493 people
- By 2030
- 6,089,821 · +9.3%
- By 2040
- 7,142,806 · +28.2%
- By 2050
- 8,185,864 · +46.9%
- By 2075
- 10,574,329 · +89.8%
- By 2100
- 12,109,958 · +117.4%
Race, ethnicity, and origin ACS 2023
- Neighborhood character
- Diverse neighborhood (Simpson 0.60)
- Race & ethnicity
- White 54% Hispanic / Latino 31% Two or more races 16% Black 9%
- Hispanic origin (detail)
- Mexican 24%
- Common ancestry
- Lithuanian 4% Romanian 3% Italian 2%
- Foreign-born
- 10% · Canada
- Languages at home
- 78% English-only · Spanish 21%
Political lean MEDSL · Harris
- 2024 margin
- Lean D (+5.5) · D 52.0% · R 46.4% · Other 1.6%
- 2008→2024 swing
- +3.9pp toward D · 2008: 1.6pp · 2024: 5.5pp
- All cycles
- 2024: D+5.5 2020: D+13.3 2016: D+12.4 2012: D+0.1 2008: D+1.6
Not yet ingested
- Civics
- —
Market trends
- HPI YoY
- ▼ -105.63%
- Current HPI
- 264.0126
- Rent YoY
- ▲ 1.48%
- Metro
- Houston-The Woodlands-Sugar Land, TX
- State GDP YoY
- ▲ 3.95%
- F500 in state
- 110
Industry mix (Fortune 500 HQ in TX)
| Industry | F500 HQs | Revenue |
|---|---|---|
| Energy | 16 | $1,198B |
|
||
| Technology | 5 | $198B |
|
||
| Engineering / Construction | 4 | $72B |
|
||
| Energy Services | 3 | $60B |
|
||
| Utilities | 3 | $41B |
|
||
| Healthcare | 2 | $330B |
|
||
Price history
1 event — show timeline
- 2025-09-29 Listed $179,990 Zillow
Cash-flow waterfall
monthlySold comps — $/sqft
last 12 mo · ≤1 miLoading sold comps…