 Multi-family
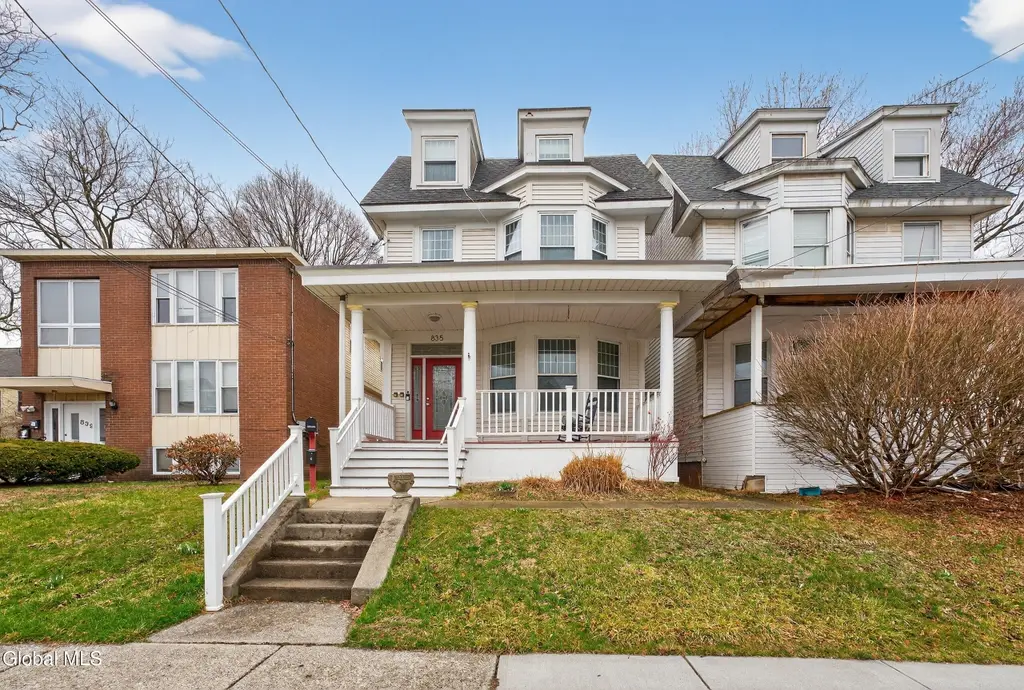
835 Lancaster St · Albany, NY
Flood risk 1/10 · Minimal
- FEMA flood zone
- X (unshaded)
- Chance of flooding over 30 yrs
- 0.0%
- Est. flood insurance / yr
- $473 – $860
Fire risk 1/10 · Minimal
- Est. fire insurance / yr
- $691 – $1,283
Heat risk 4/10 · Minor
- Hot days now (above 97°F)
- 7 days/yr
- Hot days in 30 yrs
- 16 days/yr
Wind risk 3/10 · Minor
- Chance of severe wind over 30 yrs
- 6.0%
Air-quality risk 1/10 · Minimal
- Unhealthy air days now
- 0 days/yr
- Unhealthy air days in 30 yrs
- 0 days/yr
Risk factors via First Street. Map © Google.
Why this score? — see what drove the B grade
The composite is a weighted blend of 9 inputs, each scored 0–100. Each bar is that input's sub-score; the figure is the points it added to the 100-point composite (weight × sub-score).
- Cash flow +30.0/30.0
- 1% rule +10.0/10.0
- DSCR +10.0/10.0
- ARV discount +7.5/15.0
- Livability +4.0/5.0
- Schools +3.2/10.0
- Rent growth +3.0/5.0
- Condition / age +2.5/5.0
- Appreciation +0.0/10.0
$399,900
🖨 Deal sheet (PDF) 📄 Offer letter ✓ Due diligence
Multi-family units
County records classify this as Multi-Family (2-4 Unit). Listing-text estimate: 1 unit. estimate disagrees with records
Listing remarks MLS
No more showings. Multiple offers. Highest & best by 10/1 at 5PM. Pristine, turn key, two family in Pine Hills on HUGE triple lot with TONS of off street parking & two car garage! Everything has been redone in the past 17 years including: roof, windows, siding, electrical, two story trex deck, privacy fence, kitchen, bathrooms, etc. AC has been added as well as a security system & outdoor lighting (motion sensor). Gorgeous hardwood floors & tile in the 3 bathrooms! Sale includes lots at 846 & 848 Chestnut. Showings begin Sunday at 12PM. Excellent Condition
Key facts
- Cozy 1st floor unit
- Separate utilities
- Updated bath
Tags
Neighborhood map
What this means for you Summary
Snapshot
- This is a 3-bed/2.0-bath multifamily listed at $400k.
Deal economics
- At list price, monthly cash flow is $3k ($34k/yr) — positive.
- The deal already cash-flows at list — no discount required.
- Meets the 1% rule at list price ($7k rent vs $400k).
- Cap rate 14.7% vs local median 5.7% in Albany — top-decile yield for the area; either an underpriced asset or a hidden risk that comps aren't pricing in. Stress-test before assuming the spread holds.
Location & tenants
- Location reads 79/100 on livability (#129 in NY, #2,083 nationally) — a middle-class / working-renter tenant base. Strengths: amenities A+, commute A+, housing A+; Watch: employment C-, crime F.
- Albany City School District (urban): math 37% / reading 40% proficiency, ranked #543 of 590 in NY (top 92%) — families likely to look elsewhere, expect single-tenant / working-renter base with shorter leases; 66% free/reduced lunch — lower-income household profile, screen leases tightly.
- Zoned schools: Albany High School (math 74% / reading 67%, grade B+, #710 of 1,100 statewide, top 65%, 2,676 students, 69% FRL) — zoned schools at 69% FRL track the district average.
- Zoned-school proficiency averages 70% at this address vs 38% district-wide (+32 pts) — the actual schools serving this property are materially stronger than the Albany City School District average implies; a family-tenant draw the district grade alone would hide.
- Market conditions: Rents rising (+1.9%/yr); 127 active listings in the ZIP; 24 comparable units currently listed for rent nearby; rentals at typical pace (median 25d on market — plan ~3-4 weeks tenant-placement turnaround); 46% of comp listings sitting > 30 days — soft ceiling on asking rent; solid renter incomes; 675 units permitted in Albany County in 2024 (451 in 5+ unit buildings).
- At $7,032/mo this rent would consume 101% of the median local household income ($83k/yr) (locally 1704% of renters already pay >50% of income on rent) — very limited rent-growth headroom before tenants either downsize or default.
Forward outlook
- Local home prices are declining (-3.0%/yr); year-one equity from $3k of loan paydown is wiped out by about $12k of value loss. Plan a longer hold.
- Albany County population projected at +9% by 2050 — modest demand growth; plan on rents tracking national, not racing it.
- At projected returns (-3.0% appreciation + 1.9% rent growth), your $112k cash investment doubles in ~5 years — after that, you're playing with house money.
Negotiation context
- Only 3 days on market — expect competitive offers; lowballing is unlikely to land.
- 2 sale attempts since 7y ago with the ask held roughly flat each time — persistent listings suggest the price (not the market) is what's stuck; bring a comps-based counter.
- Current owner paid $275k; 45% above their basis — modest negotiation headroom, anchor on the comps not their cost.
Risks & watch-outs
- Watch-outs: built in 1920 — expect roof / HVAC / electrical / plumbing capex.
Questions for the listing agent
- Built in 1920 — when were the roof, HVAC, electrical panel, plumbing, and water heater last replaced?
- Is there a deadline driving the sale (1031 exchange, divorce, estate, relocation)? That informs how much negotiation room exists.
- Crime grade is F in this area — have there been break-ins, vandalism, or insurance claims at this property in the last 3 years? What carrier currently insures it and at what premium?
- What's the average days-on-market for RENTAL listings here right now (not sales)? A rising rental-DOM trend means longer vacancies and softer asking-rent achievability than the comps imply.
- What's the recent tenant-quality profile in this submarket — average credit score on applications, eviction rate, late-payment / NSF rate, and stable-employment percentage? A property-management company in the area should have these aggregated.
- How much new apartment / multifamily construction is in the pipeline within 1–3 miles? Heavy new supply (>2% of stock underway) typically softens rents 12–24 months out; light construction supports rent growth.
Investment metrics
- 1% rule
- 1.76% ✓
- Cap rate
- 14.73%
- Cash-on-cash
- 30.12%
- DSCR
- 2.34
- GRM
- 4.7
CMA / ARV
- ARV (on-the-fly)
- $251,136
- Comps found
- 12
Show comp detail 12 sales within ~0.75 mi
| Address | Dist | Beds/Ba | Sqft | Sold | Price | $/sf | Match |
|---|---|---|---|---|---|---|---|
| 338 Manning Blvd | 0.23mi | 3/2.0 | 1,680 (-14%) | 9mo | $242,500 | $144 | 57 |
| 455 Bradford St | 0.41mi | 4/2.0 (+1) | 1,800 (-8%) | 8mo | $230,000 | $128 | 56 |
| 596 3rd St | 0.71mi | 4/2.0 (+1) | 1,920 (-2%) | 4mo | $150,000 | $78 | 55 |
| 33 Lincoln Ave | 0.32mi | 4/2.0 (+1) | 1,785 (-9%) | 14mo | $215,000 | $120 | 53 |
| 523 Central Ave | 0.55mi | 4/4.0 (+1) | 2,016 (+3%) | 11mo | $289,000 | $143 | 48 |
| 685 Myrtle Ave | 0.64mi | 4/2.0 (+1) | 2,128 (+8%) | 6mo | $310,000 | $146 | 47 |
| 598-600 3rd St | 0.71mi | 4/2.0 (+1) | 1,920 (-2%) | 15mo | $245,000 | $128 | 46 |
| 34 Garfield Pl | 0.60mi | 4/2.0 (+1) | 1,840 (-6%) | 16mo | $80,000 | $43 | 43 |
| 162 S Allen St | 0.64mi | 4/2.0 (+1) | 1,828 (-7%) | 18mo | $280,000 | $153 | 38 |
| 627 3rd St | 0.70mi | 4/2.0 (+1) | 2,200 (+12%) | 5mo | $225,000 | $102 | 38 |
| 605 3rd St | 0.72mi | 4/2.0 (+1) | 1,792 (-9%) | 14mo | $152,000 | $85 | 35 |
| 584-586 Central Ave | 0.45mi | 3/4.0 | 2,240 (+14%) | 15mo | $225,000 | $100 | 35 |
Match score weights: distance 35% · size 25% · config 20% · recency 20%. Top-matched comps best support the ARV.
Projected returns pro-forma
-3.0% appreciation · 1.85% rent growth · sell at horizon
- IRR
- 23.4%
- Equity multiple
- 1.95×
- Total profit
- $106,260
- Equity at exit
- $59,626
- IRR
- 30.6%
- Equity multiple
- 3.60×
- Total profit
- $291,163
- Equity at exit
- $34,576
Cash invested: $111,972 (down + closing). Projections, not guarantees.
Landlord ↔ Tenant lean methodology
- Overall (STATE)
- 15 Strongly Tenant-Friendly
- State New York
- 15 Strongly Tenant-Friendly · D+10
- County
- — inherits STATE
- City
- — inherits STATE
ZIP-level market 12203
- Home prices YoY
- -31.0%
- Rents YoY
- 1.9%
- Active inventory
- 127
- Price-to-rent
- 22.6×
Monthly cashflow live
- Estimated rent
- $7,032 medium interval (Pro) →
- Mortgage (P&I)
- −$2,097
- Tax from tax record
- −$481 /mo · $5,771/yr
- Insurance
- −$167
- HOA
- −$0
- Vacancy / Maint / Mgmt
- −$1,477
- Net cashflow
- $2,811
Break-even live
Sensitivity live
| Price | -10% $3,037 | -5% $2,924 | +0% $2,811 | +5% $2,697 | +10% $2,584 |
|---|---|---|---|---|---|
| Rent | -10% $2,255 | -5% $2,533 | +0% $2,811 | +5% $3,088 | +10% $3,366 |
| Rate | -1.0pp $3,012 | -0.5pp $2,912 | base $2,811 | +0.5pp $2,707 | +1.0pp $2,602 |
4-unit breakdown (identical units grouped — click to expand)
| Units | Beds | Baths | Est. rent |
|---|---|---|---|
| 1× unit | 2 | 1 | $1,477 |
| 3× units | 3 | 1.5 | $5,553 |
| #2 | 3 | 1.5 | $1,851 |
| #3 | 3 | 1.5 | $1,851 |
| #4 | 3 | 1.5 | $1,851 |
| Total (4 units) | $7,032 | ||
UW: 25.0% down · 7.5% · 30yr · 1.5% tax · 5.0% vac · 8.0% maint · 8.0% mgmt
Financing live
Cash to close
- Down payment
- $99,975
- Closing costs
- $11,997
- Reserves months
- —
- Total cash needed
- —
Loan-product check · same deal, 3 products live
Conventional
25% down · 7.5% · 30yr
- Down + closing
- —
- Monthly P&I
- —
- Monthly cashflow
- —
- DSCR
- —
- Eligible?
- —
Personal DTI + credit; lowest rate.
DSCR
20% down · 8.5% · 30yr
- Down + closing
- —
- Monthly P&I
- —
- Monthly cashflow
- —
- DSCR
- —
- Eligible?
- —
No personal income docs; deal must DSCR.
Hard money
10% down · 12.0% · 12mo
- Down + closing
- —
- Monthly P&I
- —
- Monthly cashflow
- —
- DSCR
- —
- Eligible?
- —
Short-term bridge; refi at stabilization.
Rent comps 24 comps
| Address | Beds | Baths | Sqft | Rent | $/sqft | DOM | Units | Dist |
|---|---|---|---|---|---|---|---|---|
| 135 Winthrop Ave Albany, NY | 3.0 | 2.0 | 1788 | $3,500 | $1.96 | 45d | 1 | 0.30mi |
| 78 S Pine Ave Unit 2 Albany, NY | 3.0 | 1.5 | 1541 | $2,350 | $1.52 | 16d | 1 | 0.44mi |
| 602 Morris St Albany, NY | 3.0 | 1.0 | 1270 | $1,850 | $1.46 | 16d | 1 | 0.48mi |
| 569 Washington Ave Unit 1st Floor Albany, NY | 4.0 | 1.0 | 1275 | $2,000 | $1.57 | 45d | 1 | 0.60mi |
| 104 S Main Ave Unit 1 Albany, NY | 3.0 | 1.0 | 1300 | $2,600 | $2.00 | 45d | 1 | 0.64mi |
| 32 Peyster St Unit 2nd Albany, NY | 3.0 | 2.0 | 1500 | $2,300 | $1.53 | 45d | 1 | 0.64mi |
| 154 Spring St Albany, NY | 3.0 | 1.0 | 2500 | $1,695 | $0.68 | 45d | 1 | 0.72mi |
| 363 Ontario St Albany, NY | 1.0–2.0 | 1.0–2.5 | 1610 | $3,485 | $2.16 | 16d | 1 | 0.76mi |
| 257 Quail St Albany, NY | 4.0 | 2.5 | 2208 | $2,800 | $1.27 | 45d | 1 | 0.79mi |
| 58 Elberon Pl Apt 2 Albany, NY | 4.0 | 1.0 | 1250 | $2,200 | $1.76 | 45d | 1 | 0.80mi |
| 726 Western Ave Albany, NY | 4.0 | 2.5 | 1900 | $2,800 | $1.47 | 45d | 1 | 0.81mi |
| 178 Western Ave Unit 3 Albany, NY | 3.0 | 1.0 | 1500 | $1,725 | $1.15 | 16d | 1 | 0.85mi |
| 38 W Erie St Albany, NY | 4.0 | 2.0 | 1440 | $2,800 | $1.94 | 25d | 1 | 0.88mi |
| 147 Western Ave Albany, NY | 3.0 | 1.0 | 1428 | $1,800 | $1.26 | 16d | 1 | 0.92mi |
| 830 Western Ave Albany, NY | 4.0 | 2.5 | 1600 | $2,700 | $1.69 | 16d | 1 | 0.92mi |
| 546 Mercer St Unit 1 Albany, NY | 3.0 | 1.0 | 1400 | $1,800 | $1.29 | 25d | 1 | 1.01mi |
| 21 Woodlawn Ave Unit 3RDFL Albany, NY | 3.0 | 1.0 | 1300 | $1,500 | $1.15 | 45d | 1 | 1.06mi |
| 21 Woodlawn Ave Unit 3rd floor Albany, NY | 3.0 | 1.0 | 1300 | $1,500 | $1.15 | 25d | 1 | 1.06mi |
| 563 New Scotland Ave Albany, NY | 2.0 | 1.0–2.0 | 931 | $3,125 | $3.36 | 16d | 37 | 1.06mi |
| 32 Richmond St Unit 2 Albany, NY | 3.0 | 3.0 | 1248 | $2,500 | $2.00 | 16d | 1 | 1.08mi |
| 53 Greenway N Albany, NY | 3.0 | 2.0 | 1500 | $2,600 | $1.73 | 25d | 1 | 1.08mi |
| 30 Cardinal Ave Albany, NY | 4.0 | 1.0 | 1529 | $2,800 | $1.83 | 46d | 1 | 1.15mi |
| 255 Patroon Creek Blvd Albany, NY | 1.0–3.0 | 1.0–2.0 | 1080 | $2,559 | $2.37 | 16d | 22 | 1.23mi |
| 240 Washington Ave Albany, NY | 2.0 | 2.0 | 1560 | $2,450 | $1.57 | 45d | 1 | 1.47mi |
Listing history 6 events
-
2026-04-01status Pending
-
2026-03-28$399,900 Active
-
2019-12-09soldstatus $275,000
-
2019-12-04soldstatus $275,000 Closed (Final Sale) 588-char remark
Show marketing remark (588 chars)
No more showings. Multiple offers. Highest & best by 10/1 at 5PM. Pristine, turn key, two family in Pine Hills on HUGE triple lot with TONS of off street parking & two car garage! Everything has been redone in the past 17 years including: roof, windows, siding, electrical, two story trex deck, privacy fence, kitchen, bathrooms, etc. AC has been added as well as a security system & outdoor lighting (motion sensor). Gorgeous hardwood floors & tile in the 3 bathrooms! Sale includes lots at 846 & 848 Chestnut. Showings begin Sunday at 12PM. Excellent Condition
-
2019-10-03status Pend (Under Cntr) 588-char remark
Show marketing remark (588 chars)
No more showings. Multiple offers. Highest & best by 10/1 at 5PM. Pristine, turn key, two family in Pine Hills on HUGE triple lot with TONS of off street parking & two car garage! Everything has been redone in the past 17 years including: roof, windows, siding, electrical, two story trex deck, privacy fence, kitchen, bathrooms, etc. AC has been added as well as a security system & outdoor lighting (motion sensor). Gorgeous hardwood floors & tile in the 3 bathrooms! Sale includes lots at 846 & 848 Chestnut. Showings begin Sunday at 12PM. Excellent Condition
-
2019-09-25$259,000 New 588-char remark
Show marketing remark (588 chars)
No more showings. Multiple offers. Highest & best by 10/1 at 5PM. Pristine, turn key, two family in Pine Hills on HUGE triple lot with TONS of off street parking & two car garage! Everything has been redone in the past 17 years including: roof, windows, siding, electrical, two story trex deck, privacy fence, kitchen, bathrooms, etc. AC has been added as well as a security system & outdoor lighting (motion sensor). Gorgeous hardwood floors & tile in the 3 bathrooms! Sale includes lots at 846 & 848 Chestnut. Showings begin Sunday at 12PM. Excellent Condition
ⓘ Source: listings_history table (triggers on properties + properties_extension) + one-shot
backfill from property_details.listing_events for pre-trigger history.
Tax reassessment forecast NY · Partial reset (capped growth)
- Current annual tax
- $5,771 · $481/mo
- Projected year-2 tax
- $6,264 · $522/mo
- Expected delta
- +$494/yr (+$41/mo · 8.6%)
ⓘ Screening estimate from a state-policy table — verify with the county assessor before closing.
Climate risk First Street
- Flood 1/10 Low FEMA zone X (unshaded) · 0% chance over 30 yrs
- Wildfire 1/10 Low
- Heat 4/10 Moderate 7 d/yr ≥97°F today · 16 d/yr by 30 yrs out
- Wind 3/10 Moderate 6% chance of damaging wind over 30 yrs
- Air quality 1/10 Low 0 unhealthy d/yr today · 0 by 30 yrs out
Nearby sold comps map
Loading sold comps map…
Walkable amenities ~0.75 mi
Loading nearby amenities…
Taxation est. · year 1
- Rental income
- $84,384
- − Mortgage interest
- −$22,401
- − Property taxes
- −$5,771
- − Insurance
- −$2,000
- − Repairs & maintenance
- −$6,751
- − Management
- −$6,751
- − Depreciation
- −$11,633
- Taxable income
- $29,078
- Est. tax owed @ 24.0%
- −$6,979
- After-tax cash flow
- $26,749/yr
For passive investors: Depreciation is non-cash, so a rental often shows a tax loss while cash-flowing — sheltering income. Rental losses are passive: they offset passive income freely, and up to $25,000/yr can offset ordinary (W-2) income if you actively participate and your MAGI is under $100k (phasing out to $0 by $150k); unused losses carry forward. On sale, claimed depreciation is recaptured at up to 25%, and gains may owe capital-gains tax (a 1031 exchange can defer both). Figures are a year-1 estimate at your 24.0% rate — not tax advice; consult a CPA.
Schools (NCES district)
- District
- Albany City School District
- NCES district ID
- 3602460
- Math proficiency
- 37% ▲ 6.00%
- Reading proficiency
- 40% ▲ 7.00%
- Median HH income
- $40,568
- Composite
- 32.34/100
- National rank
- #5744
- State rank
- #543 of 590 in NY
Livability — Albany
- Score
- 79/100
- State rank
- #129
- US rank
- #2083
Category grades
Schools grade is shown separately in the Schools card above.
Census & demographics
- Census place
- Albany, NY
- County
- Albany County · 196,626 people
- City population
- 116,921
- Metro
- Albany-Schenectady-Troy, NY
- Population (ZIP)
- 30,771
- Household income
- $83,147
- Rent vs Own
- Severe rent burden
- 1704.0
Population outlook (Albany County) Hauer SSP2
- Today (2025)
- 320,794 people
- By 2030
- 327,401 · +2.1%
- By 2040
- 338,218 · +5.4%
- By 2050
- 348,467 · +8.6%
- By 2075
- 381,693 · +19.0%
- By 2100
- 393,809 · +22.8%
Race, ethnicity, and origin ACS 2023
- Neighborhood character
- Predominantly White (69%)
- Race & ethnicity
- White 69% Black 10% Asian 8% Hispanic / Latino 7% Two or more races 7%
- Hispanic origin (detail)
- Mexican 2% Puerto Rican 2%
- Common ancestry
- Romanian 5% Lithuanian 3% Slovak 2%
- Foreign-born
- 16% · Canada, China, South Korea
- Languages at home
- 82% English-only · Other Indo-European 6% Spanish 3% Russian/Polish/Slavic 2%
Political lean MEDSL · Albany
- 2024 margin
- Strong D (+25.8) · D 62.9% · R 37.1%
- 2008→2024 swing
- -3.6pp toward R · 2008: 29.4pp · 2024: 25.8pp
- All cycles
- 2024: D+25.8 2020: D+31.4 2016: D+24.3 2012: D+31.0 2008: D+29.4
Not yet ingested
- Civics
- —
Market trends
- HPI YoY
- ▼ -133.05%
- Current HPI
- 296.0467
- Rent YoY
- ▲ 1.85%
- Metro
- Albany-Schenectady-Troy, NY
- State GDP YoY
- ▲ 2.60%
- F500 in state
- 92
Industry mix (Fortune 500 HQ in NY)
| Industry | F500 HQs | Revenue |
|---|---|---|
| Financial Services | 10 | $950B |
|
||
| Consumer Goods | 9 | $162B |
|
||
| Insurance | 4 | $225B |
|
||
| Telecommunications | 2 | $144B |
|
||
| Pharmaceuticals | 2 | $112B |
|
||
| Media / Entertainment | 2 | $69B |
|
||
Price history
+54.4% since first listed6 events — show timeline
- 2026-04-01 Pending — Global MLS
- 2026-03-28 Listed $399,900 Global MLS
- 2019-12-09 Sold (Public Records) $275,000 Public Records
- 2019-12-04 Sold (MLS) $275,000 Global MLS
- 2019-10-03 Pending — Global MLS
- 2019-09-25 Listed $259,000 Global MLS
Property tax history
+2.0%/yrLatest (2025): $5,771 · -0.1% YoY. Source: county tax records.
Cash-flow waterfall
monthlySold comps — $/sqft
last 12 mo · ≤1 miLoading sold comps…