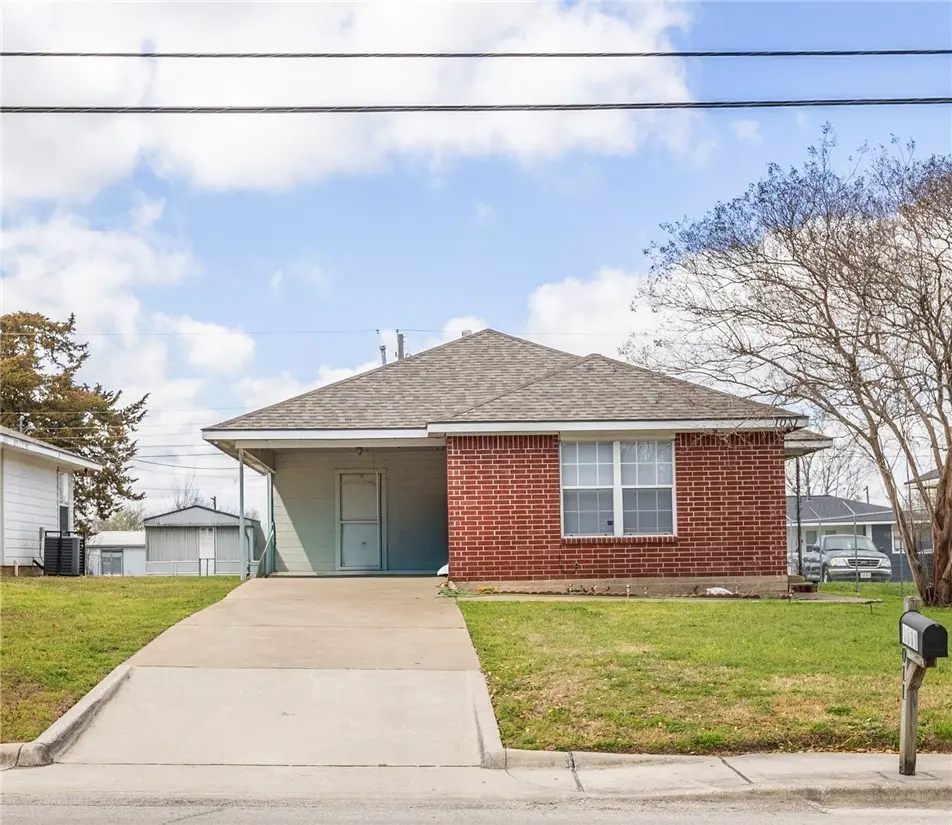
1011 W 17th St · Bryan, TX
Flood risk 1/10 · Minimal
- FEMA flood zone
- X (unshaded)
- Chance of flooding over 30 yrs
- 0.0%
- Est. flood insurance / yr
- $507 – $1,088
Fire risk 4/10 · Minor
- Est. fire insurance / yr
- $1,222 – $2,270
Heat risk 8/10 · Major
- Hot days now (above 110°F)
- 7 days/yr
- Hot days in 30 yrs
- 24 days/yr
Wind risk 8/10 · Major
- Chance of severe wind over 30 yrs
- 80.0%
Air-quality risk 1/10 · Minimal
- Unhealthy air days now
- 0 days/yr
- Unhealthy air days in 30 yrs
- 0 days/yr
Risk factors via First Street. Map © Google.
Why this score? — see what drove the C- grade
The composite is a weighted blend of 9 inputs, each scored 0–100. Each bar is that input's sub-score; the figure is the points it added to the 100-point composite (weight × sub-score).
- Cash flow +15.5/30.0
- ARV discount +15.0/15.0
- 1% rule +5.0/10.0
- DSCR +4.8/10.0
- Livability +3.8/5.0
- Rent growth +2.9/5.0
- Schools +2.6/10.0
- Condition / age +2.5/5.0
- Appreciation +0.0/10.0
$166,000
🖨 Deal sheet (PDF) 📄 Offer letter ✓ Due diligence
Listing remarks MLS
Situated at 1011 W 17th ST in Bryan, this single-family residence, constructed in 1991, stands ready within its established setting, offering a distinctive opportunity. This residence includes three bedrooms, providing dedicated spaces for a personal retreat. This single-family residence, built in 1991, presents an inviting space for creating a personalized living experience.
Key facts
- 5,301 sq ft lot
- Built 1991
- Listed 36 days
Neighborhood map
What this means for you Summary
Snapshot
- This is a 3-bed/2.0-bath single-family listed at $166k.
Deal economics
- At list price, monthly cash flow is $68 ($817/yr) — positive.
- The deal already cash-flows at list — no discount required.
- Meets the 1% rule at list price ($2k rent vs $166k).
- Recommended offer: $161k (3.0% below list) — sets the bar for market timing.
- Cap rate 6.8% vs local median 4.0% in Bryan — top-decile yield for the area; either an underpriced asset or a hidden risk that comps aren't pricing in. Stress-test before assuming the spread holds.
Location & tenants
- Location reads 76/100 on livability (#99 in TX, #3,341 nationally) — a middle-class / working-renter tenant base. Strengths: cost of living A+, housing A+, health & safety A+; Watch: crime C-, amenities C-, employment D+.
- Bryan ISD (urban): math 30% / reading 32% proficiency, ranked #608 of 826 in TX (top 74%) — families likely to look elsewhere, expect single-tenant / working-renter base with shorter leases; 68% free/reduced lunch — lower-income household profile, screen leases tightly.
- Zoned schools: Kemp-Carver El (math 22% / reading 17%, grade F, #3,583 of 4,322 statewide, top 86%, 504 students, 92% FRL); Sam Rayburn (math 42% / reading 34%, grade F, #717 of 1,662 statewide, top 44%, 1,173 students, 74% FRL); James Earl Rudder H S (math 14% / reading 27%, grade F, #1,389 of 1,632 statewide, top 86%, 1,769 students, 76% FRL).
- Market conditions: Rents rising (+1.4%/yr); 288 active listings in the ZIP; 14 comparable units currently listed for rent nearby; rentals lingering (median 46d on market — plan ~5-8 weeks vacancy on turnover, expect pricing pressure); 50% of comp listings sitting > 30 days — soft ceiling on asking rent; 2,211 units permitted in Brazos County in 2024 (768 in 5+ unit buildings).
- This rent runs 38% of the median local income ($52k/yr) — at the standard rent-burdened threshold; future hikes will face affordability resistance.
Forward outlook
- Local home prices are declining (-3.0%/yr); year-one equity from $1k of loan paydown is wiped out by about $5k of value loss. Plan a longer hold.
- Brazos County population projected at +55% by 2050 — long-run rental-demand tailwind backs the buy-and-hold thesis.
Negotiation context
- It's been on market 36 days — a 3% lower offer ($161k) is reasonable based on typical stale-listing flexibility.
- 3 sale attempts with the ask held roughly flat each time — persistent listings suggest the price (not the market) is what's stuck; bring a comps-based counter.
Risks & watch-outs
- Climate carrying-cost: severe wind risk, 80% chance of damaging wind over 30y; extreme-heat days projected 7→24/yr by 2055 (HVAC capex compounding) — expect insurance premiums to compound above CPI over the hold.
Questions for the listing agent
- It's been on market 36 days. Have you received any prior offers? Is the seller open to a 3% concession, seller financing, or rate buy-down credit?
- Is there a deadline driving the sale (1031 exchange, divorce, estate, relocation)? That informs how much negotiation room exists.
- What's the average days-on-market for RENTAL listings here right now (not sales)? A rising rental-DOM trend means longer vacancies and softer asking-rent achievability than the comps imply.
- What's the recent tenant-quality profile in this submarket — average credit score on applications, eviction rate, late-payment / NSF rate, and stable-employment percentage? A property-management company in the area should have these aggregated.
- How much new for-sale + rental construction is in the pipeline within 1–3 miles? Heavy new supply typically softens prices + rents 12–24 months out; constrained supply supports both.
Investment metrics
- 1% rule
- 1.00% ✓
- Cap rate
- 6.78%
- Cash-on-cash
- 1.76%
- DSCR
- 1.08
- GRM
- 8.3
CMA / ARV
- ARV (median comp)
- $227,002
- List price
- $166,000
- Delta
- -26.87%
- Verdict
- UNDERPRICED
- Comps
- 20 within 1.0 mi
Show comp detail 11 sales within ~0.75 mi
| Address | Dist | Beds/Ba | Sqft | Sold | Price | $/sf | Match |
|---|---|---|---|---|---|---|---|
| 1000 W 17th St | 0.06mi | 3/2.0 | 1,280 (+3%) | 3mo | $179,995 | $141 | 90 |
| 1505 Red Oak St | 0.32mi | 3/2.0 | 1,271 (+3%) | 1mo | $240,000 | $189 | 80 |
| 1105 Hall St | 0.24mi | 3/2.0 | 1,317 (+6%) | 5mo | $199,450 | $151 | 74 |
| 1216 W 17th St | 0.16mi | 3/2.0 | 1,198 (-3%) | 17mo | $234,900 | $196 | 73 |
| 5401 Bear Run | 0.45mi | 3/2.0 | 1,263 (+2%) | 5mo | $320,825 | $254 | 71 |
| 908 Chicago St | 0.21mi | 3/2.0 | 1,360 (+10%) | 13mo | $248,000 | $182 | 63 |
| 703 W 22nd St | 0.57mi | 3/2.0 | 1,203 (-3%) | 12mo | $237,000 | $197 | 59 |
| 909 N Randolph Ave | 0.34mi | 3/2.0 | 1,306 (+5%) | 19mo | $253,000 | $194 | 59 |
| 5421 Bear Run | 0.45mi | 3/2.0 | 1,415 (+14%) | 4mo | $263,010 | $186 | 52 |
| 5407 Bear Run | 0.45mi | 3/2.0 | 1,415 (+14%) | 6mo | $278,215 | $197 | 51 |
| 606 Boulevard St | 0.34mi | 3/1.0 | 1,107 (-11%) | 18mo | $175,000 | $158 | 47 |
Match score weights: distance 35% · size 25% · config 20% · recency 20%. Top-matched comps best support the ARV.
Projected returns pro-forma
-3.0% appreciation · 1.43% rent growth · sell at horizon
- IRR
- -15.4%
- Equity multiple
- 0.46×
- Total profit
- $-25,071
- Equity at exit
- $24,751
- IRR
- -9.9%
- Equity multiple
- 0.44×
- Total profit
- $-26,205
- Equity at exit
- $14,353
Cash invested: $46,480 (down + closing). Projections, not guarantees.
Landlord ↔ Tenant lean methodology
- Overall (STATE)
- 87 Strongly Landlord-Friendly
- State Texas
- 87 Strongly Landlord-Friendly · R+5
- County
- — inherits STATE
- City
- — inherits STATE
ZIP-level market 77803
- Home prices YoY
- -30.1%
- Rents YoY
- 1.4%
- Active inventory
- 288
- Price-to-rent
- 8.3×
Monthly cashflow live
- Estimated rent
- $1,667 high interval (Pro) →
- Mortgage (P&I)
- −$871
- Tax from tax record
- −$310 /mo · $3,714/yr
- Insurance
- −$69
- HOA
- −$0
- Lot rent
- −$0
- Vacancy / Maint / Mgmt
- −$350
- Net cashflow
- $68
Break-even live
Sensitivity live
| Price | -10% $162 | -5% $115 | +0% $68 | +5% $21 | +10% $-26 |
|---|---|---|---|---|---|
| Rent | -10% $-64 | -5% $2 | +0% $68 | +5% $134 | +10% $200 |
| Rate | -1.0pp $152 | -0.5pp $110 | base $68 | +0.5pp $25 | +1.0pp $-19 |
UW: 25.0% down · 7.5% · 30yr · 1.5% tax · 5.0% vac · 8.0% maint · 8.0% mgmt
Financing live
Cash to close
- Down payment
- $41,500
- Closing costs
- $4,980
- Reserves months
- —
- Total cash needed
- —
Loan-product check · same deal, 3 products live
Conventional
25% down · 7.5% · 30yr
- Down + closing
- —
- Monthly P&I
- —
- Monthly cashflow
- —
- DSCR
- —
- Eligible?
- —
Personal DTI + credit; lowest rate.
DSCR
20% down · 8.5% · 30yr
- Down + closing
- —
- Monthly P&I
- —
- Monthly cashflow
- —
- DSCR
- —
- Eligible?
- —
No personal income docs; deal must DSCR.
Hard money
10% down · 12.0% · 12mo
- Down + closing
- —
- Monthly P&I
- —
- Monthly cashflow
- —
- DSCR
- —
- Eligible?
- —
Short-term bridge; refi at stabilization.
Rent comps 14 comps
| Address | Beds | Baths | Sqft | Rent | $/sqft | DOM | Units | Dist |
|---|---|---|---|---|---|---|---|---|
| 317 W Martin Luther King Junior St Bryan, TX | 3.0 | 2.0 | 1207 | $1,650 | $1.37 | 23d | 1 | 0.58mi |
| 505 N Logan Ave Bryan, TX | 3.0 | 2.0 | 1266 | $1,895 | $1.50 | 46d | 1 | 0.60mi |
| 601 W 24th St Unit 112 Bryan, TX | 2.0 | 2.0 | 1165 | $1,600 | $1.37 | 46d | 1 | 0.72mi |
| 306 W 23rd St Bryan, TX | 3.0 | 1.0 | 999 | $1,500 | $1.50 | 46d | 1 | 0.73mi |
| 2702 Montana Ave Bryan, TX | 3.0 | 2.0 | 1305 | $1,875 | $1.44 | 46d | 1 | 0.86mi |
| 1209 N Houston Ave Bryan, TX | 3.0 | 2.0 | 1236 | $1,500 | $1.21 | 16d | 1 | 0.98mi |
| 207 N Preston Ave Bryan, TX | 2.0 | 2.0 | 1100 | $1,650 | $1.50 | 23d | 1 | 1.16mi |
| 700 S Sims Ave Bryan, TX | 2.0 | 1.0 | 918 | $1,150 | $1.25 | 23d | 1 | 1.29mi |
| 2796 Buccaneer Trl Bryan, TX | 3.0 | 2.0 | 1272 | $1,950 | $1.53 | 23d | 1 | 1.31mi |
| 106 W 33rd St Bryan, TX | 2.0 | 2.5 | 1204 | $1,850 | $1.54 | 23d | 1 | 1.37mi |
| 104 W 33rd St Bryan, TX | 2.0 | 2.5 | 1204 | $1,850 | $1.54 | 46d | 1 | 1.38mi |
| 514 E 30th St Unit B1 Bryan, TX | 2.0 | 1.5 | 879 | $875 | $1.00 | 46d | 1 | 1.42mi |
| 1300 Baker Ave Bryan, TX | 2.0 | 1.0 | 850 | $970 | $1.14 | 15d | 1 | 1.44mi |
| 1112 Baker Ave Bryan, TX | 3.0 | 1.0 | 900 | $1,695 | $1.88 | 46d | 1 | 1.47mi |
Listing history 6 events
-
2026-05-16status Pending 378-char remark
Show marketing remark (378 chars)
Situated at 1011 W 17th ST in Bryan, this single-family residence, constructed in 1991, stands ready within its established setting, offering a distinctive opportunity. This residence includes three bedrooms, providing dedicated spaces for a personal retreat. This single-family residence, built in 1991, presents an inviting space for creating a personalized living experience.
-
2026-05-13historical Active Under Contract 378-char remark
Show marketing remark (378 chars)
Situated at 1011 W 17th ST in Bryan, this single-family residence, constructed in 1991, stands ready within its established setting, offering a distinctive opportunity. This residence includes three bedrooms, providing dedicated spaces for a personal retreat. This single-family residence, built in 1991, presents an inviting space for creating a personalized living experience.
-
2026-04-19status Active 378-char remark
Show marketing remark (378 chars)
Situated at 1011 W 17th ST in Bryan, this single-family residence, constructed in 1991, stands ready within its established setting, offering a distinctive opportunity. This residence includes three bedrooms, providing dedicated spaces for a personal retreat. This single-family residence, built in 1991, presents an inviting space for creating a personalized living experience.
-
2026-04-14status Active 378-char remark
Show marketing remark (378 chars)
Situated at 1011 W 17th ST in Bryan, this single-family residence, constructed in 1991, stands ready within its established setting, offering a distinctive opportunity. This residence includes three bedrooms, providing dedicated spaces for a personal retreat. This single-family residence, built in 1991, presents an inviting space for creating a personalized living experience.
-
2026-04-07$166,000 Active 378-char remark
Show marketing remark (378 chars)
Situated at 1011 W 17th ST in Bryan, this single-family residence, constructed in 1991, stands ready within its established setting, offering a distinctive opportunity. This residence includes three bedrooms, providing dedicated spaces for a personal retreat. This single-family residence, built in 1991, presents an inviting space for creating a personalized living experience.
-
1998-04-20soldstatus
ⓘ Source: listings_history table (triggers on properties + properties_extension) + one-shot
backfill from property_details.listing_events for pre-trigger history.
Tax reassessment forecast TX · Resets to sale price
- Current annual tax
- $3,714 · $310/mo
- Projected year-2 tax
- $3,714 · $310/mo
- Expected delta
- $0/yr ($0/mo · 0.0%)
ⓘ Screening estimate from a state-policy table — verify with the county assessor before closing.
Climate risk First Street
- Flood 1/10 Low FEMA zone X (unshaded) · 0% chance over 30 yrs
- Wildfire 4/10 Moderate
- Heat 8/10 Severe 7 d/yr ≥110°F today · 24 d/yr by 30 yrs out
- Wind 8/10 Severe 80% chance of damaging wind over 30 yrs
- Air quality 1/10 Low 0 unhealthy d/yr today · 0 by 30 yrs out
Nearby sold comps map
Loading sold comps map…
Walkable amenities ~0.75 mi
Loading nearby amenities…
Taxation est. · year 1
- Rental income
- $20,009
- − Mortgage interest
- −$9,299
- − Property taxes
- −$3,714
- − Insurance
- −$830
- − Repairs & maintenance
- −$1,601
- − Management
- −$1,601
- − Depreciation
- −$4,829
- Taxable loss
- −$1,864
- Est. tax savings @ 24.0%
- +$447
- After-tax cash flow
- $1,264/yr
For passive investors: Depreciation is non-cash, so a rental often shows a tax loss while cash-flowing — sheltering income. Rental losses are passive: they offset passive income freely, and up to $25,000/yr can offset ordinary (W-2) income if you actively participate and your MAGI is under $100k (phasing out to $0 by $150k); unused losses carry forward. On sale, claimed depreciation is recaptured at up to 25%, and gains may owe capital-gains tax (a 1031 exchange can defer both). Figures are a year-1 estimate at your 24.0% rate — not tax advice; consult a CPA.
Schools (NCES district)
- District
- Bryan ISD
- NCES district ID
- 4811790
- Math proficiency
- 30% ▼ -8.00%
- Reading proficiency
- 32% ▼ -3.00%
- Median HH income
- $41,895
- Composite
- 26.26/100
- National rank
- #7253
- State rank
- #608 of 826 in TX
Livability — Bryan
- Score
- 76/100
- State rank
- #99
- US rank
- #3341
Category grades
Schools grade is shown separately in the Schools card above.
Census & demographics
- Census place
- Bryan, TX
- County
- Brazos County · 233,400 people
- City population
- 101,772
- Metro
- College Station-Bryan, TX
- Population (ZIP)
- 31,525
- Household income
- $52,274
- Rent vs Own
- Severe rent burden
- 1094.0
Population outlook (Brazos County) Hauer SSP2
- Today (2025)
- 267,942 people
- By 2030
- 296,630 · +10.7%
- By 2040
- 354,560 · +32.3%
- By 2050
- 414,616 · +54.7%
- By 2075
- 562,158 · +109.8%
- By 2100
- 678,828 · +153.3%
Race, ethnicity, and origin ACS 2023
- Neighborhood character
- Diverse neighborhood (Simpson 0.56)
- Race & ethnicity
- Hispanic / Latino 61% Black 21% Two or more races 18% White 17%
- Hispanic origin (detail)
- Mexican 56%
- Common ancestry
- Lithuanian 1% Romanian 1% Slovak 1%
- Foreign-born
- 21% · Canada, Jamaica, Dominican Republic
- Languages at home
- 52% English-only · Spanish 47%
Political lean MEDSL · Brazos
- 2024 margin
- Strong R (+24.9) · D 36.9% · R 61.7% · Other 1.4%
- 2008→2024 swing
- +4.1pp toward D · 2008: -28.9pp · 2024: -24.9pp
- All cycles
- 2024: R+24.9 2020: R+14.3 2016: R+23.7 2012: R+35.3 2008: R+28.9
Not yet ingested
- Civics
- —
Market trends
- HPI YoY
- ▼ -110.84%
- Current HPI
- 257.2885
- Rent YoY
- ▲ 1.43%
- Metro
- College Station-Bryan, TX
- State GDP YoY
- ▲ 3.95%
- F500 in state
- 110
Industry mix (Fortune 500 HQ in TX)
| Industry | F500 HQs | Revenue |
|---|---|---|
| Energy | 16 | $1,198B |
|
||
| Technology | 5 | $198B |
|
||
| Engineering / Construction | 4 | $72B |
|
||
| Energy Services | 3 | $60B |
|
||
| Utilities | 3 | $41B |
|
||
| Healthcare | 2 | $330B |
|
||
Price history
6 events — show timeline
- 2026-05-16 Pending — BCSRMLS
- 2026-05-13 Contingent — BCSRMLS
- 2026-04-19 Relisted — BCSRMLS
- 2026-04-14 Relisted — BCSRMLS
- 2026-04-07 Listed $166,000 BCSRMLS
- 1998-04-20 Sold (Public Records) — Public Records
Property tax history
+4.2%/yrLatest (2025): $3,714 · -9.6% YoY. Source: county tax records.
Cash-flow waterfall
monthlySold comps — $/sqft
last 12 mo · ≤1 miLoading sold comps…