13393 Mariposa · Victorville, CA
Flood risk 6/10 · Moderate
- FEMA flood zone
- X (unshaded)
- Chance of flooding over 30 yrs
- 0.67%
- Est. flood insurance / yr
- $507 – $1,088
Fire risk 1/10 · Minimal
- Est. fire insurance / yr
- $659 – $1,223
Heat risk 7/10 · Major
- Hot days now (above 99°F)
- 3 days/yr
- Hot days in 30 yrs
- 8 days/yr
Wind risk 1/10 · Minimal
- Chance of severe wind over 30 yrs
- —
Air-quality risk 9/10 · Severe
- Unhealthy air days now
- 22 days/yr
- Unhealthy air days in 30 yrs
- 28 days/yr
Risk factors via First Street. Map © Google.
Why this score? — see what drove the B- grade
The composite is a weighted blend of 9 inputs, each scored 0–100. Each bar is that input's sub-score; the figure is the points it added to the 100-point composite (weight × sub-score).
- Cash flow +30.0/30.0
- 1% rule +10.0/10.0
- DSCR +10.0/10.0
- ARV discount +7.5/15.0
- Rent growth +3.6/5.0
- Livability +2.7/5.0
- Condition / age +2.5/5.0
- Schools +2.2/10.0
- Appreciation +0.0/10.0
$88,000
🖨 Deal sheet 📄 Offer letter ✓ Due diligence
Listing remarks MLS
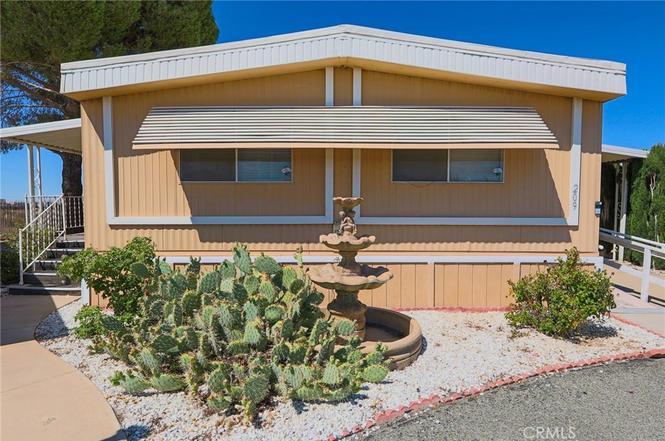
PRICED TO SELL QUICKLY! Immaculate 2 bedroom, 2 bath Lancer Mobile home located in the 55+ gated community of Victor Villa! Home is move-in ready! Features include: living room with built in cabinets, kitchen with newer appliances, two full bathrooms, nice master suite with a bath shower combo, guest bedroom, lots of storage, laundry hook-ups with washer and dryer included. Plumbing, skirting and windows are all been replaced over the past five years. Large carport, two sheds, one with electricity! Nice corner lot with two driveways; one in front and one in back! Inviting covered porch! Gated Park offers lots of amenities including on site manager, clubhouse, pool, spa, tennis, miniature golf and gym. Ideally located within minutes to all conveniences and freeway. # of RV Spaces: 0 Special Features: OutbuildingsFRON Lot Location Type: Standard Location FireplaceFeatures: None Pool Features: Common Pool Spa Features: Common Spa Zoning: Residential 1 # of Attached Spaces: 0 # of Detached Spaces: 0 # of RV Spaces: 0
Key facts
- Open floor plan
- Clubhouse
- Swimming pool
Tags
Property features AI
Finance
- Other: Parcel number on file
- Financial info: Land lease amount: $780
- HOA & community: Part of a homeowners association; Senior community; Community features include dog park and suburban setting; Located in Victor Villa manufactured home park; Monthly land lease
Exterior
- Parking: Attached carport (1 space)
- Security: Gated community
- Utilities: Public sewer; District / public water
- Home design: Manufactured home (12' x 56') remains on site; Single-story; Entry at level 1
- Construction: Year built per assessor; Assessor's data for living area
- Exterior features: Flat roof; Chain-link fencing; Covered patio; Community pool; Located on a cul-de-sac; One shed on property
Interior
- Kitchen: Garbage disposal; Gas range; Dishwasher
- Flooring: Vinyl flooring; Carpet
- Bathrooms: Two full bathrooms
- Heating & cooling: Central furnace heating; Central air conditioning
- Interior features: One-level home; Gated community; Community spa; Covered patio; Entry through gated entrance
- Laundry & utility: Inside laundry
Neighborhood map
What this means for you Summary
Snapshot
- This is a 2-bed/2.0-bath land listed at $88k.
Deal economics
- At list price, monthly cash flow is $813 ($10k/yr) — positive.
- The deal already cash-flows at list — no discount required.
- Meets the 1% rule at list price ($2k rent vs $88k).
- Cap rate 17.4% vs local median 4.2% in Victorville — top-decile yield for the area; either an underpriced asset or a hidden risk that comps aren't pricing in. Stress-test before assuming the spread holds.
Location & tenants
- Location reads 54/100 on livability (#906 in CA) — a working-class tenant base; expect higher turnover. Strengths: housing A+; Watch: employment D+, schools D-, crime F.
- Victor Elementary (urban): math 25% / reading 25% proficiency, ranked #408 of 517 in CA (top 79%) — low school quality limits family demand, transient renter base, plan for 1-2y turnover; 70% free/reduced lunch — lower-income household profile, screen leases tightly.
- Market conditions: Rents rising fast (+4.3%/yr); 286 active listings in the ZIP; 5,458 units permitted in San Bernardino County in 2024 (1,500 in 5+ unit buildings).
- This rent runs 35% of the median local income ($62k/yr) — at the standard rent-burdened threshold; future hikes will face affordability resistance.
Forward outlook
- Local home prices are declining (-3.0%/yr); year-one equity from $608 of loan paydown is wiped out by about $3k of value loss. Plan a longer hold.
- San Bernardino County population projected at +15% by 2050 — modest demand growth; plan on rents tracking national, not racing it.
- At projected returns (-3.0% appreciation + 4.3% rent growth), your $25k cash investment doubles in ~3 years — after that, you're playing with house money.
Negotiation context
- Only 3 days on market — expect competitive offers; lowballing is unlikely to land.
- 5 sale attempts since 8y ago with the ask held roughly flat each time — persistent listings suggest the price (not the market) is what's stuck; bring a comps-based counter.
- Current owner paid $22k; list at $88k implies a 291% gain — meaningful room to come down on a strong offer.
Risks & watch-outs
- Climate carrying-cost: major flood risk; extreme-heat days projected 3→8/yr by 2055 (HVAC capex compounding) — expect insurance premiums to compound above CPI over the hold.
Questions for the listing agent
- Built in 1976 — when were the roof, HVAC, electrical panel, plumbing, and water heater last replaced?
- Is there a deadline driving the sale (1031 exchange, divorce, estate, relocation)? That informs how much negotiation room exists.
- Schools are D-rated, which usually means shorter tenancies and higher turnover. Who's the typical renter profile here, and what's been the actual vacancy rate?
- Crime grade is F in this area — have there been break-ins, vandalism, or insurance claims at this property in the last 3 years? What carrier currently insures it and at what premium?
- What's the average days-on-market for RENTAL listings here right now (not sales)? A rising rental-DOM trend means longer vacancies and softer asking-rent achievability than the comps imply.
- What's the recent tenant-quality profile in this submarket — average credit score on applications, eviction rate, late-payment / NSF rate, and stable-employment percentage? A property-management company in the area should have these aggregated.
- How much new for-sale + rental construction is in the pipeline within 1–3 miles? Heavy new supply typically softens prices + rents 12–24 months out; constrained supply supports both.
Investment metrics
- 1% rule
- 2.04% ✓
- Cap rate
- 17.39%
- Cash-on-cash
- 39.62%
- DSCR
- 2.76
- GRM
- 4.1
CMA / ARV
No comps found within radius.
Projected returns pro-forma
-3.0% appreciation · 4.27% rent growth · sell at horizon
- IRR
- 37.4%
- Equity multiple
- 2.62×
- Total profit
- $39,907
- Equity at exit
- $13,121
- IRR
- 44.6%
- Equity multiple
- 5.52×
- Total profit
- $111,382
- Equity at exit
- $7,609
Cash invested: $24,640 (down + closing). Projections, not guarantees.
Landlord ↔ Tenant lean methodology
- Overall (STATE)
- 18 Strongly Tenant-Friendly
- State California
- 18 Strongly Tenant-Friendly · D+13
- County
- — inherits STATE
- City
- — inherits STATE
ZIP-level market 92395
- Home prices YoY
- -14.7%
- Rents YoY
- 4.3%
- Active inventory
- 286
- Price-to-rent
- 4.1×
Monthly cashflow live
- Estimated rent
- $1,800 medium interval (Pro) →
- Mortgage (P&I)
- −$461
- Tax est. 1.5%
- −$110 /mo · $1,320/yr
- Insurance
- −$37
- HOA
- −$0
- Vacancy / Maint / Mgmt
- −$378
- Net cashflow
- $813
Break-even live
UW: 25.0% down · 7.5% · 30yr · 1.5% tax · 5.0% vac · 8.0% maint · 8.0% mgmt
Financing live
Cash to close
- Down payment
- $22,000
- Closing costs
- $2,640
- Reserves months
- —
- Total cash needed
- —
Loan-product check · same deal, 3 products live
Conventional
25% down · 7.5% · 30yr
- Down + closing
- —
- Monthly P&I
- —
- Monthly cashflow
- —
- DSCR
- —
- Eligible?
- —
Personal DTI + credit; lowest rate.
DSCR
20% down · 8.5% · 30yr
- Down + closing
- —
- Monthly P&I
- —
- Monthly cashflow
- —
- DSCR
- —
- Eligible?
- —
No personal income docs; deal must DSCR.
Hard money
10% down · 12.0% · 12mo
- Down + closing
- —
- Monthly P&I
- —
- Monthly cashflow
- —
- DSCR
- —
- Eligible?
- —
Short-term bridge; refi at stabilization.
Listing history 4 events
-
2026-06-18days on market $88,000 Active 3 DOM
-
2026-06-17days on market $88,000 Active 2 DOM
-
2026-06-15remarks 396-char remark
-
2026-06-15$88,000 Active 1 DOM
ⓘ Source: listings_history table (triggers on properties + properties_extension) + one-shot
backfill from property_details.listing_events for pre-trigger history.
Climate risk First Street
- Flood 6/10 Major FEMA zone X (unshaded) · 67% chance over 30 yrs
- Wildfire 1/10 Low
- Heat 7/10 Severe 3 d/yr ≥99°F today · 8 d/yr by 30 yrs out
- Wind 1/10 Low
- Air quality 9/10 Extreme 22 unhealthy d/yr today · 28 by 30 yrs out
Nearby sold comps map
Loading sold comps map…
Walkable amenities ~0.75 mi
Loading nearby amenities…
Taxation est. · year 1
- Rental income
- $21,594
- − Mortgage interest
- −$4,929
- − Property taxes
- −$1,320
- − Insurance
- −$440
- − Repairs & maintenance
- −$1,728
- − Management
- −$1,728
- − Depreciation
- −$2,560
- Taxable income
- $8,890
- Est. tax owed @ 24.0%
- −$2,134
- After-tax cash flow
- $7,628/yr
For passive investors: Depreciation is non-cash, so a rental often shows a tax loss while cash-flowing — sheltering income. Rental losses are passive: they offset passive income freely, and up to $25,000/yr can offset ordinary (W-2) income if you actively participate and your MAGI is under $100k (phasing out to $0 by $150k); unused losses carry forward. On sale, claimed depreciation is recaptured at up to 25%, and gains may owe capital-gains tax (a 1031 exchange can defer both). Figures are a year-1 estimate at your 24.0% rate — not tax advice; consult a CPA.
Schools (NCES district)
- District
- Victor Elementary
- NCES district ID
- 0641040
- Math proficiency
- 25% ▬ 0.00%
- Reading proficiency
- 25% ▼ -9.00%
- Median HH income
- $44,949
- Composite
- 21.58/100
- National rank
- #8304
- State rank
- #408 of 517 in CA
Livability — Victorville
- Score
- 54/100
- State rank
- #906
- US rank
- #24038
Category grades
Schools grade is shown separately in the Schools card above.
Census & demographics
- Census place
- Victorville, CA
- County
- San Bernardino County · 2,030,291 people
- City population
- 154,418
- Metro
- Riverside-San Bernardino-Ontario, CA
- Population (ZIP)
- 47,375
- Household income
- $62,102
- Rent vs Own
- Severe rent burden
- 2449.0
Population outlook (San Bernardino County) Hauer SSP2
- Today (2025)
- 2,300,329 people
- By 2030
- 2,378,907 · +3.4%
- By 2040
- 2,523,137 · +9.7%
- By 2050
- 2,642,388 · +14.9%
- By 2075
- 2,880,769 · +25.2%
- By 2100
- 2,909,436 · +26.5%
Race, ethnicity, and origin ACS 2023
- Neighborhood character
- Diverse neighborhood (Simpson 0.65)
- Race & ethnicity
- Hispanic / Latino 49% White 30% Two or more races 19% Black 13% Asian 4% Native American 1%
- Hispanic origin (detail)
- Mexican 40% Puerto Rican 1%
- Common ancestry
- Romanian 1% Slovak 1% Portuguese 1%
- Foreign-born
- 18% · Canada, South Korea, Guatemala
- Languages at home
- 63% English-only · Spanish 31% Tagalog/Filipino 1% Arabic 1%
Political lean MEDSL · San Bernardino
- 2024 margin
- Toss-up / Even · D 47.5% · R 49.7% · Other 2.8%
- 2008→2024 swing
- -8.5pp toward R · 2008: 6.3pp · 2024: -2.1pp
- All cycles
- 2024: R+2.1 2020: D+10.7 2016: D+9.8 2012: D+5.4 2008: D+6.3
Not yet ingested
- Civics
- —
Market trends
- HPI YoY
- ▼ -68.10%
- Current HPI
- 395.2836
- Rent YoY
- ▲ 4.27%
- Metro
- Riverside-San Bernardino-Ontario, CA
- State GDP YoY
- ▲ 3.21%
- F500 in state
- 116
Industry mix (Fortune 500 HQ in CA)
| Industry | F500 HQs | Revenue |
|---|---|---|
| Technology | 27 | $1,492B |
|
||
| Financial Services | 3 | $174B |
|
||
| Retail | 3 | $44B |
|
||
| Insurance | 3 | $26B |
|
||
| Media / Entertainment | 2 | $115B |
|
||
| Pharmaceuticals / Biotech | 2 | $62B |
|
||
Price history
+1073.3% since first listed14 events — show timeline
- 2026-06-15 Listed $88,000 CRMLS
- 2022-02-28 Listing Removed — CRMLS
- 2022-02-26 Relisted — CRMLS
- 2022-02-25 Relisted — CRMLS
- 2022-01-11 Price Changed $69,000 CRMLS
- 2021-12-04 Listed $80,000 CRMLS
- 2018-11-15 Sold (MLS) $22,500 CRMLS
- 2018-09-15 Listed $22,500 CRMLS
- 2006-08-25 Sold (MLS) $60,000 CRMLS
- 2003-10-31 Sold (MLS) $10,500 CRMLS
- 2003-09-19 Sold (MLS) $37,500 CRMLS
- 2001-08-23 Sold (MLS) $9,000 CRMLS
- 2001-02-20 Sold (MLS) $1,800 CRMLS
- 2000-07-12 Sold (MLS) $7,500 CRMLS
Property tax history
+30.8%/yrLatest (2025): $24,754 · +6.5% YoY. Source: county tax records.
Cash-flow waterfall
monthlySold comps — $/sqft
last 12 mo · ≤1 miLoading sold comps…