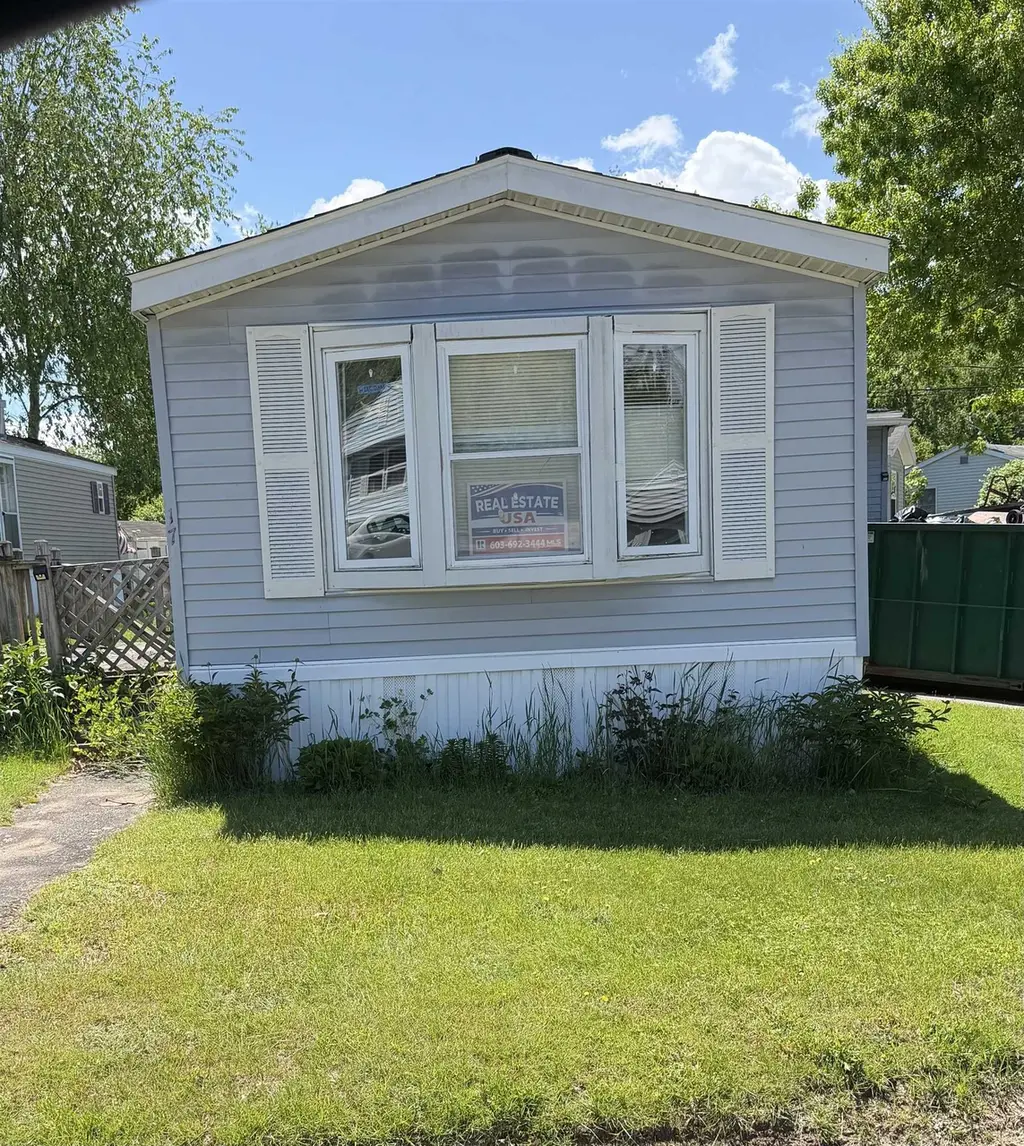
17 Wayland Cir · Exeter, NH
Flood risk No data
- FEMA flood zone
- —
- Chance of flooding over 30 yrs
- —
- Est. flood insurance / yr
- —
Fire risk No data
- Est. fire insurance / yr
- —
Heat risk No data
- Hot days now (above threshold)
- —
- Hot days in 30 yrs
- —
Wind risk No data
- Chance of severe wind over 30 yrs
- —
Air-quality risk No data
- Unhealthy air days now
- —
- Unhealthy air days in 30 yrs
- —
Risk factors via First Street. Map © Google.
Why this score? — see what drove the B+ grade
The composite is a weighted blend of 9 inputs, each scored 0–100. Each bar is that input's sub-score; the figure is the points it added to the 100-point composite (weight × sub-score).
- Cash flow +30.0/30.0
- ARV discount +15.0/15.0
- 1% rule +10.0/10.0
- DSCR +10.0/10.0
- Schools +4.6/10.0
- Livability +4.5/5.0
- Rent growth +2.5/5.0
- Condition / age +2.5/5.0
- Appreciation +0.0/10.0
$92,000
🖨 Deal sheet (PDF) 📄 Offer letter ✓ Due diligence
Listing remarks MLS
BETTER THAN NEW! COMPLETLY REMODELED; SHEETROCK WALLS CEILING, VINYL TILT-IN WINDOWS, TRIM. KITCHEN W/ TONS OF CABINETS, DESK, CENTER ISLAND GAS COOK TOP, BREAKFAST BAR, SKYLIGHT. NEW BERBER CARPETS, STYLISH BATHRM W/ TILE FLOOR MUCH MORE! MUST SEE!
Key facts
- 4,356 sq ft lot
- Community pool
- Built 1987
Property features AI
Finance
- HOA & community: Association fee $410 monthly (includes buy-in fee); Association amenities include an in-ground pool; Road frontage managed by association; development is Exeter River
Exterior
- Parking: Paved driveway
- Utilities: Community water; Community sewer; 100 Amp electric service; Internet via DSL and cable; cable available; Gas via LP/bottle; satellite and telephone at site
- Home design: Detached manufactured home; Shingle - architectural roof; Built in 1987; Located in the Exeter River park (park-approved, co-op)
- Construction: Combination exterior construction; Manufactured home structure
- Exterior features: Interior lot; Paved driveway
Interior
- Kitchen: Range (electric)
- Bedrooms: Bedroom on the main level
- Bathrooms: 1 full bath
- Heating & cooling: Forced air heating
- Interior features: 4 total rooms; 1 full bathroom
- Laundry & utility: Dryer; Electric water heater
Neighborhood map
What this means for you Summary
Snapshot
- This is a 2-bed/1.5-bath manufactured listed at $92k.
Deal economics
- At list price, monthly cash flow is $1k ($12k/yr) — positive.
- The deal already cash-flows at list — no discount required.
- Meets the 1% rule at list price ($3k rent vs $92k).
- Recommended offer: $91k (1.5% below list) — sets the bar for market timing.
- Cap rate 19.6% vs local median 2.3% in Exeter — top-decile yield for the area; either an underpriced asset or a hidden risk that comps aren't pricing in. Stress-test before assuming the spread holds.
Location & tenants
- Location reads 91/100 on livability (#1 in NH, #59 nationally) — a professional / high-income tenant draw. Strengths: crime A+, amenities A+, commute A+.
- Exeter School District (suburban): math 46% / reading 57% proficiency, ranked #32 of 98 in NH (top 33%) — acceptable for families but not a draw, mixed tenant base, ~2y average lease; only 13% free/reduced lunch — higher-income household profile.
- Market conditions: 143 active listings in the ZIP; 4 comparable units currently listed for rent nearby; rentals leasing fast (median 0d on market — plan ~1-2 weeks tenant-placement turnaround); high-income renter base; 1,276 units permitted in Rockingham County in 2024 (593 in 5+ unit buildings).
Forward outlook
- Local home prices are declining (-3.0%/yr); year-one equity from $636 of loan paydown is wiped out by about $3k of value loss. Plan a longer hold.
- At projected returns (-3.0% appreciation + 3.0% rent growth), your $26k cash investment doubles in ~3 years — after that, you're playing with house money.
Negotiation context
- It's been on market 16 days — a 2% lower offer ($91k) is reasonable based on typical stale-listing flexibility.
- 2 sale attempts since 22y ago; this cycle's ask has dropped $17k (16%) from the opening price — seller is motivated, your offer sets the floor, not the list.
- Current owner paid $45k; list at $92k implies a 104% gain — meaningful room to come down on a strong offer.
Risks & watch-outs
- Watch-outs: property tax is 2.8% of price.
Questions for the listing agent
- Property tax is high relative to price — has the assessment been appealed recently, and will the sale trigger a re-assessment?
- What does the HOA fee cover, when was the last increase, and are there any pending special assessments or reserve-fund shortfalls?
- Is there a deadline driving the sale (1031 exchange, divorce, estate, relocation)? That informs how much negotiation room exists.
- Schools are A-rated — typically a magnet for longer-tenancy family renters. What's the average tenant stay here, and is there a school-zone premium baked into asking?
- What's the average days-on-market for RENTAL listings here right now (not sales)? A rising rental-DOM trend means longer vacancies and softer asking-rent achievability than the comps imply.
- What's the recent tenant-quality profile in this submarket — average credit score on applications, eviction rate, late-payment / NSF rate, and stable-employment percentage? A property-management company in the area should have these aggregated.
- How much new for-sale + rental construction is in the pipeline within 1–3 miles? Heavy new supply typically softens prices + rents 12–24 months out; constrained supply supports both.
Investment metrics
- 1% rule
- 2.98% ✓
- Cap rate
- 19.57%
- Cash-on-cash
- 47.41%
- DSCR
- 3.11
- GRM
- 2.8
CMA / ARV
- ARV (on-the-fly)
- $134,400
- Comps found
- 12
Show comp detail 12 sales within ~0.75 mi
| Address | Dist | Beds/Ba | Sqft | Sold | Price | $/sf | Match |
|---|---|---|---|---|---|---|---|
| 3 Lindenshire Ave | 0.07mi | 2/1.0 | 814 (-3%) | 11mo | $130,000 | $160 | 80 |
| 23 Sumac St | 0.36mi | 2/2.0 | 880 (+5%) | 2mo | $195,000 | $222 | 72 |
| 9 Alder St | 0.21mi | 2/1.0 | 784 (-7%) | 8mo | $99,900 | $127 | 71 |
| 1 Hilton Ave | 0.08mi | 2/2.0 | 924 (+10%) | 12mo | $150,000 | $162 | 68 |
| 10 Alder St | 0.19mi | 2/1.0 | 924 (+10%) | 7mo | $150,000 | $162 | 67 |
| 2 Lilac St | 0.14mi | 2/2.0 | 924 (+10%) | 10mo | $218,000 | $236 | 66 |
| 28 Morton St | 0.17mi | 2/2.0 | 924 (+10%) | 12mo | $160,000 | $173 | 63 |
| 10 Cherry St | 0.18mi | 3/1.0 (+1) | 924 (+10%) | 11mo | $101,000 | $109 | 59 |
| 309 Friar Tuck Dr | 0.50mi | 2/1.0 | 792 (-6%) | 10mo | $64,000 | $81 | 57 |
| 208 Robin Hood Dr | 0.38mi | 2/1.0 | 944 (+12%) | 5mo | $55,000 | $58 | 56 |
| 709 Nottingham Dr #709 | 0.54mi | 2/1.5 | 952 (+13%) | 4mo | $99,000 | $104 | 49 |
| 133 Robin Hood Dr | 0.52mi | 2/1.5 | 952 (+13%) | 7mo | $55,000 | $58 | 48 |
Match score weights: distance 35% · size 25% · config 20% · recency 20%. Top-matched comps best support the ARV.
Projected returns pro-forma
-3.0% appreciation · 3.0% rent growth · sell at horizon
- IRR
- 45.0%
- Equity multiple
- 2.95×
- Total profit
- $50,265
- Equity at exit
- $13,717
- IRR
- 50.9%
- Equity multiple
- 6.00×
- Total profit
- $128,675
- Equity at exit
- $7,954
Cash invested: $25,760 (down + closing). Projections, not guarantees.
Landlord ↔ Tenant lean methodology
- Overall (STATE)
- 56 Moderately Landlord-Leaning
- State New Hampshire
- 56 Moderately Landlord-Leaning · D+1
- County
- — inherits STATE
- City
- — inherits STATE
ZIP-level market 03833
- Active inventory
- 143
- Price-to-rent
- 2.8×
Monthly cashflow live
- Estimated rent
- $2,738 medium interval (Pro) →
- Mortgage (P&I)
- −$482
- Tax from tax record
- −$215 /mo · $2,576/yr
- Insurance
- −$38
- HOA
- −$410
- Vacancy / Maint / Mgmt
- −$575
- Net cashflow
- $1,018
Break-even live
Sensitivity live
| Price | -10% $1,070 | -5% $1,044 | +0% $1,018 | +5% $992 | +10% $966 |
|---|---|---|---|---|---|
| Rent | -10% $801 | -5% $910 | +0% $1,018 | +5% $1,126 | +10% $1,234 |
| Rate | -1.0pp $1,064 | -0.5pp $1,041 | base $1,018 | +0.5pp $994 | +1.0pp $970 |
UW: 25.0% down · 7.5% · 30yr · 1.5% tax · 5.0% vac · 8.0% maint · 8.0% mgmt
Financing live
Cash to close
- Down payment
- $23,000
- Closing costs
- $2,760
- Reserves months
- —
- Total cash needed
- —
Loan-product check · same deal, 3 products live
Conventional
25% down · 7.5% · 30yr
- Down + closing
- —
- Monthly P&I
- —
- Monthly cashflow
- —
- DSCR
- —
- Eligible?
- —
Personal DTI + credit; lowest rate.
DSCR
20% down · 8.5% · 30yr
- Down + closing
- —
- Monthly P&I
- —
- Monthly cashflow
- —
- DSCR
- —
- Eligible?
- —
No personal income docs; deal must DSCR.
Hard money
10% down · 12.0% · 12mo
- Down + closing
- —
- Monthly P&I
- —
- Monthly cashflow
- —
- DSCR
- —
- Eligible?
- —
Short-term bridge; refi at stabilization.
Rent comps 4 comps
| Address | Beds | Baths | Sqft | Rent | $/sqft | DOM | Units | Dist |
|---|---|---|---|---|---|---|---|---|
| 162 Front St Exeter, NH | 2.0 | 1.0 | 720 | $2,600 | $3.61 | 18d | 1 | 0.76mi |
| 69 Winter St Exeter, NH | 1.0 | 1.0 | 1100 | $1,900 | $1.73 | 0d | 1 | 0.89mi |
| 68 Park St Unit 4 Exeter, NH | 1.0 | 1.0 | 564 | $1,675 | $2.97 | 0d | 1 | 1.15mi |
| 55 Water St #203 Exeter, NH | 2.0 | 2.0 | 1071 | $4,700 | $4.39 | 0d | 1 | 1.33mi |
HOA detail
- Monthly dues
- $410 · $4,920/yr
- Likely covers
- gas
Listing history 11 events
-
2026-06-21pricedays on market $92,000 Active 16 DOM
-
2026-06-18days on market $97,000 Active 13 DOM
-
2026-06-17days on market $97,000 Active 12 DOM
-
2026-06-16days on market $97,000 Active 11 DOM
-
2026-06-15days on market $97,000 Active 10 DOM
-
2026-06-13days on market $97,000 Active 8 DOM
-
2026-06-13pricedays on market $97,000 Active 7 DOM
-
2026-06-09days on market $109,000 Active 4 DOM
-
2026-06-08days on market $109,000 Active 3 DOM
-
2026-06-07remarks 366-char remark
-
2026-06-07$109,000 Active 2 DOM
ⓘ Source: listings_history table (triggers on properties + properties_extension) + one-shot
backfill from property_details.listing_events for pre-trigger history.
Tax reassessment forecast NH · Partial reset (capped growth)
- Current annual tax
- $2,576 · $215/mo
- Projected year-2 tax
- $2,576 · $215/mo
- Expected delta
- $0/yr ($0/mo · 0.0%)
ⓘ Screening estimate from a state-policy table — verify with the county assessor before closing.
Nearby sold comps map
Loading sold comps map…
Walkable amenities ~0.75 mi
Loading nearby amenities…
Taxation est. · year 1
- Rental income
- $32,858
- − Mortgage interest
- −$5,153
- − Property taxes
- −$2,576
- − Insurance
- −$460
- − Repairs & maintenance
- −$2,629
- − Management
- −$2,629
- − HOA
- −$4,920
- − Depreciation
- −$2,676
- Taxable income
- $11,815
- Est. tax owed @ 24.0%
- −$2,836
- After-tax cash flow
- $9,377/yr
For passive investors: Depreciation is non-cash, so a rental often shows a tax loss while cash-flowing — sheltering income. Rental losses are passive: they offset passive income freely, and up to $25,000/yr can offset ordinary (W-2) income if you actively participate and your MAGI is under $100k (phasing out to $0 by $150k); unused losses carry forward. On sale, claimed depreciation is recaptured at up to 25%, and gains may owe capital-gains tax (a 1031 exchange can defer both). Figures are a year-1 estimate at your 24.0% rate — not tax advice; consult a CPA.
Schools (NCES district)
- District
- Exeter School District
- NCES district ID
- 3302970
- Math proficiency
- 46% ▼ -21.00%
- Reading proficiency
- 57% ▼ -14.00%
- Median HH income
- $69,970
- Composite
- 45.9/100
- National rank
- #2549
- State rank
- #32 of 98 in NH
Livability — Exeter
- Score
- 91/100
- State rank
- #1
- US rank
- #59
Category grades
Schools grade is shown separately in the Schools card above.
Census & demographics
- Census place
- Exeter, NH
- County
- Rockingham County · 137,526 people
- City population
- 22,817
- Metro
- Boston-Cambridge-Newton, MA-NH
- Population (ZIP)
- 22,817
- Household income
- $119,393
- Rent vs Own
- Severe rent burden
- 485.0
Population outlook (Rockingham County) Hauer SSP2
- Today (2025)
- 316,118 people
- By 2030
- 320,929 · +1.5%
- By 2040
- 323,358 · +2.3%
- By 2050
- 314,977 · -0.4%
- By 2075
- 297,686 · -5.8%
- By 2100
- 256,363 · -18.9%
Race, ethnicity, and origin ACS 2023
- Neighborhood character
- Predominantly White (91%)
- Race & ethnicity
- White 91% Two or more races 4% Asian 3% Hispanic / Latino 2%
- Common ancestry
- Lithuanian 8% Slovak 5% Romanian 5%
- Foreign-born
- 6% · Canada, China, South Korea
- Languages at home
- 93% English-only · Spanish 2% Other Indo-European 1% German/W. Germanic 1%
Political lean MEDSL · Rockingham
- 2024 margin
- Toss-up / Even · D 48.3% · R 50.8%
- 2008→2024 swing
- -3.5pp toward R · 2008: 1.1pp · 2024: -2.4pp
- All cycles
- 2024: R+2.4 2020: D+2.1 2016: R+5.8 2012: R+4.5 2008: D+1.1
Not yet ingested
- Civics
- —
Market trends
- HPI YoY
- ▼ -202.07%
- Current HPI
- 288.0139
- Rent YoY
- —
- Metro
- Boston-Cambridge-Newton, MA-NH
- State GDP YoY
- —
- F500 in state
- 0
Price history
+142.2% since first listed5 events — show timeline
- 2026-06-04 Listed $109,000 PrimeMLS
- 2004-02-11 Sold (Public Records) $45,000 Public Records
- 2004-01-30 Sold (MLS) $45,000 PrimeMLS
- 2004-01-14 Delisted — PrimeMLS
- 2004-01-02 Listed $45,000 PrimeMLS
Property tax history
+14.3%/yrLatest (2025): $2,576 · +5.4% YoY. Source: county tax records.
Cash-flow waterfall
monthlySold comps — $/sqft
last 12 mo · ≤1 miLoading sold comps…