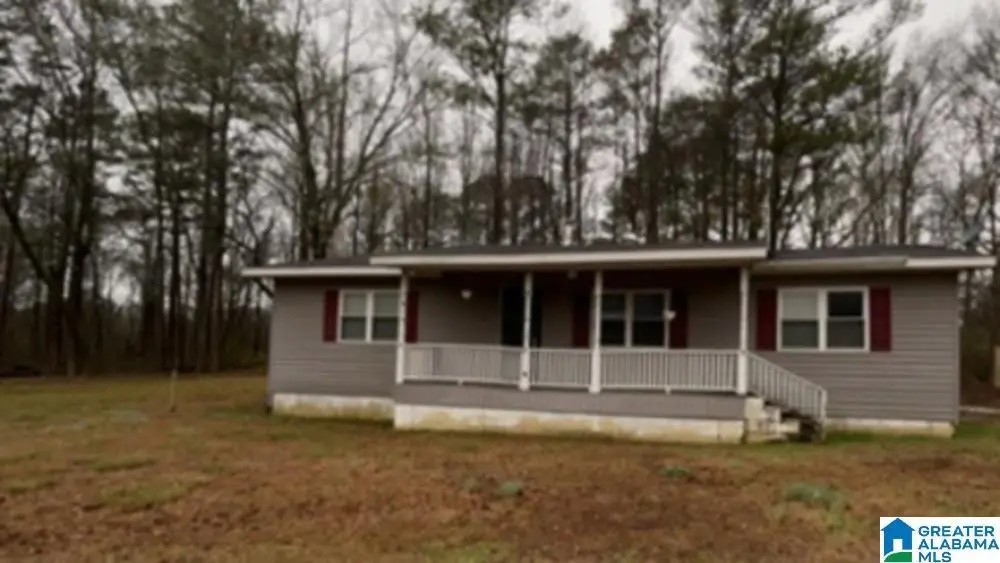
20150 Coosa County Road 29 · Weogufka, AL
Flood risk 1/10 · Minimal
- FEMA flood zone
- X (unshaded)
- Chance of flooding over 30 yrs
- 0.0%
- Est. flood insurance / yr
- $507 – $1,088
Fire risk 6/10 · Moderate
- Est. fire insurance / yr
- $916 – $1,700
Heat risk 6/10 · Moderate
- Hot days now (above 106°F)
- 7 days/yr
- Hot days in 30 yrs
- 19 days/yr
Wind risk 6/10 · Moderate
- Chance of severe wind over 30 yrs
- 50.0%
Air-quality risk 3/10 · Minor
- Unhealthy air days now
- 2 days/yr
- Unhealthy air days in 30 yrs
- 3 days/yr
Risk factors via First Street. Map © Google.
Why this score? — see what drove the B+ grade
The composite is a weighted blend of 9 inputs, each scored 0–100. Each bar is that input's sub-score; the figure is the points it added to the 100-point composite (weight × sub-score).
- Cash flow +30.0/30.0
- ARV discount +15.0/15.0
- DSCR +10.0/10.0
- 1% rule +8.7/10.0
- Appreciation +5.0/10.0
- Livability +2.6/5.0
- Rent growth +2.5/5.0
- Schools +1.5/10.0
- Condition / age +1.0/5.0
$75,000
🖨 Deal sheet 📄 Offer letter ✓ Due diligence
Listing remarks
Welcome to the country. Check out this 3 bedroom 2 bath home. Situated on 1 acre with a detached carport. This is the perfect investment home, could also be used as a first time home for someone willing to put the love and time into this home.
Key facts
- 1 acre lot
- Parking
- Built 1973
Property features AI
Finance
- Other: Property parcel ID recorded
- Financial info: Garbage fee collected monthly ($60); Down payment assistance available
Exterior
- Parking: Circular drive; Detached parking (garage or structure); Driveway parking; Unassigned and uncovered parking; One carport space
- Utilities: Public water; Septic system; Electric water heater; Internet service availability unknown
- Home design: Existing property (year built described as existing); Crawl space foundation; Siding construction (wood)
- Construction: Wood siding; Crawl space foundation
- Exterior features: Porch; Storage building; Open deck
Interior
- Kitchen: Laminate countertops; Electric stove
- Bedrooms: Multiple bedrooms on the main level including a master bedroom
- Flooring: Hardwood laminate; Vinyl
- Bathrooms: Two full bathrooms
- Heating & cooling: Central heating; Central cooling
- Interior features: Ceilings noted as 'Other (see remarks)'; No special interior features listed
- Laundry & utility: Washer hookup; Electric dryer hookup; Laundry located on the main level; Attic space present
Neighborhood map
What this means for you Summary
Snapshot
- This is a 3-bed/2.0-bath single-family listed at $75k. Condition is rated poor.
Deal economics
- At list price, monthly cash flow is $296 ($4k/yr) — positive.
- The deal already cash-flows at list — no discount required.
- Meets the 1% rule at list price ($1k rent vs $75k).
- Recommended offer: $73k (3.0% below list) — sets the bar for market timing.
Location & tenants
- Location reads 52/100 on livability (#504 in AL) — a working-class tenant base; expect higher turnover. Strengths: cost of living A+, housing A+, crime A; Watch: amenities F, commute F, employment F.
- Coosa County (rural): math 6% / reading 30% proficiency, ranked #110 of 129 in AL (top 85%) — low school quality limits family demand, transient renter base, plan for 1-2y turnover; 67% free/reduced lunch — lower-income household profile, screen leases tightly.
- Zoned schools: Central Elementary School (math 7% / reading 29%, grade F, #481 of 627 statewide, top 77%, 443 students, 67% FRL); Central High School (math 2% / reading 32%, grade F, #190 of 305 statewide, top 63%, 362 students, 59% FRL) — zoned schools at 63% FRL track the district average.
- Market conditions: 6 active listings in the ZIP.
Forward outlook
- In year one you build about $3k of equity ($519 loan paydown + $2k appreciation (3.0% local appreciation)).
- Coosa County population projected at -44% by 2050 — secular population decline; favor cash flow + early exit over multi-decade hold.
- At projected returns (3.0% appreciation + 3.0% rent growth), your $21k cash investment doubles in ~4 years — after that, you're playing with house money.
Negotiation context
- It's been on market 53 days — a 3% lower offer ($73k) is reasonable based on typical stale-listing flexibility.
Risks & watch-outs
- Climate carrying-cost: major wind risk, 50% chance of damaging wind over 30y; major wildfire risk; extreme-heat days projected 7→19/yr by 2055 (HVAC capex compounding) — expect insurance premiums to compound above CPI over the hold.
Questions for the listing agent
- It's been on market 53 days. Have you received any prior offers? Is the seller open to a 3% concession, seller financing, or rate buy-down credit?
- Have any recent inspections been done? Can we get a copy of the seller's disclosures and any deferred-maintenance estimates?
- Built in 1973 — when were the roof, HVAC, electrical panel, plumbing, and water heater last replaced?
- Is there a deadline driving the sale (1031 exchange, divorce, estate, relocation)? That informs how much negotiation room exists.
- Schools are F-rated, which usually means shorter tenancies and higher turnover. Who's the typical renter profile here, and what's been the actual vacancy rate?
- What's the average days-on-market for RENTAL listings here right now (not sales)? A rising rental-DOM trend means longer vacancies and softer asking-rent achievability than the comps imply.
- What's the recent tenant-quality profile in this submarket — average credit score on applications, eviction rate, late-payment / NSF rate, and stable-employment percentage? A property-management company in the area should have these aggregated.
- How much new for-sale + rental construction is in the pipeline within 1–3 miles? Heavy new supply typically softens prices + rents 12–24 months out; constrained supply supports both.
Investment metrics
- 1% rule
- 1.37% ✓
- Cap rate
- 11.03%
- Cash-on-cash
- 16.92%
- DSCR
- 1.75
- GRM
- 6.1
CMA / ARV
- ARV (median comp)
- $138,966
- List price
- $75,000
- Delta
- -46.03%
- Verdict
- UNDERPRICED
- Comps
- 2 within 1.0 mi
Show comp detail 1 sale within ~0.75 mi
| Address | Dist | Beds/Ba | Sqft | Sold | Price | $/sf | Match |
|---|---|---|---|---|---|---|---|
| 142 Mack Miller Dr | 0.00mi | 3/2.0 | 1,398 (+12%) | 15mo | $170,100 | $122 | 67 |
Match score weights: distance 35% · size 25% · config 20% · recency 20%. Top-matched comps best support the ARV.
Projected returns pro-forma
3.0% appreciation · 3.0% rent growth · sell at horizon
- IRR
- 23.4%
- Equity multiple
- 2.33×
- Total profit
- $27,910
- Equity at exit
- $33,723
- IRR
- 24.3%
- Equity multiple
- 4.47×
- Total profit
- $72,959
- Equity at exit
- $51,972
Cash invested: $21,000 (down + closing). Projections, not guarantees.
Landlord ↔ Tenant lean methodology
- Overall (STATE)
- 90 Strongly Landlord-Friendly
- State Alabama
- 90 Strongly Landlord-Friendly · R+15
- County
- — inherits STATE
- City
- — inherits STATE
ZIP-level market 35183
- Active inventory
- 6
- Price-to-rent
- 6.1×
Monthly cashflow live
- Estimated rent
- $1,031 medium interval (Pro) →
- Mortgage (P&I)
- −$393
- Tax est. 1.5%
- −$94 /mo · $1,125/yr
- Insurance
- −$31
- HOA
- −$0
- Vacancy / Maint / Mgmt
- −$216
- Net cashflow
- $296
Break-even live
UW: 25.0% down · 7.5% · 30yr · 1.5% tax · 5.0% vac · 8.0% maint · 8.0% mgmt
Financing live
Cash to close
- Down payment
- $18,750
- Closing costs
- $2,250
- Reserves months
- —
- Total cash needed
- —
Loan-product check · same deal, 3 products live
Conventional
25% down · 7.5% · 30yr
- Down + closing
- —
- Monthly P&I
- —
- Monthly cashflow
- —
- DSCR
- —
- Eligible?
- —
Personal DTI + credit; lowest rate.
DSCR
20% down · 8.5% · 30yr
- Down + closing
- —
- Monthly P&I
- —
- Monthly cashflow
- —
- DSCR
- —
- Eligible?
- —
No personal income docs; deal must DSCR.
Hard money
10% down · 12.0% · 12mo
- Down + closing
- —
- Monthly P&I
- —
- Monthly cashflow
- —
- DSCR
- —
- Eligible?
- —
Short-term bridge; refi at stabilization.
Listing history 17 events
-
2026-06-19days on market $75,000 Active 53 DOM
-
2026-06-18days on market $75,000 Active 52 DOM
-
2026-06-17days on market $75,000 Active 51 DOM
-
2026-06-16days on market $75,000 Active 50 DOM
-
2026-06-15days on market $75,000 Active 49 DOM
-
2026-06-14days on market $75,000 Active 47 DOM
-
2026-06-12days on market $75,000 Active 46 DOM
-
2026-06-09pricedays on market $75,000 Active 43 DOM
-
2026-06-08days on market $80,000 Active 42 DOM
-
2026-06-07days on market $80,000 Active 41 DOM
-
2026-06-07days on market $80,000 Active 40 DOM
-
2026-06-04days on market $80,000 Active 37 DOM
-
2026-06-02days on market $80,000 Active 36 DOM
-
2026-06-01days on market $80,000 Active 35 DOM
-
2026-05-31days on market $80,000 Active 34 DOM
-
2026-05-31days on market $80,000 Active 33 DOM
-
2026-04-22$80,000 Active 243-char remark
ⓘ Source: listings_history table (triggers on properties + properties_extension) + one-shot
backfill from property_details.listing_events for pre-trigger history.
Climate risk First Street
- Flood 1/10 Low FEMA zone X (unshaded) · 0% chance over 30 yrs
- Wildfire 6/10 Major
- Heat 6/10 Major 7 d/yr ≥106°F today · 19 d/yr by 30 yrs out
- Wind 6/10 Major 50% chance of damaging wind over 30 yrs
- Air quality 3/10 Moderate 2 unhealthy d/yr today · 3 by 30 yrs out
Nearby sold comps map
Loading sold comps map…
Walkable amenities ~0.75 mi
Loading nearby amenities…
Taxation est. · year 1
- Rental income
- $12,371
- − Mortgage interest
- −$4,201
- − Property taxes
- −$1,125
- − Insurance
- −$375
- − Repairs & maintenance
- −$990
- − Management
- −$990
- − Depreciation
- −$2,182
- Taxable income
- $2,509
- Est. tax owed @ 24.0%
- −$602
- After-tax cash flow
- $2,951/yr
For passive investors: Depreciation is non-cash, so a rental often shows a tax loss while cash-flowing — sheltering income. Rental losses are passive: they offset passive income freely, and up to $25,000/yr can offset ordinary (W-2) income if you actively participate and your MAGI is under $100k (phasing out to $0 by $150k); unused losses carry forward. On sale, claimed depreciation is recaptured at up to 25%, and gains may owe capital-gains tax (a 1031 exchange can defer both). Figures are a year-1 estimate at your 24.0% rate — not tax advice; consult a CPA.
Condition & rehab AI · 3 photos
This property requires extensive repairs and updates to bring it up to a livable condition. Significant structural and aesthetic improvements are needed to increase its resale and rental value.
Repairs flagged
- Major exterior siding — Significant peeling and damage to the exterior siding.
- Major interior walls — Severe damage and peeling paint on interior walls.
- Major flooring — Damaged and in need of replacement.
- Major roof — Significant wear and potential leaks.
- Major HVAC/mechanicals — No visible signs, but likely in need of repair or replacement.
- Major landscaping — Minimal and overgrown vegetation, requiring significant landscaping work.
Value-add opportunities
- Both exterior siding replacement — Improves curb appeal and structural integrity.
- Both interior wall repairs and painting — Enhances interior aesthetics and value.
- Both flooring replacement — Improves living conditions and resale value.
- Both roof repair or replacement — Prevents leaks and structural damage.
- Both HVAC system replacement — Improves comfort and energy efficiency.
- Both landscaping and curb appeal improvements — Enhances overall property value and appeal.
Renovation cost estimate screening
| Repair item | Severity | Est. cost |
|---|---|---|
| exterior siding · Significant peeling and damage to the exterior siding. | Major | $15,000–50,000 |
| interior walls · Severe damage and peeling paint on interior walls. | Major | $15,000–50,000 |
| flooring · Damaged and in need of replacement. | Major | $15,000–50,000 |
| roof · Significant wear and potential leaks. | Major | $15,000–50,000 |
| HVAC/mechanicals · No visible signs, but likely in need of repair or replacement. | Major | $15,000–50,000 |
| landscaping · Minimal and overgrown vegetation, requiring significant landscaping work. | Major | $15,000–50,000 |
| Total estimated repair cost · 6 items | $90,000–300,000 |
Value-add ROI direction
- Both exterior siding replacement — Improves curb appeal and structural integrity. ↑
- Both interior wall repairs and painting — Enhances interior aesthetics and value. ↑
- Both flooring replacement — Improves living conditions and resale value. ↑
- Both roof repair or replacement — Prevents leaks and structural damage. ↑
- Both HVAC system replacement — Improves comfort and energy efficiency. ↑
- Both landscaping and curb appeal improvements — Enhances overall property value and appeal. ↑
ⓘ Cost ranges are severity-bucket heuristics (US national rule-of-thumb). Get contractor quotes + a written scope before underwriting a rehab budget.
Schools (NCES district)
- District
- Coosa County
- NCES district ID
- 0100900
- Math proficiency
- 6% ▼ -23.00%
- Reading proficiency
- 30% ▼ -4.00%
- Median HH income
- $34,909
- Composite
- 14.72/100
- National rank
- #9397
- State rank
- #110 of 129 in AL
Livability — Weogufka
- Score
- 52/100
- State rank
- #504
- US rank
- #24945
Category grades
Schools grade is shown separately in the Schools card above.
Census & demographics
- Population (ZIP)
- 984
Population outlook (Coosa County) Hauer SSP2
- Today (2025)
- 8,898 people
- By 2030
- 7,964 · -10.5%
- By 2040
- 6,286 · -29.4%
- By 2050
- 4,978 · -44.1%
- By 2075
- 3,255 · -63.4%
- By 2100
- 2,832 · -68.2%
Race, ethnicity, and origin ACS 2023
- Neighborhood character
- Predominantly White (87%)
- Race & ethnicity
- White 87% Two or more races 10% Hispanic / Latino 3% Native American 1%
- Common ancestry
- Serbian 8%
- Foreign-born
- 1%
- Languages at home
- 99% English-only · Spanish 1%
Political lean MEDSL · Coosa
- 2024 margin
- Solid R (+43.3) · D 28.1% · R 71.4%
- 2008→2024 swing
- -25.8pp toward R · 2008: -17.5pp · 2024: -43.3pp
- All cycles
- 2024: R+43.3 2020: R+33.5 2016: R+30.6 2012: R+16.0 2008: R+17.5
Not yet ingested
- Civics
- —
Market trends
- HPI YoY
- —
- Current HPI
- —
- Rent YoY
- —
- Metro
- —
- State GDP YoY
- ▲ 2.94%
- F500 in state
- 4
Industry mix (Fortune 500 HQ in AL)
| Industry | F500 HQs | Revenue |
|---|---|---|
| Financial Services | 1 | $8B |
|
||
| Healthcare | 1 | $5B |
|
||
Price history
-6.2% since first listed2 events — show timeline
- 2026-06-09 Price Changed $75,000 Greater Alabama MLS
- 2026-04-22 Listed $80,000 Greater Alabama MLS
Cash-flow waterfall
monthlySold comps — $/sqft
last 12 mo · ≤1 miLoading sold comps…