 🏗️ New Construction
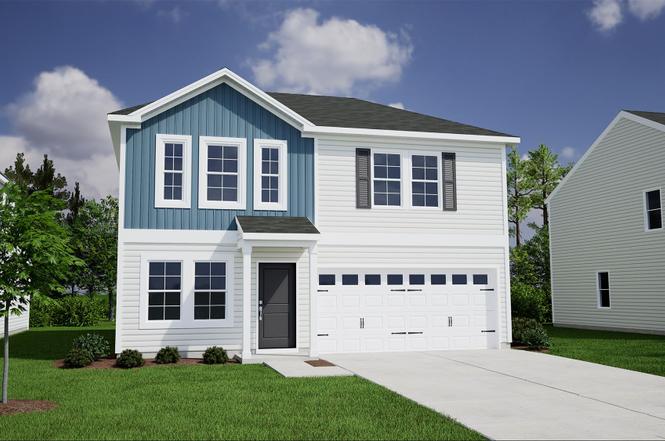
Lancaster Plan · Ridgeland, SC
Flood risk 1/10 · Minimal
- FEMA flood zone
- X (unshaded)
- Chance of flooding over 30 yrs
- 0.0%
- Est. flood insurance / yr
- $507 – $1,088
Fire risk 7/10 · Major
- Est. fire insurance / yr
- $783 – $1,453
Heat risk 9/10 · Severe
- Hot days now (above 109°F)
- 7 days/yr
- Hot days in 30 yrs
- 17 days/yr
Wind risk 8/10 · Major
- Chance of severe wind over 30 yrs
- 96.0%
Air-quality risk 2/10 · Minimal
- Unhealthy air days now
- 2 days/yr
- Unhealthy air days in 30 yrs
- 2 days/yr
Risk factors via First Street. Map © Google.
Why this score? — see what drove the D- grade
The composite is a weighted blend of 9 inputs, each scored 0–100. Each bar is that input's sub-score; the figure is the points it added to the 100-point composite (weight × sub-score).
- Appreciation +10.0/10.0
- ARV discount +7.5/15.0
- Cash flow +6.3/30.0
- Livability +3.4/5.0
- Rent growth +2.5/5.0
- Condition / age +2.5/5.0
- 1% rule +1.5/10.0
- Schools +1.4/10.0
- DSCR +0.7/10.0
$320,500
🖨 Deal sheet (PDF) 📄 Offer letter ✓ Due diligence
Listing remarks
This two-story home includes four bedrooms and two-and-one-half bathrooms. The entrance from the attached two-car garage leads to the kitchen and eat-in, which also connects to the great room. Near the front door is a flex space that you can convert into an office, guest suite, or dining room. Upstairs, the primary bedroom leads to a primary bathroom with two linen closets, access to a large walk-in clothes closet, and multiple options for reconfiguration. The laundry room is conveniently located just outside the primary bedroom, close to the three spare bedrooms and their full bathroom.
Key facts
- Listed 257 days
Property features AI
Finance
- Financial info: List price: $318,500
Exterior
- Home design: Single-family plan: Lancaster; Address: Ridgeland, SC (241 Aviation Dr)
- Exterior features: Living area of 2,152 (listed)
Interior
- Bedrooms: 4 bedrooms
- Bathrooms: 2 full bathrooms and 1 half bathroom (2.5 total)
- Interior features: Active new construction plan (Lancaster)
Neighborhood map
What this means for you Summary
Snapshot
- This is a 4-bed/2.5-bath single-family listed at $320k.
Deal economics
- At list price, monthly cash flow is $-677 ($-8k/yr) — negative.
- To cash-flow at today's rent, offer at most $287k (10.4% below list).
- To meet the 1% rule (rent ≥ 1% of price), the offer needs to be $251k (21.6% below list).
- Recommended offer: $251k (21.6% below list) — sets the bar for 1% rule.
Location & tenants
- Location reads 68/100 on livability (#81 in SC) — a middle-class / working-renter tenant base. Strengths: cost of living A+, health & safety A+, housing B+; Watch: crime D-, amenities F, commute F.
- Jasper 01 (rural): math 12% / reading 22% proficiency, ranked #77 of 80 in SC (top 96%) — low school quality limits family demand, transient renter base, plan for 1-2y turnover; 78% free/reduced lunch — lower-income household profile, screen leases tightly.
- Zoned schools: Ridgeland Elementary (math 17% / reading 17%, grade F, #515 of 597 statewide, top 89%, 829 students, 100% FRL); Hardeeville-Ridgeland Middle (math 8% / reading 17%); Ridgeland Secondary Academy of Excellence (math 17% / reading 57%, grade F, #183 of 196 statewide, top 94%, 639 students, 100% FRL) — zoned schools average 100% FRL vs 78% district-wide (22 pts higher); higher-poverty schools than district average — tighter screening recommended.
- Market conditions: 359 active listings in the ZIP; 1,385 units permitted in Jasper County in 2024 (0 in 5+ unit buildings).
- At $2,513/mo this rent would consume 62% of the median local household income ($49k/yr) (locally 395% of renters already pay >50% of income on rent) — very limited rent-growth headroom before tenants either downsize or default.
Forward outlook
- In year one you build about $41k of equity ($3k loan paydown + $39k appreciation (10.0% local appreciation)).
- Jasper County population projected at +46% by 2050 — long-run rental-demand tailwind backs the buy-and-hold thesis.
- By year 2, paydown + projected appreciation supports a ~$66k cash-out refi (75% LTV) — recoverable capital for the next deal without selling this one.
Negotiation context
- It's been on market 257 days — a 12% lower offer ($282k) is reasonable based on typical stale-listing flexibility.
Risks & watch-outs
- Climate carrying-cost: severe wind risk, 96% chance of damaging wind over 30y; major wildfire risk; extreme-heat days projected 7→17/yr by 2055 (HVAC capex compounding) — expect insurance premiums to compound above CPI over the hold.
Questions for the listing agent
- What do current leases actually rent for vs. the listed asking? Can we see a recent rent roll and the last 12 months of T-12 income?
- It's been on market 257 days. Have you received any prior offers? Is the seller open to a 22% concession, seller financing, or rate buy-down credit?
- Why hasn't it sold? Are there any deal-killer items the seller is aware of (foundation, flood, title, zoning, code violations)?
- Is there a deadline driving the sale (1031 exchange, divorce, estate, relocation)? That informs how much negotiation room exists.
- Schools are F-rated, which usually means shorter tenancies and higher turnover. Who's the typical renter profile here, and what's been the actual vacancy rate?
- Crime grade is D in this area — have there been break-ins, vandalism, or insurance claims at this property in the last 3 years? What carrier currently insures it and at what premium?
- The area grade is low — what's the realistic commute time and amenity access for the typical tenant pool here? Any planned neighborhood developments (good or bad) we should know about?
- What's the average days-on-market for RENTAL listings here right now (not sales)? A rising rental-DOM trend means longer vacancies and softer asking-rent achievability than the comps imply.
- What's the recent tenant-quality profile in this submarket — average credit score on applications, eviction rate, late-payment / NSF rate, and stable-employment percentage? A property-management company in the area should have these aggregated.
- How much new for-sale + rental construction is in the pipeline within 1–3 miles? Heavy new supply typically softens prices + rents 12–24 months out; constrained supply supports both.
Investment metrics
- 1% rule
- 0.65% ✗
- Cap rate
- 4.19%
- Cash-on-cash
- -7.53%
- DSCR
- 0.67
- GRM
- 12.8
CMA / ARV
- ARV (on-the-fly)
- $385,208
- Comps found
- 3
Show comp detail 3 sales within ~0.75 mi
| Address | Dist | Beds/Ba | Sqft | Sold | Price | $/sf | Match |
|---|---|---|---|---|---|---|---|
| 462 Aviation Dr | 0.09mi | 5/2.5 (+1) | 2,237 (+4%) | 5mo | $401,190 | $179 | 80 |
| 22 Concourse Dr | 0.12mi | 4/2.5 | 1,973 (-8%) | 0mo | $337,700 | $171 | 80 |
| 426 Aviation Dr | 0.07mi | 4/2.5 | 2,436 (+13%) | 5mo | $440,107 | $181 | 71 |
Match score weights: distance 35% · size 25% · config 20% · recency 20%. Top-matched comps best support the ARV.
Projected returns pro-forma
10.0% appreciation · 3.0% rent growth · sell at horizon
- IRR
- 19.0%
- Equity multiple
- 2.55×
- Total profit
- $166,737
- Equity at exit
- $347,026
- IRR
- 17.5%
- Equity multiple
- 5.87×
- Total profit
- $524,978
- Equity at exit
- $748,374
Cash invested: $107,858 (down + closing). Projections, not guarantees.
Landlord ↔ Tenant lean methodology
- Overall (STATE)
- 90 Strongly Landlord-Friendly
- State South Carolina
- 90 Strongly Landlord-Friendly · R+6
- County
- — inherits STATE
- City
- — inherits STATE
ZIP-level market 29936
- Home prices YoY
- 33.1%
- Active inventory
- 359
- Price-to-rent
- 10.6×
Monthly cashflow live
- Estimated rent
- $2,513 medium interval (Pro) →
- Mortgage (P&I)
- −$2,020
- Tax est. 1.5%
- −$482 /mo · $5,778/yr
- Insurance
- −$161
- HOA
- −$0
- Vacancy / Maint / Mgmt
- −$528
- Net cashflow
- $-677
Break-even live
Sensitivity live
| Price | -10% $-410 | -5% $-544 | +0% $-677 | +5% $-810 | +10% $-943 |
|---|---|---|---|---|---|
| Rent | -10% $-875 | -5% $-776 | +0% $-677 | +5% $-577 | +10% $-478 |
| Rate | -1.0pp $-483 | -0.5pp $-579 | base $-677 | +0.5pp $-776 | +1.0pp $-878 |
UW: 25.0% down · 7.5% · 30yr · 1.5% tax · 5.0% vac · 8.0% maint · 8.0% mgmt
Financing live
Cash to close
- Down payment
- $96,302
- Closing costs
- $11,556
- Reserves months
- —
- Total cash needed
- —
Loan-product check · same deal, 3 products live
Conventional
25% down · 7.5% · 30yr
- Down + closing
- —
- Monthly P&I
- —
- Monthly cashflow
- —
- DSCR
- —
- Eligible?
- —
Personal DTI + credit; lowest rate.
DSCR
20% down · 8.5% · 30yr
- Down + closing
- —
- Monthly P&I
- —
- Monthly cashflow
- —
- DSCR
- —
- Eligible?
- —
No personal income docs; deal must DSCR.
Hard money
10% down · 12.0% · 12mo
- Down + closing
- —
- Monthly P&I
- —
- Monthly cashflow
- —
- DSCR
- —
- Eligible?
- —
Short-term bridge; refi at stabilization.
Listing history 16 events
-
2026-06-21days on market $320,500 Active 257 DOM
-
2026-06-18days on market $320,500 Active 254 DOM
-
2026-06-17days on market $320,500 Active 253 DOM
-
2026-06-16days on market $320,500 Active 252 DOM
-
2026-06-15days on market $320,500 Active 251 DOM
-
2026-06-14days on market $320,500 Active 249 DOM
-
2026-06-13days on market $320,500 Active 248 DOM
-
2026-06-10days on market $320,500 Active 246 DOM
-
2026-06-09days on market $320,500 Active 245 DOM
-
2026-06-08days on market $320,500 Active 244 DOM
-
2026-06-07days on market $320,500 Active 243 DOM
-
2026-06-03pricedays on market $320,500 Active 239 DOM
-
2026-06-02days on market $318,500 Active 238 DOM
-
2026-06-01days on market $318,500 Active 237 DOM
-
2026-05-31days on market $318,500 Active 236 DOM
-
2026-05-30days on market $318,500 Active 235 DOM
ⓘ Source: listings_history table (triggers on properties + properties_extension) + one-shot
backfill from property_details.listing_events for pre-trigger history.
Climate risk First Street
- Flood 1/10 Low FEMA zone X (unshaded) · 0% chance over 30 yrs
- Wildfire 7/10 Severe
- Heat 9/10 Extreme 7 d/yr ≥109°F today · 17 d/yr by 30 yrs out
- Wind 8/10 Severe 96% chance of damaging wind over 30 yrs
- Air quality 2/10 Low 2 unhealthy d/yr today · 2 by 30 yrs out
Nearby sold comps map
Loading sold comps map…
Walkable amenities ~0.75 mi
Loading nearby amenities…
Taxation est. · year 1
- Rental income
- $30,159
- − Mortgage interest
- −$21,578
- − Property taxes
- −$5,778
- − Insurance
- −$1,926
- − Repairs & maintenance
- −$2,413
- − Management
- −$2,413
- − Depreciation
- −$11,206
- Taxable loss
- −$15,155
- Est. tax savings @ 24.0%
- +$3,637
- After-tax cash flow
- $-4,483/yr
For passive investors: Depreciation is non-cash, so a rental often shows a tax loss while cash-flowing — sheltering income. Rental losses are passive: they offset passive income freely, and up to $25,000/yr can offset ordinary (W-2) income if you actively participate and your MAGI is under $100k (phasing out to $0 by $150k); unused losses carry forward. On sale, claimed depreciation is recaptured at up to 25%, and gains may owe capital-gains tax (a 1031 exchange can defer both). Figures are a year-1 estimate at your 24.0% rate — not tax advice; consult a CPA.
Schools (NCES district)
- District
- Jasper 01
- NCES district ID
- 4502520
- Math proficiency
- 12% ▼ -11.00%
- Reading proficiency
- 22% ▼ -5.00%
- Median HH income
- $37,878
- Composite
- 14.23/100
- National rank
- #9450
- State rank
- #77 of 80 in SC
Livability — Ridgeland
- Score
- 68/100
- State rank
- #81
- US rank
- #9324
Category grades
Schools grade is shown separately in the Schools card above.
Census & demographics
- County
- Jasper County · 26,362 people
- City population
- 14,989
- Metro
- Hilton Head Island-Bluffton, SC
- Population (ZIP)
- 14,989
- Household income
- $48,986
- Rent vs Own
- Severe rent burden
- 395.0
Population outlook (Jasper County) Hauer SSP2
- Today (2025)
- 34,428 people
- By 2030
- 37,718 · +9.6%
- By 2040
- 44,061 · +28.0%
- By 2050
- 50,302 · +46.1%
- By 2075
- 66,869 · +94.2%
- By 2100
- 110,455 · +220.8%
Race, ethnicity, and origin ACS 2023
- Neighborhood character
- Diverse neighborhood (Simpson 0.64)
- Race & ethnicity
- Black 44% White 37% Hispanic / Latino 14% Two or more races 7%
- Hispanic origin (detail)
- Mexican 9% Puerto Rican 1%
- Common ancestry
- Serbian 2% Lithuanian 1% Italian 1%
- Foreign-born
- 8% · Canada
- Languages at home
- 86% English-only · Spanish 13%
Political lean MEDSL · Jasper
- 2024 margin
- Lean R (+9.6) · D 44.7% · R 54.3% · Other 1.0%
- 2008→2024 swing
- -32.5pp toward R · 2008: 22.9pp · 2024: -9.6pp
- All cycles
- 2024: R+9.6 2020: D+0.8 2016: D+11.9 2012: D+15.6 2008: D+22.9
Not yet ingested
- Civics
- —
Market trends
- HPI YoY
- ▲ 88.70%
- Current HPI
- 356.5493
- Rent YoY
- —
- Metro
- Hilton Head Island-Bluffton, SC
- State GDP YoY
- ▲ 4.51%
- F500 in state
- 2
Industry mix (Fortune 500 HQ in SC)
| Industry | F500 HQs | Revenue |
|---|---|---|
| Packaging | 1 | $7B |
|
||
Cash-flow waterfall
monthlySold comps — $/sqft
last 12 mo · ≤1 miLoading sold comps…