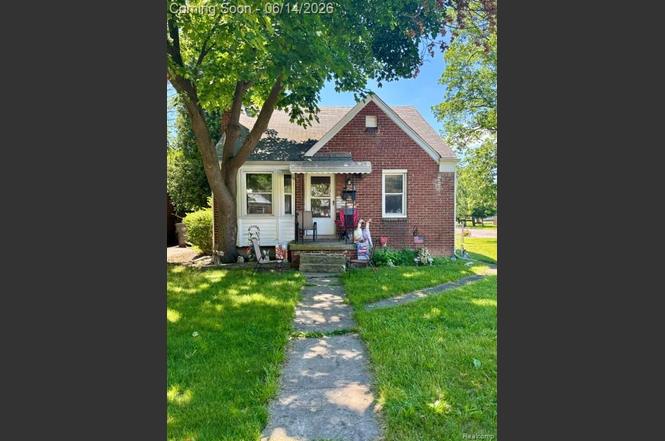
1014 Arlington St · Inkster, MI
Flood risk 1/10 · Minimal
- FEMA flood zone
- X (unshaded)
- Chance of flooding over 30 yrs
- 0.0%
- Est. flood insurance / yr
- $507 – $1,088
Fire risk 1/10 · Minimal
- Est. fire insurance / yr
- $784 – $1,456
Heat risk 3/10 · Minor
- Hot days now (above 98°F)
- 7 days/yr
- Hot days in 30 yrs
- 15 days/yr
Wind risk 2/10 · Minimal
- Chance of severe wind over 30 yrs
- —
Air-quality risk 2/10 · Minimal
- Unhealthy air days now
- 1 days/yr
- Unhealthy air days in 30 yrs
- 2 days/yr
Risk factors via First Street. Map © Google.
Why this score? — see what drove the B grade
The composite is a weighted blend of 9 inputs, each scored 0–100. Each bar is that input's sub-score; the figure is the points it added to the 100-point composite (weight × sub-score).
- Cash flow +30.0/30.0
- ARV discount +15.0/15.0
- DSCR +10.0/10.0
- 1% rule +9.0/10.0
- Livability +3.4/5.0
- Rent growth +3.2/5.0
- Condition / age +2.5/5.0
- Schools +0.7/10.0
- Appreciation +0.0/10.0
$105,000
🖨 Deal sheet 📄 Offer letter ✓ Due diligence
Listing remarks MLS
WELCOME HOME TO THIS BRICK BUNGALOW SITUATED ON A CORNER LOT. THIS HOME FEATURES 3 BEDROOMS WITH ONE LARGE PRIMARY BEDROOM UPSTAIRS AND 2 REMAINING BEDROOMS ON MAIN LEVEL, 1 BATHROOM ON MAIN LEVEL, DINING AREA ADJACENT TO KITCHEN, MICHIGAN BASEMENT WHICH IS PERFECT FOR EXTRA STORAGE SPACE AND A FENCED BACK YARD. PUT YOUR OWN TOUCH ON THIS HOUSE AND CALL IT HOME! * * Newer Furnace * * Schedule your private your today!
Key facts
- Brick bungalow
- Fenced back yard
- Dining area
Tags
Property features AI
Exterior
- Utilities: Natural gas heat (forced air); Public water
- Home design: Residential 1 1/2-story home; Built in 1943; Basement entry level
- Construction: Basement foundation; Brick construction
- Exterior features: Brick exterior; Paved street access; Frontage approximately 45 feet
Interior
- Kitchen: Kitchen on entry level (approx. 7 x 12); Dining area on entry level (approx. 7 x 9)
- Bedrooms: Primary bedroom on second level (approx. 11 x 15); Second bedroom on entry level (approx. 11 x 10); Third bedroom on entry level (approx. 10 wide)
- Bathrooms: One full bathroom on entry level (approx. 6 x 8)
- Interior features: 7 total rooms; Unfinished basement
- Laundry & utility: Washer and dryer included
Neighborhood map
What this means for you Summary
Snapshot
- This is a 3-bed/1.0-bath single-family listed at $105k.
Deal economics
- At list price, monthly cash flow is $407 ($5k/yr) — positive.
- The deal already cash-flows at list — no discount required.
- Meets the 1% rule at list price ($1k rent vs $105k).
Location & tenants
- Location reads 67/100 on livability (#406 in MI) — a middle-class / working-renter tenant base. Strengths: commute A+, cost of living A+, housing A+; Watch: health & safety D, schools F, crime F.
- Westwood Community School District (suburban): math 6% / reading 11% proficiency, ranked #529 of 540 in MI (top 98%) — low school quality limits family demand, transient renter base, plan for 1-2y turnover; 81% free/reduced lunch — lower-income household profile, screen leases tightly.
- Market conditions: Rents rising (+3.0%/yr); 142 active listings in the ZIP; 14 comparable units currently listed for rent nearby; rentals at typical pace (median 15d on market — plan ~3-4 weeks tenant-placement turnaround); lower-income renter base — watch delinquency; 2,639 units permitted in Wayne County in 2024 (1,216 in 5+ unit buildings).
- At $1,474/mo this rent would consume 45% of the median local household income ($39k/yr) (locally 1558% of renters already pay >50% of income on rent) — very limited rent-growth headroom before tenants either downsize or default.
Forward outlook
- Local home prices are declining (-3.0%/yr); year-one equity from $726 of loan paydown is wiped out by about $3k of value loss. Plan a longer hold.
- Wayne County population projected at -17% by 2050 — secular population decline; favor cash flow + early exit over multi-decade hold.
- At projected returns (-3.0% appreciation + 3.0% rent growth), your $29k cash investment doubles in ~8 years — after that, you're playing with house money.
Negotiation context
- Only 4 days on market — expect competitive offers; lowballing is unlikely to land.
- 17 sale attempts since 13y ago with the ask held roughly flat each time — persistent listings suggest the price (not the market) is what's stuck; bring a comps-based counter.
- Current owner paid $50k; list at $105k implies a 110% gain — meaningful room to come down on a strong offer.
Risks & watch-outs
- Watch-outs: built in 1943 — expect roof / HVAC / electrical / plumbing capex.
Questions for the listing agent
- Built in 1943 — when were the roof, HVAC, electrical panel, plumbing, and water heater last replaced?
- Is there a deadline driving the sale (1031 exchange, divorce, estate, relocation)? That informs how much negotiation room exists.
- Schools are F-rated, which usually means shorter tenancies and higher turnover. Who's the typical renter profile here, and what's been the actual vacancy rate?
- Crime grade is F in this area — have there been break-ins, vandalism, or insurance claims at this property in the last 3 years? What carrier currently insures it and at what premium?
- What's the average days-on-market for RENTAL listings here right now (not sales)? A rising rental-DOM trend means longer vacancies and softer asking-rent achievability than the comps imply.
- What's the recent tenant-quality profile in this submarket — average credit score on applications, eviction rate, late-payment / NSF rate, and stable-employment percentage? A property-management company in the area should have these aggregated.
- How much new for-sale + rental construction is in the pipeline within 1–3 miles? Heavy new supply typically softens prices + rents 12–24 months out; constrained supply supports both.
Investment metrics
- 1% rule
- 1.40% ✓
- Cap rate
- 10.95%
- Cash-on-cash
- 16.62%
- DSCR
- 1.74
- GRM
- 5.9
CMA / ARV
- ARV (on-the-fly)
- $135,936
- Comps found
- 12
Show comp detail 12 sales within ~0.75 mi
| Address | Dist | Beds/Ba | Sqft | Sold | Price | $/sf | Match |
|---|---|---|---|---|---|---|---|
| 1088 Arlington St | 0.06mi | 3/1.0 | 1,076 (+1%) | 4mo | $137,500 | $128 | 92 |
| 26508 Monticello St | 0.21mi | 3/1.0 | 1,150 (+8%) | 6mo | $125,000 | $109 | 71 |
| 363 Sherbourne St | 0.50mi | 3/1.5 | 1,030 (-3%) | 1mo | $160,000 | $155 | 68 |
| 784 Patterson Ct | 0.26mi | 3/2.0 | 1,140 (+7%) | 6mo | $170,000 | $149 | 67 |
| 112 Brentwood St | 0.51mi | 3/1.0 | 994 (-6%) | 1mo | $164,000 | $165 | 65 |
| 291 Arlington St | 0.38mi | 3/1.0 | 966 (-9%) | 4mo | $139,000 | $144 | 64 |
| 26323 Kean St | 0.71mi | 3/1.0 | 1,080 (+2%) | 1mo | $130,000 | $120 | 64 |
| 1248 Colonial Dr | 0.68mi | 3/1.0 | 1,120 (+6%) | 6mo | $105,000 | $94 | 54 |
| 26280 W Hills Dr | 0.51mi | 3/1.0 | 930 (-12%) | 6mo | $87,000 | $94 | 50 |
| 622 Tromley St | 0.62mi | 3/1.0 | 960 (-10%) | 6mo | $130,000 | $135 | 50 |
| 26628 Oakland St | 0.53mi | 3/1.0 | 921 (-13%) | 6mo | $111,610 | $121 | 48 |
| 28005 Avondale St | 0.75mi | 3/1.0 | 962 (-9%) | 2mo | $107,500 | $112 | 48 |
Match score weights: distance 35% · size 25% · config 20% · recency 20%. Top-matched comps best support the ARV.
Projected returns pro-forma
-3.0% appreciation · 2.95% rent growth · sell at horizon
- IRR
- 7.7%
- Equity multiple
- 1.30×
- Total profit
- $8,884
- Equity at exit
- $15,656
- IRR
- 17.0%
- Equity multiple
- 2.39×
- Total profit
- $40,993
- Equity at exit
- $9,078
Cash invested: $29,400 (down + closing). Projections, not guarantees.
Landlord ↔ Tenant lean methodology
- Overall (STATE)
- 62 Landlord-Friendly
- State Michigan
- 62 Landlord-Friendly · EVEN
- County
- — inherits STATE
- City
- — inherits STATE
ZIP-level market 48141
- Home prices YoY
- -2.9%
- Rents YoY
- 3.0%
- Active inventory
- 142
- Price-to-rent
- 5.9×
Monthly cashflow live
- Estimated rent
- $1,474 high interval (Pro) →
- Mortgage (P&I)
- −$551
- Tax from tax record
- −$163 /mo · $1,954/yr
- Insurance
- −$44
- HOA
- −$0
- Vacancy / Maint / Mgmt
- −$310
- Net cashflow
- $407
Break-even live
UW: 25.0% down · 7.5% · 30yr · 1.5% tax · 5.0% vac · 8.0% maint · 8.0% mgmt
Financing live
Cash to close
- Down payment
- $26,250
- Closing costs
- $3,150
- Reserves months
- —
- Total cash needed
- —
Loan-product check · same deal, 3 products live
Conventional
25% down · 7.5% · 30yr
- Down + closing
- —
- Monthly P&I
- —
- Monthly cashflow
- —
- DSCR
- —
- Eligible?
- —
Personal DTI + credit; lowest rate.
DSCR
20% down · 8.5% · 30yr
- Down + closing
- —
- Monthly P&I
- —
- Monthly cashflow
- —
- DSCR
- —
- Eligible?
- —
No personal income docs; deal must DSCR.
Hard money
10% down · 12.0% · 12mo
- Down + closing
- —
- Monthly P&I
- —
- Monthly cashflow
- —
- DSCR
- —
- Eligible?
- —
Short-term bridge; refi at stabilization.
Rent comps 14 comps
| Address | Beds | Baths | Sqft | Rent | $/sqft | DOM | Units | Dist |
|---|---|---|---|---|---|---|---|---|
| 27184 Lucerne Dr Inkster, MI | 3.0 | 1.0 | 1100 | $1,250 | $1.14 | 43d | 1 | 0.36mi |
| 572 Tobin Dr Inkster, MI | 1.0–3.0 | 1.0–2.0 | 936 | $1,600 | $1.71 | 1d | 22 | 0.53mi |
| 167 Cherry Valley Dr Inkster, MI | 1.0–2.0 | 1.0 | 784 | $1,395 | $1.78 | 14d | 12 | 0.60mi |
| 26322 Westphal St Dearborn Heights, MI | 1.0–2.0 | 1.0 | 762 | $1,455 | $1.91 | 1d | 24 | 0.62mi |
| 238 Yorkshire Blvd Dearborn Heights, MI | 1.0–2.0 | 1.0 | 741 | $1,424 | $1.92 | 1d | 9 | 0.70mi |
| 1150 Magnolia Dr Inkster, MI | 3.0 | 1.0 | 900 | $1,300 | $1.44 | 24d | 1 | 0.89mi |
| 25745 Princeton St Dearborn Heights, MI | 3.0 | 1.0 | 1080 | $1,500 | $1.39 | 10d | 1 | 1.15mi |
| 641 Gilman St Garden City, MI | 3.0 | 1.0 | 1300 | $2,600 | $2.00 | 16d | 1 | 1.19mi |
| 24720 Michigan Ave Dearborn, MI | 2.0 | 1.0 | 900 | $1,350 | $1.50 | 43d | 1 | 1.24mi |
| 26742 Penn St Inkster, MI | 3.0 | 1.0 | 1000 | $1,300 | $1.30 | 16d | 1 | 1.32mi |
| 26707 Penn St Inkster, MI | 3.0 | 1.0 | 900 | $1,400 | $1.56 | 4d | 1 | 1.34mi |
| 27139 Penn St Inkster, MI | 3.0 | 1.0 | 832 | $675 | $0.81 | 17d | 1 | 1.37mi |
| 29203 Oakwood St Inkster, MI | 3.0 | 1.5 | 912 | $1,600 | $1.75 | 1d | 1 | 1.38mi |
| 3236 Walnut St Inkster, MI | 3.0 | 1.0 | 1096 | $1,495 | $1.36 | 2d | 1 | 1.46mi |
Listing history 6 events
-
2026-06-18days on market $105,000 Active 4 DOM
-
2026-06-17days on market $105,000 Active 3 DOM
-
2026-06-16days on market $105,000 Active 2 DOM
-
2026-06-15days on market $105,000 Active 1 DOM
-
2026-06-15remarks 424-char remark
-
2026-06-15$105,000 Active 2 DOM
ⓘ Source: listings_history table (triggers on properties + properties_extension) + one-shot
backfill from property_details.listing_events for pre-trigger history.
Tax reassessment forecast MI · Partial reset (capped growth)
- Current annual tax
- $1,954 · $163/mo
- Projected year-2 tax
- $1,954 · $163/mo
- Expected delta
- $0/yr ($0/mo · 0.0%)
ⓘ Screening estimate from a state-policy table — verify with the county assessor before closing.
Climate risk First Street
- Flood 1/10 Low FEMA zone X (unshaded) · 0% chance over 30 yrs
- Wildfire 1/10 Low
- Heat 3/10 Moderate 7 d/yr ≥98°F today · 15 d/yr by 30 yrs out
- Wind 2/10 Low
- Air quality 2/10 Low 1 unhealthy d/yr today · 2 by 30 yrs out
Nearby sold comps map
Loading sold comps map…
Walkable amenities ~0.75 mi
Loading nearby amenities…
Taxation est. · year 1
- Rental income
- $17,686
- − Mortgage interest
- −$5,882
- − Property taxes
- −$1,954
- − Insurance
- −$525
- − Repairs & maintenance
- −$1,415
- − Management
- −$1,415
- − Depreciation
- −$3,055
- Taxable income
- $3,441
- Est. tax owed @ 24.0%
- −$826
- After-tax cash flow
- $4,060/yr
For passive investors: Depreciation is non-cash, so a rental often shows a tax loss while cash-flowing — sheltering income. Rental losses are passive: they offset passive income freely, and up to $25,000/yr can offset ordinary (W-2) income if you actively participate and your MAGI is under $100k (phasing out to $0 by $150k); unused losses carry forward. On sale, claimed depreciation is recaptured at up to 25%, and gains may owe capital-gains tax (a 1031 exchange can defer both). Figures are a year-1 estimate at your 24.0% rate — not tax advice; consult a CPA.
Schools (NCES district)
- District
- Westwood Community School District
- NCES district ID
- 2611640
- Math proficiency
- 6% ▼ -6.00%
- Reading proficiency
- 11% ▼ -6.00%
- Median HH income
- $36,350
- Composite
- 7.06/100
- National rank
- #9967
- State rank
- #529 of 540 in MI
Livability — Inkster
- Score
- 67/100
- State rank
- #406
- US rank
- #11087
Category grades
Schools grade is shown separately in the Schools card above.
Census & demographics
- Census place
- Inkster, MI
- County
- Wayne County · 1,562,939 people
- City population
- 25,428
- Metro
- Detroit-Warren-Dearborn, MI
- Population (ZIP)
- 25,428
- Household income
- $39,252
- Rent vs Own
- Severe rent burden
- 1558.0
Population outlook (Wayne County) Hauer SSP2
- Today (2025)
- 1,675,273 people
- By 2030
- 1,620,300 · -3.3%
- By 2040
- 1,502,341 · -10.3%
- By 2050
- 1,384,039 · -17.4%
- By 2075
- 1,124,592 · -32.9%
- By 2100
- 881,193 · -47.4%
Race, ethnicity, and origin ACS 2023
- Neighborhood character
- Predominantly Black (72%)
- Race & ethnicity
- Black 72% White 17% Two or more races 7% Hispanic / Latino 2% Asian 1%
- Common ancestry
- Romanian 3% Slovak 1% Italian 1%
- Foreign-born
- 5% · Canada, China
- Languages at home
- 92% English-only · Arabic 3% Other Asian/Pacific 1% Spanish 1%
Political lean MEDSL · Wayne
- 2024 margin
- Strong D (+29.0) · D 62.7% · R 33.7% · Other 3.6%
- 2008→2024 swing
- -20.5pp toward R · 2008: 49.5pp · 2024: 29.0pp
- All cycles
- 2024: D+29.0 2020: D+38.1 2016: D+37.3 2012: D+46.9 2008: D+49.5
Not yet ingested
- Civics
- —
Market trends
- HPI YoY
- ▼ -11.74%
- Current HPI
- 390.2139
- Rent YoY
- ▲ 2.95%
- Metro
- Detroit-Warren-Dearborn, MI
- State GDP YoY
- ▲ 1.37%
- F500 in state
- 28
Industry mix (Fortune 500 HQ in MI)
| Industry | F500 HQs | Revenue |
|---|---|---|
| Automotive Parts | 3 | $48B |
|
||
| Automotive | 2 | $372B |
|
||
| Chemicals | 1 | $45B |
|
||
| Automotive Retail | 1 | $29B |
|
||
| Healthcare / Medical Devices | 1 | $23B |
|
||
| Automotive Technology | 1 | $20B |
|
||
Price history
+200.9% since first listed51 events — show timeline
- 2026-06-14 Listed $105,000 MiRealSource-MiMLS
- 2026-06-13 Coming Soon $105,000 MiRealSource-MiMLS
- 2026-06-13 Listed $105,000 REALCOMP
- 2025-06-19 Pending — REALCOMP
- 2025-03-31 Pending — MiRealSource-MiMLS
- 2025-03-30 Pending — REALCOMP
- 2025-03-30 Listing Removed — MiRealSource-MiMLS
- 2025-03-30 Listing Removed — REALCOMP
- 2025-03-30 Listing Removed — REALCOMP
- 2025-03-27 Relisted — REALCOMP
- 2025-03-27 Listing Removed — REALCOMP
- 2025-03-20 Listed $115,000 MiRealSource-MiMLS
- 2025-03-20 Listed $115,000 REALCOMP
- 2022-12-08 Listing Removed — MiRealSource-MiMLS
- 2022-12-08 Listing Removed — REALCOMP
- 2022-09-15 Price Changed $68,000 MiRealSource-MiMLS
- 2022-09-15 Price Changed $68,000 REALCOMP
- 2022-08-30 Price Changed $73,000 MiRealSource-MiMLS
- 2022-08-30 Price Changed $73,000 REALCOMP
- 2022-08-02 Price Changed $80,000 MiRealSource-MiMLS
- 2022-08-01 Price Changed $80,000 REALCOMP
- 2022-07-01 Listed $84,900 MiRealSource-MiMLS
- 2022-07-01 Listed $84,900 REALCOMP
- 2022-06-29 Coming Soon — MiRealSource-MiMLS
- 2022-06-29 Coming Soon — REALCOMP
- 2020-02-19 Sold (Public Records) $50,000 Public Records
- 2020-02-07 Sold (MLS) $50,000 MiRealSource-MiMLS
- 2020-02-07 Sold (MLS) $50,000 REALCOMP
- 2019-11-13 Pending — MiRealSource-MiMLS
- 2019-11-13 Pending — REALCOMP
- 2019-10-23 Price Changed $54,000 MiRealSource-MiMLS
- 2019-10-22 Price Changed $54,000 REALCOMP
- 2019-08-26 Listed $56,000 MiRealSource-MiMLS
- 2019-08-26 Listed $56,000 REALCOMP
- 2015-03-25 Listing Removed — MiRealSource-MiMLS
- 2015-02-24 Listing Removed — MiRealSource-MiMLS
- 2015-02-04 Listed $825 MiRealSource-MiMLS
- 2015-01-21 Listed $850 MiRealSource-MiMLS
- 2013-11-26 Sold (MLS) $20,100 REALCOMP
- 2013-11-04 Listing Removed — MiRealSource-MiMLS
- 2013-11-04 Listing Removed — REALCOMP
- 2013-09-03 Listing Removed — MiRealSource-MiMLS
- 2013-09-02 Listing Removed — REALCOMP
- 2013-07-05 Listed $26,000 REALCOMP
- 2013-07-05 Listed $26,000 MiRealSource-MiMLS
- 2013-07-04 Listed $23,900 MiRealSource-MiMLS
- 2013-07-04 Listed $23,900 REALCOMP
- 2013-06-27 Listing Removed — MiRealSource-MiMLS
- 2013-06-26 Listing Removed — REALCOMP
- 2013-03-28 Listed $34,900 REALCOMP
- 2013-03-28 Listed $34,900 MiRealSource-MiMLS
Property tax history
-0.5%/yrLatest (2025): $1,954 · +4.9% YoY. Source: county tax records.
Cash-flow waterfall
monthlySold comps — $/sqft
last 12 mo · ≤1 miLoading sold comps…