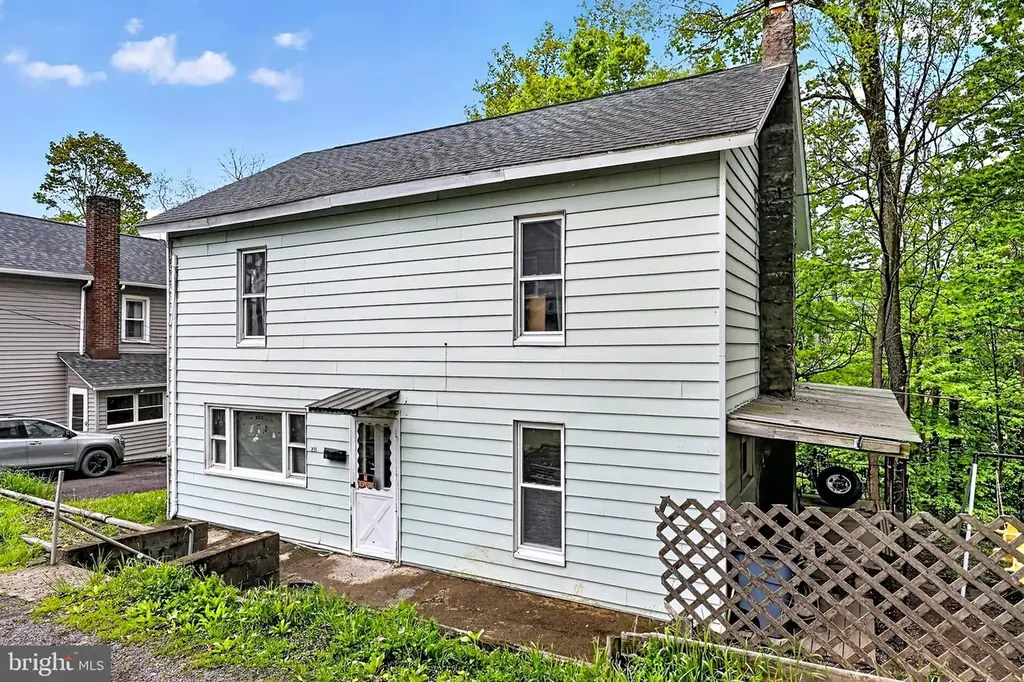
211 E Church St · Susquehanna Depot, PA
Flood risk 1/10 · Minimal
- FEMA flood zone
- X (unshaded)
- Chance of flooding over 30 yrs
- 0.0%
- Est. flood insurance / yr
- $473 – $860
Fire risk 1/10 · Minimal
- Est. fire insurance / yr
- $511 – $949
Heat risk 3/10 · Minor
- Hot days now (above 92°F)
- 7 days/yr
- Hot days in 30 yrs
- 17 days/yr
Wind risk 2/10 · Minimal
- Chance of severe wind over 30 yrs
- 2.0%
Air-quality risk 2/10 · Minimal
- Unhealthy air days now
- 0 days/yr
- Unhealthy air days in 30 yrs
- 1 days/yr
Risk factors via First Street. Map © Google.
Why this score? — see what drove the B+ grade
The composite is a weighted blend of 9 inputs, each scored 0–100. Each bar is that input's sub-score; the figure is the points it added to the 100-point composite (weight × sub-score).
- Cash flow +30.0/30.0
- 1% rule +10.0/10.0
- DSCR +10.0/10.0
- ARV discount +7.5/15.0
- Appreciation +7.5/10.0
- Schools +3.3/10.0
- Livability +3.0/5.0
- Rent growth +2.5/5.0
- Condition / age +2.5/5.0
$47,990
🖨 Deal sheet 📄 Offer letter ✓ Due diligence
Listing remarks
Located in the heart of Susquehanna, 211 E Church St offers a great opportunity for buyers looking for space, character, and long-term potential at an attractive price point. Offering over 1,600 square feet, this home features generously sized living areas, large bedrooms, high ceilings, and a traditional layout that creates a warm and inviting feel throughout. The property has seen several improvements over the years including flooring, paint, bathroom updates, and a newer roof, while still offering the opportunity for the next owner to continue making cosmetic updates and personal improvements over time. The spacious layout, natural light, and flexible room sizes provide a strong foundati
Key facts
- Several improvements
- Newer roof
- Natural light
Tags
Property features AI
Finance
- Financial info: Ownership: fee simple
Exterior
- Parking: On-street parking; Off-street parking
- Utilities: Public water; Public sewer
- Home design: Detached structure; Estimated year built; Average property condition
- Construction: Frame construction with aluminum siding; Asphalt roof; Block foundation
- Exterior features: Not in a federal flood zone; Municipal trash service available; Ground rent paid annually; Above-grade other structures
Interior
- Kitchen: Kitchenette (appliances not specified)
- Bedrooms: Four bedrooms on the main level
- Flooring: Hardwood flooring; Laminate plank flooring
- Bathrooms: One full bathroom on the main level; One full bathroom total
- Heating & cooling: Forced air heating; Oil-fired heating fuel; Ductless / mini-split cooling (electric); Circuit breaker electrical service
- Interior features: Kitchenette; Master bath(s); Other; Dry wall walls and ceilings; Full basement; One fireplace
- Laundry & utility: Hot water: electric
Neighborhood map
What this means for you Summary
Snapshot
- This is a 4-bed/1.0-bath other listed at $48k.
Deal economics
- At list price, monthly cash flow is $683 ($8k/yr) — positive.
- The deal already cash-flows at list — no discount required.
- Meets the 1% rule at list price ($1k rent vs $48k).
- Recommended offer: $47k (3.0% below list) — sets the bar for market timing.
Location & tenants
- Location reads 59/100 on livability (#1,549 in PA) — a working-class tenant base; expect higher turnover. Strengths: crime A+, cost of living A+, housing B; Watch: schools F, amenities F, commute F.
- Susquehanna Community SD (rural): math 30% / reading 50% proficiency, ranked #364 of 539 in PA (top 68%) — families likely to look elsewhere, expect single-tenant / working-renter base with shorter leases.
- Market conditions: 45 active listings in the ZIP; 80 units permitted in Susquehanna County in 2024 (5 in 5+ unit buildings).
Forward outlook
- In year one you build about $3k of equity ($332 loan paydown + $2k appreciation (5.0% local appreciation)).
- Susquehanna County population projected at -30% by 2050 — secular population decline; favor cash flow + early exit over multi-decade hold.
- At projected returns (5.0% appreciation + 3.0% rent growth), your $13k cash investment doubles in ~2 years — after that, you're playing with house money.
Negotiation context
- It's been on market 34 days — a 3% lower offer ($47k) is reasonable based on typical stale-listing flexibility.
- 6 sale attempts since 9y ago; this cycle's ask has dropped $12k (20%) from the opening price — seller is motivated, your offer sets the floor, not the list.
- Current owner paid $35k; 37% above their basis — modest negotiation headroom, anchor on the comps not their cost.
Risks & watch-outs
- Watch-outs: property tax is 2.9% of price; built in 1900 — expect roof / HVAC / electrical / plumbing capex.
Questions for the listing agent
- It's been on market 34 days. Have you received any prior offers? Is the seller open to a 3% concession, seller financing, or rate buy-down credit?
- Built in 1900 — when were the roof, HVAC, electrical panel, plumbing, and water heater last replaced?
- Property tax is high relative to price — has the assessment been appealed recently, and will the sale trigger a re-assessment?
- Is there a deadline driving the sale (1031 exchange, divorce, estate, relocation)? That informs how much negotiation room exists.
- Schools are F-rated, which usually means shorter tenancies and higher turnover. Who's the typical renter profile here, and what's been the actual vacancy rate?
- What's the average days-on-market for RENTAL listings here right now (not sales)? A rising rental-DOM trend means longer vacancies and softer asking-rent achievability than the comps imply.
- What's the recent tenant-quality profile in this submarket — average credit score on applications, eviction rate, late-payment / NSF rate, and stable-employment percentage? A property-management company in the area should have these aggregated.
- How much new for-sale + rental construction is in the pipeline within 1–3 miles? Heavy new supply typically softens prices + rents 12–24 months out; constrained supply supports both.
Investment metrics
- 1% rule
- 2.83% ✓
- Cap rate
- 23.37%
- Cash-on-cash
- 61.00%
- DSCR
- 3.71
- GRM
- 2.9
CMA / ARV
- ARV (median comp)
- $115,474
- List price
- $47,990
- Delta
- -58.44%
- Verdict
- UNDERPRICED
- Comps
- 20 within 1.0 mi
Projected returns pro-forma
5.01% appreciation · 3.0% rent growth · sell at horizon
- IRR
- 67.9%
- Equity multiple
- 5.07×
- Total profit
- $54,641
- Equity at exit
- $27,215
- IRR
- 65.8%
- Equity multiple
- 10.50×
- Total profit
- $127,674
- Equity at exit
- $46,985
Cash invested: $13,437 (down + closing). Projections, not guarantees.
Landlord ↔ Tenant lean methodology
- Overall (STATE)
- 62 Landlord-Friendly
- State Pennsylvania
- 62 Landlord-Friendly · EVEN
- County
- — inherits STATE
- City
- — inherits STATE
ZIP-level market 18847
- Home prices YoY
- 4.2%
- Active inventory
- 45
- Price-to-rent
- 2.9×
Monthly cashflow live
- Estimated rent
- $1,357 medium interval (Pro) →
- Mortgage (P&I)
- −$252
- Tax from tax record
- −$117 /mo · $1,408/yr
- Insurance
- −$20
- HOA
- −$0
- Vacancy / Maint / Mgmt
- −$285
- Net cashflow
- $683
Break-even live
UW: 25.0% down · 7.5% · 30yr · 1.5% tax · 5.0% vac · 8.0% maint · 8.0% mgmt
Financing live
Cash to close
- Down payment
- $11,998
- Closing costs
- $1,440
- Reserves months
- —
- Total cash needed
- —
Loan-product check · same deal, 3 products live
Conventional
25% down · 7.5% · 30yr
- Down + closing
- —
- Monthly P&I
- —
- Monthly cashflow
- —
- DSCR
- —
- Eligible?
- —
Personal DTI + credit; lowest rate.
DSCR
20% down · 8.5% · 30yr
- Down + closing
- —
- Monthly P&I
- —
- Monthly cashflow
- —
- DSCR
- —
- Eligible?
- —
No personal income docs; deal must DSCR.
Hard money
10% down · 12.0% · 12mo
- Down + closing
- —
- Monthly P&I
- —
- Monthly cashflow
- —
- DSCR
- —
- Eligible?
- —
Short-term bridge; refi at stabilization.
Listing history 26 events
-
2026-06-18days on market $47,990 Active 34 DOM
-
2026-06-17days on market $47,990 Active 33 DOM
-
2026-06-16days on market $47,990 Active 32 DOM
-
2026-06-15days on market $47,990 Active 31 DOM
-
2026-06-13days on market $47,990 Active 29 DOM
-
2026-06-12pricedays on market $47,990 Active 28 DOM
-
2026-06-09days on market $54,990 Active 25 DOM
-
2026-06-08days on market $54,990 Active 24 DOM
-
2026-06-08days on market $54,990 Active 23 DOM
-
2026-06-07days on market $54,990 Active 22 DOM
-
2026-06-04days on market $54,990 Active 19 DOM
-
2026-06-02days on market $54,990 Active 18 DOM
-
2026-06-01days on market $54,990 Active 17 DOM
-
2026-05-31days on market $54,990 Active 16 DOM
-
2026-05-15$59,990 Active 1323-char remark
-
2023-01-17soldstatus $35,000 Closed
-
2023-01-13status Pending
-
2022-12-16status Active
-
2022-12-16price $45,000
-
2022-10-02price $60,000
-
2022-08-24$70,000 Active
-
2018-03-30soldstatus $20,000
-
2018-03-30soldstatus $20,000
-
2017-11-07$29,900
-
2017-05-25$29,900
-
2017-05-25$29,900
ⓘ Source: listings_history table (triggers on properties + properties_extension) + one-shot
backfill from property_details.listing_events for pre-trigger history.
Tax reassessment forecast PA · Partial reset (capped growth)
- Current annual tax
- $1,408 · $117/mo
- Projected year-2 tax
- $1,408 · $117/mo
- Expected delta
- $0/yr ($0/mo · 0.0%)
ⓘ Screening estimate from a state-policy table — verify with the county assessor before closing.
Climate risk First Street
- Flood 1/10 Low FEMA zone X (unshaded) · 0% chance over 30 yrs
- Wildfire 1/10 Low
- Heat 3/10 Moderate 7 d/yr ≥92°F today · 17 d/yr by 30 yrs out
- Wind 2/10 Low 2% chance of damaging wind over 30 yrs
- Air quality 2/10 Low 0 unhealthy d/yr today · 1 by 30 yrs out
Nearby sold comps map
Loading sold comps map…
Walkable amenities ~0.75 mi
Loading nearby amenities…
Taxation est. · year 1
- Rental income
- $16,284
- − Mortgage interest
- −$2,688
- − Property taxes
- −$1,408
- − Insurance
- −$240
- − Repairs & maintenance
- −$1,303
- − Management
- −$1,303
- − Depreciation
- −$1,396
- Taxable income
- $7,947
- Est. tax owed @ 24.0%
- −$1,907
- After-tax cash flow
- $6,290/yr
For passive investors: Depreciation is non-cash, so a rental often shows a tax loss while cash-flowing — sheltering income. Rental losses are passive: they offset passive income freely, and up to $25,000/yr can offset ordinary (W-2) income if you actively participate and your MAGI is under $100k (phasing out to $0 by $150k); unused losses carry forward. On sale, claimed depreciation is recaptured at up to 25%, and gains may owe capital-gains tax (a 1031 exchange can defer both). Figures are a year-1 estimate at your 24.0% rate — not tax advice; consult a CPA.
Schools (NCES district)
- District
- Susquehanna Community SD
- NCES district ID
- 4222980
- Math proficiency
- 30% ▼ -17.00%
- Reading proficiency
- 50% ▼ -10.00%
- Median HH income
- $39,980
- Composite
- 33.46/100
- National rank
- #5458
- State rank
- #364 of 539 in PA
Livability — Susquehanna Depot
- Score
- 59/100
- State rank
- #1549
- US rank
- #20398
Category grades
Schools grade is shown separately in the Schools card above.
Census & demographics
- Census place
- Susquehanna Depot, PA
- Population (ZIP)
- 5,082
Population outlook (Susquehanna County) Hauer SSP2
- Today (2025)
- 37,552 people
- By 2030
- 35,270 · -6.1%
- By 2040
- 30,663 · -18.3%
- By 2050
- 26,492 · -29.5%
- By 2075
- 19,658 · -47.7%
- By 2100
- 15,179 · -59.6%
Race, ethnicity, and origin ACS 2023
- Neighborhood character
- Predominantly White (97%)
- Race & ethnicity
- White 97% Two or more races 2% Hispanic / Latino 1%
- Common ancestry
- Romanian 5% Lithuanian 2% Iranian 2%
- Foreign-born
- 1%
- Languages at home
- 97% English-only · German/W. Germanic 1%
Political lean MEDSL · Susquehanna
- 2024 margin
- Solid R (+44.7) · D 27.2% · R 71.9%
- 2008→2024 swing
- -33.0pp toward R · 2008: -11.7pp · 2024: -44.7pp
- All cycles
- 2024: R+44.7 2020: R+41.2 2016: R+42.9 2012: R+21.4 2008: R+11.7
Not yet ingested
- Civics
- —
Market trends
- HPI YoY
- ▲ 5.01%
- Current HPI
- 124.2656
- Rent YoY
- —
- Metro
- —
- State GDP YoY
- ▲ 1.68%
- F500 in state
- 34
Industry mix (Fortune 500 HQ in PA)
| Industry | F500 HQs | Revenue |
|---|---|---|
| Healthcare | 2 | $309B |
|
||
| Insurance | 2 | $27B |
|
||
| Telecommunications / Media | 1 | $124B |
|
||
| Industrial Distribution | 1 | $22B |
|
||
| Financial Services | 1 | $20B |
|
||
| Chemicals / Materials | 1 | $18B |
|
||
Price history
+60.5% since first listed14 events — show timeline
- 2026-06-10 Price Changed $47,990 BRIGHT MLS
- 2026-05-27 Price Changed $54,990 BRIGHT MLS
- 2026-05-15 Listed $59,990 BRIGHT MLS
- 2023-01-17 Sold (MLS) $35,000 GBAOR
- 2023-01-13 Pending — GBAOR
- 2022-12-16 Relisted — GBAOR
- 2022-12-16 Price Changed $45,000 GBAOR
- 2022-10-02 Price Changed $60,000 GBAOR
- 2022-08-24 Listed $70,000 GBAOR
- 2018-03-30 Sold (MLS) $20,000 GBAOR
- 2018-03-30 Sold (MLS) $20,000 GSBR as distributed by MLS GRID
- 2017-11-07 Listed $29,900 GBAOR
- 2017-05-25 Listed $29,900 GSBR as distributed by MLS GRID
- 2017-05-25 Listed $29,900 GBAOR
Property tax history
+1.7%/yrLatest (2026): $1,408 · +4.5% YoY. Source: county tax records.
Cash-flow waterfall
monthlySold comps — $/sqft
last 12 mo · ≤1 miLoading sold comps…