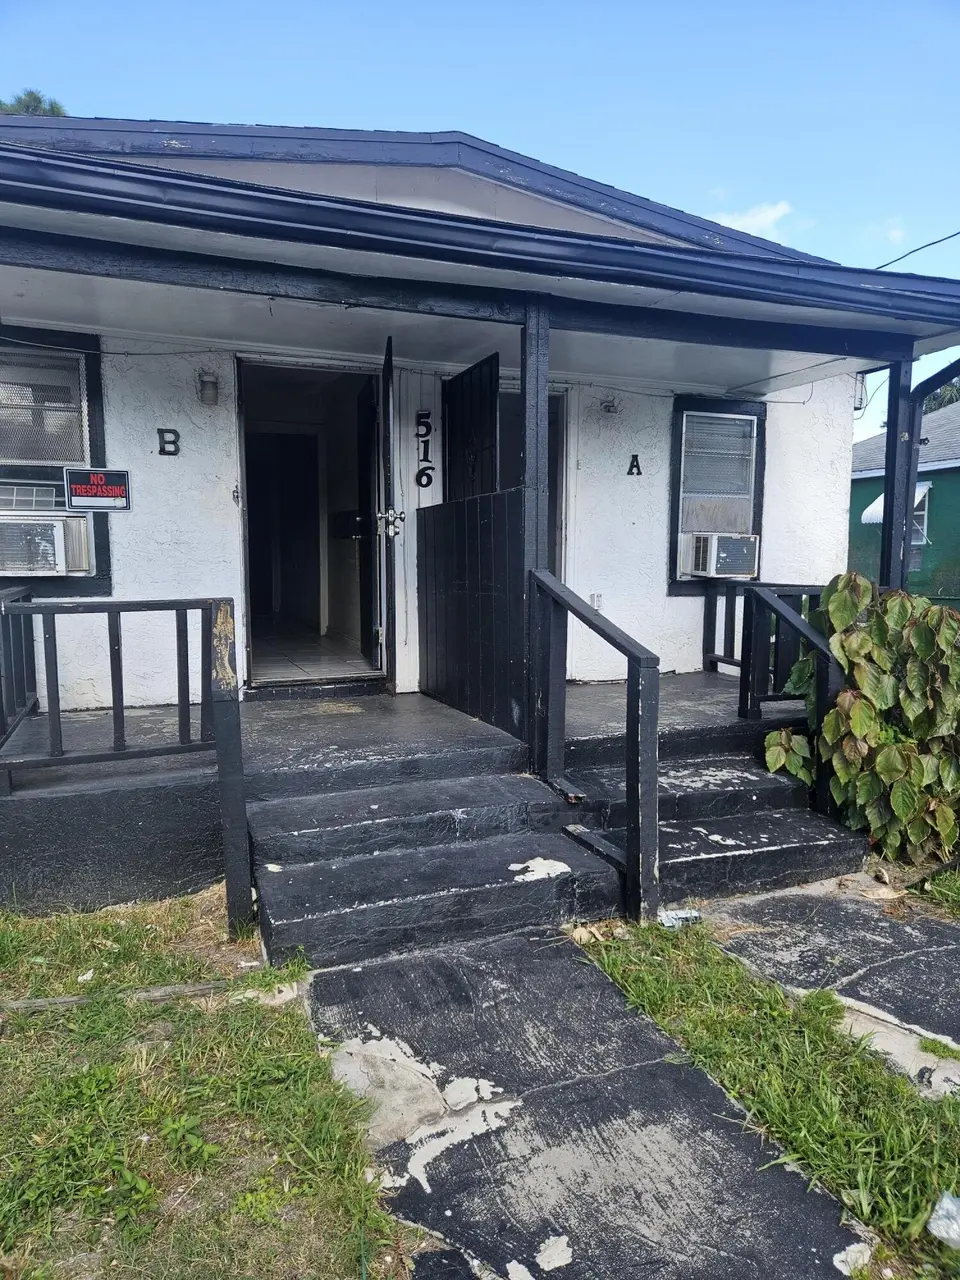
 Duplex
516 N 21st St · Fort Pierce, FL
Flood risk 6/10 · Moderate
- FEMA flood zone
- X (unshaded)
- Chance of flooding over 30 yrs
- 0.69%
- Est. flood insurance / yr
- $507 – $1,088
Fire risk 1/10 · Minimal
- Est. fire insurance / yr
- $947 – $1,759
Heat risk 10/10 · Severe
- Hot days now (above 106°F)
- 7 days/yr
- Hot days in 30 yrs
- 25 days/yr
Wind risk 10/10 · Severe
- Chance of severe wind over 30 yrs
- 99.0%
Air-quality risk 2/10 · Minimal
- Unhealthy air days now
- 2 days/yr
- Unhealthy air days in 30 yrs
- 2 days/yr
Risk factors via First Street. Map © Google.
Why this score? — see what drove the B grade
The composite is a weighted blend of 9 inputs, each scored 0–100. Each bar is that input's sub-score; the figure is the points it added to the 100-point composite (weight × sub-score).
- Cash flow +30.0/30.0
- 1% rule +10.0/10.0
- DSCR +10.0/10.0
- ARV discount +7.5/15.0
- Rent growth +4.0/5.0
- Livability +3.8/5.0
- Schools +3.7/10.0
- Condition / age +2.5/5.0
- Appreciation +0.0/10.0
$150,000
🖨 Deal sheet (PDF) 📄 Offer letter ✓ Due diligence
Multi-family units
County records classify this as Multi-Family (2-4 Unit). Listing-text estimate: 2 units. confirmed
Listing remarks
This Fort Pierce duplex is a fantastic fixer-upper opportunity with strong rental income potential. It's priced to sell and ready to welcome investors!
Key facts
- 6,650 sq ft lot
- Built 1954
- Listed 4 days
Property features AI
Finance
- Financial info: Property configured as 2 total units (2 units in community); Pets allowed with no restrictions
Exterior
- Utilities: Public water; Public sewer; Sewer and water connected; 100 Amp electric service; Two separate electric meters; One separate water meter
- Home design: Duplex; One story; Resale property
- Construction: Wood frame construction; Fiberglass roof; Slab foundation; Built area reported as 993 (building total) and living area reported as 897
- Exterior features: Back yard fencing; Asphalt road access; Not waterfront
Interior
- Flooring: Tile
- Heating & cooling: Heating present (type: other); Wall/window cooling units
- Interior features: Tile flooring; Windows with other/unspecified features
Neighborhood map
What this means for you Summary
Snapshot
- This is a 2 × 2-bed/1.0-bath units multifamily listed at $150k.
Deal economics
- At list price, monthly cash flow is $1k ($13k/yr) — positive. Per door: $554/mo.
- The deal already cash-flows at list — no discount required.
- Meets the 1% rule at list price ($3k rent vs $150k).
- Cap rate 15.2% vs local median 3.7% in Fort Pierce — top-decile yield for the area; either an underpriced asset or a hidden risk that comps aren't pricing in. Stress-test before assuming the spread holds.
Location & tenants
- Location reads 76/100 on livability (#226 in FL, #3,360 nationally) — a middle-class / working-renter tenant base. Strengths: commute A+, cost of living A+, housing A+; Watch: crime D+, schools D, amenities F.
- St. Lucie (urban): math 40% / reading 48% proficiency, ranked #51 of 73 in FL (top 70%) — families likely to look elsewhere, expect single-tenant / working-renter base with shorter leases.
- Market conditions: Rents rising fast (+5.9%/yr); 165 active listings in the ZIP; 40 comparable units currently listed for rent nearby; rentals at typical pace (median 24d on market — plan ~3-4 weeks tenant-placement turnaround); lower-income renter base — watch delinquency; 4,868 units permitted in St. Lucie County in 2024 (268 in 5+ unit buildings).
- At $2,647/mo this rent would consume 104% of the median local household income ($30k/yr) (locally 1995% of renters already pay >50% of income on rent) — very limited rent-growth headroom before tenants either downsize or default.
Forward outlook
- Local home prices are declining (-3.0%/yr); year-one equity from $1k of loan paydown is wiped out by about $4k of value loss. Plan a longer hold.
- St. Lucie County population projected at +20% by 2050 — long-run rental-demand tailwind backs the buy-and-hold thesis.
- At projected returns (-3.0% appreciation + 5.9% rent growth), your $42k cash investment doubles in ~4 years — after that, you're playing with house money.
Negotiation context
- Only 4 days on market — expect competitive offers; lowballing is unlikely to land.
Risks & watch-outs
- Watch-outs: built in 1954 — expect roof / HVAC / electrical / plumbing capex.
- Climate carrying-cost: major flood risk; severe wind risk, 99% chance of damaging wind over 30y; extreme-heat days projected 7→25/yr by 2055 (HVAC capex compounding) — expect insurance premiums to compound above CPI over the hold.
Questions for the listing agent
- Can we see the unit-by-unit rent roll, current vacancy, and any below-market leases? What's the average tenancy length?
- What capital expenditures (roof, boiler, parking lot, exteriors) have been made in the last 5 years, and what's planned in the next 2?
- Built in 1954 — when were the roof, HVAC, electrical panel, plumbing, and water heater last replaced?
- Is there a deadline driving the sale (1031 exchange, divorce, estate, relocation)? That informs how much negotiation room exists.
- Schools are D-rated, which usually means shorter tenancies and higher turnover. Who's the typical renter profile here, and what's been the actual vacancy rate?
- Crime grade is D in this area — have there been break-ins, vandalism, or insurance claims at this property in the last 3 years? What carrier currently insures it and at what premium?
- What's the average days-on-market for RENTAL listings here right now (not sales)? A rising rental-DOM trend means longer vacancies and softer asking-rent achievability than the comps imply.
- What's the recent tenant-quality profile in this submarket — average credit score on applications, eviction rate, late-payment / NSF rate, and stable-employment percentage? A property-management company in the area should have these aggregated.
- How much new apartment / multifamily construction is in the pipeline within 1–3 miles? Heavy new supply (>2% of stock underway) typically softens rents 12–24 months out; light construction supports rent growth.
Investment metrics
- 1% rule
- 1.76% ✓
- Cap rate
- 15.16%
- Cash-on-cash
- 31.68%
- DSCR
- 2.41
- GRM
- 4.7
CMA / ARV
No comps found within radius.
Projected returns pro-forma
-3.0% appreciation · 5.94% rent growth · sell at horizon
- IRR
- 29.8%
- Equity multiple
- 2.29×
- Total profit
- $54,377
- Equity at exit
- $22,365
- IRR
- 38.7%
- Equity multiple
- 5.13×
- Total profit
- $173,443
- Equity at exit
- $12,969
Cash invested: $42,000 (down + closing). Projections, not guarantees.
Landlord ↔ Tenant lean methodology
- Overall (STATE)
- 87 Strongly Landlord-Friendly
- State Florida
- 87 Strongly Landlord-Friendly · R+3
- County
- — inherits STATE
- City
- — inherits STATE
ZIP-level market 34950
- Home prices YoY
- -20.2%
- Rents YoY
- 5.9%
- Active inventory
- 165
- Price-to-rent
- 9.4×
Monthly cashflow live
- Estimated rent
- $2,647 medium interval (Pro) →
- Mortgage (P&I)
- −$787
- Tax from tax record
- −$133 /mo · $1,599/yr
- Insurance
- −$62
- HOA
- −$0
- Vacancy / Maint / Mgmt
- −$556
- Net cashflow
- $1,109
Break-even live
Sensitivity live
| Price | -10% $1,194 | -5% $1,151 | +0% $1,109 | +5% $1,066 | +10% $1,024 |
|---|---|---|---|---|---|
| Rent | -10% $900 | -5% $1,004 | +0% $1,109 | +5% $1,213 | +10% $1,318 |
| Rate | -1.0pp $1,184 | -0.5pp $1,147 | base $1,109 | +0.5pp $1,070 | +1.0pp $1,030 |
2-unit breakdown (identical units grouped — click to expand)
| Units | Beds | Baths | Est. rent |
|---|---|---|---|
| 2× units | 2 | 1 | $2,648 |
| #1 | 2 | 1 | $1,324 |
| #2 | 2 | 1 | $1,324 |
| Total (2 units) | $2,647 | ||
UW: 25.0% down · 7.5% · 30yr · 1.5% tax · 5.0% vac · 8.0% maint · 8.0% mgmt
Financing live
Cash to close
- Down payment
- $37,500
- Closing costs
- $4,500
- Reserves months
- —
- Total cash needed
- —
Loan-product check · same deal, 3 products live
Conventional
25% down · 7.5% · 30yr
- Down + closing
- —
- Monthly P&I
- —
- Monthly cashflow
- —
- DSCR
- —
- Eligible?
- —
Personal DTI + credit; lowest rate.
DSCR
20% down · 8.5% · 30yr
- Down + closing
- —
- Monthly P&I
- —
- Monthly cashflow
- —
- DSCR
- —
- Eligible?
- —
No personal income docs; deal must DSCR.
Hard money
10% down · 12.0% · 12mo
- Down + closing
- —
- Monthly P&I
- —
- Monthly cashflow
- —
- DSCR
- —
- Eligible?
- —
Short-term bridge; refi at stabilization.
Rent comps 40 comps
| Address | Beds | Baths | Sqft | Rent | $/sqft | DOM | Units | Dist |
|---|---|---|---|---|---|---|---|---|
| 907 N 20th St Apt B Fort Pierce, FL | 3.0 | 1.0 | 980 | $1,800 | $1.84 | 24d | 1 | 0.27mi |
| 1617 Avenue E Fort Pierce, FL | 3.0 | 1.0 | 1100 | $1,800 | $1.64 | 24d | 1 | 0.28mi |
| 434 N 17th St Fort Pierce, FL | 2.0 | 1.0 | 712 | $1,500 | $2.11 | 24d | 1 | 0.31mi |
| 1607 Avenue D Fort Pierce, FL | 3.0 | 2.0 | 1029 | $1,700 | $1.65 | 14d | 1 | 0.31mi |
| 1604 Avenue E Fort Pierce, FL | 2.0 | 1.0 | 713 | $1,350 | $1.89 | 14d | 1 | 0.35mi |
| 205 N 22nd St Fort Pierce, FL | 2.0 | 1.0 | 1050 | $1,500 | $1.43 | 24d | 1 | 0.38mi |
| 505 N 27th St Fort Pierce, FL | 3.0 | 1.0 | 879 | $2,660 | $3.03 | 24d | 1 | 0.40mi |
| 312 N 27th St Fort Pierce, FL | 2.0 | 1.0 | 868 | $1,600 | $1.84 | 24d | 1 | 0.45mi |
| 1405 Avenue G Apt A Fort Pierce, FL | 3.0 | 2.0 | 1064 | $2,200 | $2.07 | 24d | 1 | 0.47mi |
| 2908 Dunbar St Fort Pierce, FL | 2.0 | 1.0 | 942 | $1,300 | $1.38 | 21d | 1 | 0.54mi |
| 204 N 28th St Fort Pierce, FL | 3.0 | 2.0 | 1000 | $1,550 | $1.55 | 24d | 1 | 0.55mi |
| 136 N 15th St Unit C Fort Pierce, FL | 2.0 | 1.0 | 688 | $1,375 | $2.00 | 24d | 1 | 0.56mi |
| 2804 Avenue J Fort Pierce, FL | 3.0 | 1.0 | 816 | $2,000 | $2.45 | 14d | 1 | 0.58mi |
| 1408 N 23rd St Fort Pierce, FL | 3.0 | 1.0 | 1110 | $1,900 | $1.71 | 14d | 1 | 0.59mi |
| 508 Means Ct Unit A Fort Pierce, FL | 1.0 | 1.0 | 826 | $775 | $0.94 | 24d | 1 | 0.60mi |
| 508 Means Ct Fort Pierce, FL | 3.0 | 3.0 | 826 | $1,950 | $2.36 | 14d | 1 | 0.60mi |
| 2202 N AVE Unit A Fort Pierce, FL | 2.0 | 1.0 | 585 | $1,500 | $2.56 | 24d | 1 | 0.63mi |
| 1127 E Avenue Unit A Fort Pierce, FL | 2.0 | 1.0 | 784 | $1,800 | $2.30 | 21d | 1 | 0.67mi |
| 1601 N 17th St Fort Pierce, FL | 2.0 | 1.0 | 996 | $1,650 | $1.66 | 24d | 1 | 0.72mi |
| 1310 Atlantic Ave Unit B Fort Pierce, FL | 1.0 | 1.0 | 700 | $1,620 | $2.31 | 24d | 1 | 0.72mi |
| 1310 Atlantic Ave Unit B Fort Pierce, FL | 1.0 | 1.0 | 700 | $1,550 | $2.21 | 14d | 1 | 0.72mi |
| 321 N 11th St Unit C Fort Pierce, FL | 1.0 | 1.0 | 650 | $950 | $1.46 | 24d | 1 | 0.72mi |
| 1225 Avenue K Fort Pierce, FL | 3.0 | 1.0 | 837 | $1,700 | $2.03 | 24d | 1 | 0.72mi |
| 529 N 11th St Fort Pierce, FL | 2.0 | 2.0 | 634 | $1,200 | $1.89 | 21d | 1 | 0.73mi |
| 1610 N 25th St Unit 13 Fort Pierce, FL | 2.0 | 1.0 | 740 | $1,550 | $2.09 | 24d | 1 | 0.75mi |
| 1610 N 25th St Unit 10 Fort Pierce, FL | 2.0 | 1.0 | 740 | $1,600 | $2.16 | 24d | 1 | 0.75mi |
| 1610 N 25th St Unit 1 Fort Pierce, FL | 2.0 | 1.0 | 740 | $1,600 | $2.16 | 14d | 1 | 0.75mi |
| 1220 Avenue L Unit A Fort Pierce, FL | 3.0 | 1.0 | 850 | $1,700 | $2.00 | 24d | 1 | 0.76mi |
| 1406 Citrus Ave Fort Pierce, FL | 2.0 | 1.0 | 930 | $1,600 | $1.72 | 14d | 1 | 0.78mi |
| 1710 N 21st St Fort Pierce, FL | 3.0 | 1.0 | 968 | $2,100 | $2.17 | 14d | 1 | 0.79mi |
| 701 N 9th St Unit B Fort Pierce, FL | 2.0 | 2.0 | 740 | $1,395 | $1.89 | 24d | 1 | 0.87mi |
| 1002 Boston Ave Fort Pierce, FL | 2.0 | 1.0 | 809 | $2,000 | $2.47 | 24d | 1 | 0.97mi |
| 127 S 10th St Fort Pierce, FL | 2.0 | 1.0 | 809 | $1,800 | $2.22 | 24d | 1 | 0.97mi |
| 510 Texas Ct Fort Pierce, FL | 2.0 | 1.0 | 750 | $1,400 | $1.87 | 24d | 1 | 0.99mi |
| 3002 Avenue Q Fort Pierce, FL | 2.0 | 1.0 | 864 | $1,900 | $2.20 | 24d | 1 | 1.00mi |
| 804 Orange Ave Unit B Fort Pierce, FL | 2.0 | 1.0 | 700 | $1,350 | $1.93 | 14d | 1 | 1.04mi |
| 804 Orange Ave Unit B Fort Pierce, FL | 2.0 | 1.0 | 700 | $1,450 | $2.07 | 24d | 1 | 1.04mi |
| 624 S 12th St Unit B Fort Pierce, FL | 1.0 | 1.0 | 1000 | $1,650 | $1.65 | 14d | 1 | 1.10mi |
| 3101 Avenue T Fort Pierce, FL | 2.0 | 2.0 | 1064 | $1,980 | $1.86 | 24d | 1 | 1.16mi |
| 4005 Avenue I Unit A Fort Pierce, FL | 2.0 | 1.0 | 880 | $1,600 | $1.82 | 14d | 1 | 1.22mi |
Listing history 5 events
-
2026-06-10status $150,000 Pending 4 DOM
-
2026-06-09days on market $150,000 Active 4 DOM
-
2026-06-08days on market $150,000 Active 3 DOM
-
2026-06-07remarks 151-char remark
-
2026-06-07$150,000 Active 2 DOM
ⓘ Source: listings_history table (triggers on properties + properties_extension) + one-shot
backfill from property_details.listing_events for pre-trigger history.
Tax reassessment forecast FL · Resets to sale price
- Current annual tax
- $1,599 · $133/mo
- Projected year-2 tax
- $1,599 · $133/mo
- Expected delta
- $0/yr ($0/mo · 0.0%)
ⓘ Screening estimate from a state-policy table — verify with the county assessor before closing.
Climate risk First Street
- Flood 6/10 Major FEMA zone X (unshaded) · 69% chance over 30 yrs
- Wildfire 1/10 Low
- Heat 10/10 Extreme 7 d/yr ≥106°F today · 25 d/yr by 30 yrs out
- Wind 10/10 Extreme 99% chance of damaging wind over 30 yrs
- Air quality 2/10 Low 2 unhealthy d/yr today · 2 by 30 yrs out
Nearby sold comps map
Loading sold comps map…
Walkable amenities ~0.75 mi
Loading nearby amenities…
Taxation est. · year 1
- Rental income
- $31,764
- − Mortgage interest
- −$8,402
- − Property taxes
- −$1,599
- − Insurance
- −$750
- − Repairs & maintenance
- −$2,541
- − Management
- −$2,541
- − Depreciation
- −$4,364
- Taxable income
- $11,567
- Est. tax owed @ 24.0%
- −$2,776
- After-tax cash flow
- $10,529/yr
For passive investors: Depreciation is non-cash, so a rental often shows a tax loss while cash-flowing — sheltering income. Rental losses are passive: they offset passive income freely, and up to $25,000/yr can offset ordinary (W-2) income if you actively participate and your MAGI is under $100k (phasing out to $0 by $150k); unused losses carry forward. On sale, claimed depreciation is recaptured at up to 25%, and gains may owe capital-gains tax (a 1031 exchange can defer both). Figures are a year-1 estimate at your 24.0% rate — not tax advice; consult a CPA.
Schools (NCES district)
- District
- St. Lucie
- NCES district ID
- 1201770
- Math proficiency
- 40% ▼ -11.00%
- Reading proficiency
- 48% ▼ -4.00%
- Median HH income
- $44,737
- Composite
- 37.28/100
- National rank
- #4449
- State rank
- #51 of 73 in FL
Livability — Fort Pierce
- Score
- 76/100
- State rank
- #226
- US rank
- #3360
Category grades
Schools grade is shown separately in the Schools card above.
Census & demographics
- Census place
- Fort Pierce, FL
- County
- Saint Lucie County · 337,150 people
- City population
- 78,556
- Metro
- Port St. Lucie, FL
- Population (ZIP)
- 17,461
- Household income
- $30,400
- Rent vs Own
- Severe rent burden
- 1995.0
Population outlook (St. Lucie County) Hauer SSP2
- Today (2025)
- 338,016 people
- By 2030
- 355,687 · +5.2%
- By 2040
- 385,521 · +14.1%
- By 2050
- 406,106 · +20.1%
- By 2075
- 441,054 · +30.5%
- By 2100
- 436,885 · +29.2%
Race, ethnicity, and origin ACS 2023
- Neighborhood character
- Majority Black (63%)
- Race & ethnicity
- Black 63% Hispanic / Latino 19% White 17% Two or more races 10%
- Hispanic origin (detail)
- Mexican 10% Puerto Rican 2% Cuban 1%
- Common ancestry
- Hispanic 17% Portuguese 1%
- Foreign-born
- 23% · Canada
- Languages at home
- 69% English-only · Spanish 14% French/Haitian/Cajun 12% Other Indo-European 4%
Political lean MEDSL · St. Lucie
- 2024 margin
- Lean R (+9.1) · D 45.1% · R 54.2%
- 2008→2024 swing
- -21.2pp toward R · 2008: 12.1pp · 2024: -9.1pp
- All cycles
- 2024: R+9.1 2020: R+1.6 2016: R+2.5 2012: D+7.9 2008: D+12.1
Not yet ingested
- Civics
- —
Market trends
- HPI YoY
- ▼ -97.20%
- Current HPI
- 384.8532
- Rent YoY
- ▲ 5.94%
- Metro
- Port St. Lucie, FL
- State GDP YoY
- ▲ 3.28%
- F500 in state
- 36
Industry mix (Fortune 500 HQ in FL)
| Industry | F500 HQs | Revenue |
|---|---|---|
| Industrial Technology | 2 | $29B |
|
||
| Insurance | 2 | $17B |
|
||
| Retail | 1 | $60B |
|
||
| Technology Distribution | 1 | $58B |
|
||
| Homebuilding | 1 | $35B |
|
||
| Technology Manufacturing | 1 | $35B |
|
||
Price history
1 event — show timeline
- 2026-06-02 Listed $150,000 Beaches MLS
Property tax history
+12.7%/yrLatest (2025): $1,599 · +9.4% YoY. Source: county tax records.
Cash-flow waterfall
monthlySold comps — $/sqft
last 12 mo · ≤1 miLoading sold comps…