 Multi-family
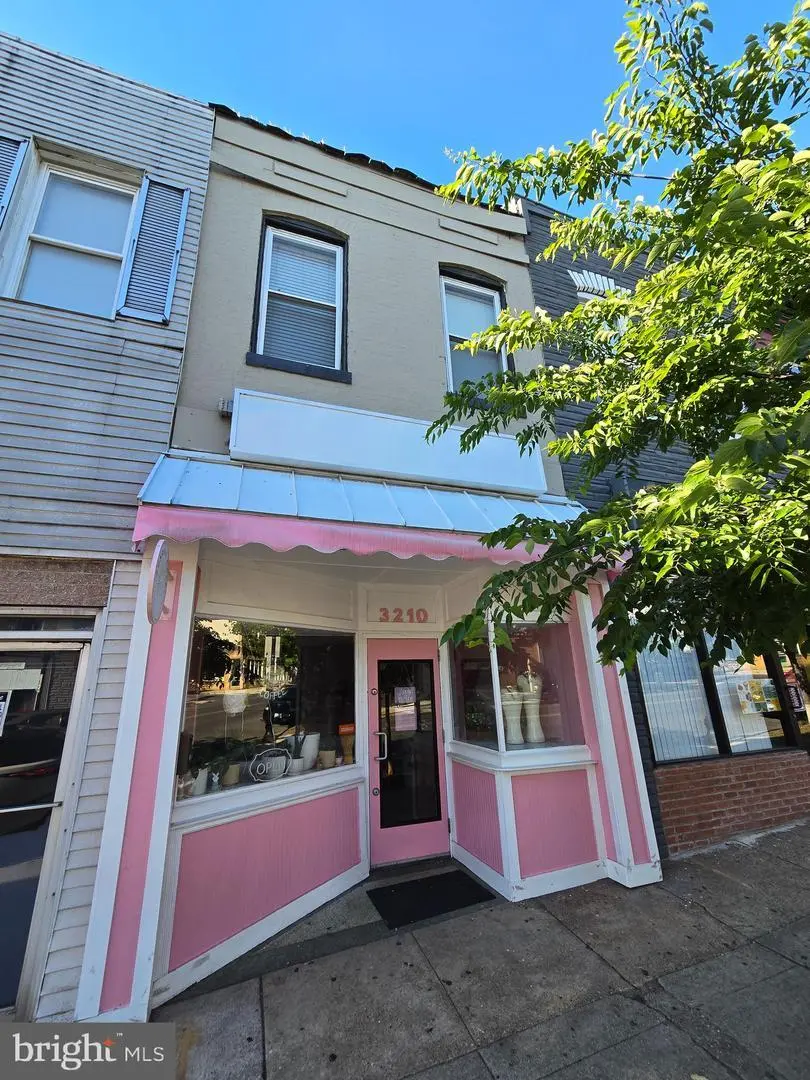
3210 Eastern Ave · Baltimore, MD
Flood risk No data
- FEMA flood zone
- —
- Chance of flooding over 30 yrs
- —
- Est. flood insurance / yr
- —
Fire risk No data
- Est. fire insurance / yr
- —
Heat risk No data
- Hot days now (above threshold)
- —
- Hot days in 30 yrs
- —
Wind risk No data
- Chance of severe wind over 30 yrs
- —
Air-quality risk No data
- Unhealthy air days now
- —
- Unhealthy air days in 30 yrs
- —
Risk factors via First Street. Map © Google.
Why this score? — see what drove the C grade
The composite is a weighted blend of 9 inputs, each scored 0–100. Each bar is that input's sub-score; the figure is the points it added to the 100-point composite (weight × sub-score).
- Cash flow +26.0/30.0
- DSCR +8.8/10.0
- ARV discount +7.5/15.0
- 1% rule +6.9/10.0
- Livability +3.8/5.0
- Rent growth +2.8/5.0
- Condition / age +2.2/5.0
- Schools +1.0/10.0
- Appreciation +0.0/10.0
$325,000
🖨 Deal sheet (PDF) 📄 Offer letter ✓ Due diligence
Multi-family units
County records classify this as Multi-Family (2-4 Unit). Listing-text estimate: 1 unit. estimate disagrees with records
Listing remarks
Located in one of Highlandtown's hottest retail blocks and surrounded by some of Highlandtown's most popular eateries, this location is PRIME. Looking for an income producing property with the flexibility of both a main level commercial space plus a separate apartment upstairs, along with coveted dedicated parking? Looking for an owner/operator building to grow your start-up and have reside on the 2nd level? Look no further than 3210 Eastern Ave located just steps from The Creative Alliance that provides a steady flow of well attended art shows, live entertainment venues and just a great all year round creative center that provides a solid anchor to the immediate area and surrounding busin
Key facts
- 1,222 sq ft lot
- 2 parking spots
- Built 1920
Property features AI
Finance
- Financial info: Two month-to-month units
Exterior
- Parking: Driveway parking (2 spaces); Total of 2 garage/parking spaces
- Utilities: Public water; Public sewer; Electric service 200+ amp; Hot water: electric; Electric available
- Home design: Interior townhouse/rowhouse; 2 total levels; Fee simple ownership
- Construction: Brick construction; Brick/mortar foundation; Above and below grade structures
- Exterior features: Estimated lot dimensions approximately 13 x 94; No tidal water
Interior
- Kitchen: Stove; Refrigerator
- Bedrooms: Two one-bedroom units (multi-family)
- Heating & cooling: Electric baseboard heating; Central air conditioning
- Interior features: Level entry to main floor; Basement present (dirt floor); Assessor-reported living area
Neighborhood map
What this means for you Summary
Snapshot
- This is a 2-bed/?-bath multifamily listed at $325k. Condition is rated fair.
Deal economics
- At list price, monthly cash flow is $811 ($10k/yr) — positive.
- The deal already cash-flows at list — no discount required.
- Meets the 1% rule at list price ($4k rent vs $325k).
- Cap rate 9.3% vs local median 6.0% in Baltimore — top-decile yield for the area; either an underpriced asset or a hidden risk that comps aren't pricing in. Stress-test before assuming the spread holds.
Location & tenants
- Location reads 76/100 on livability (#90 in MD, #3,396 nationally) — a middle-class / working-renter tenant base. Strengths: amenities A+, commute A+, housing A+; Watch: schools D, crime F.
- Baltimore City Public Schools (urban): math 7% / reading 16% proficiency, ranked #24 of 24 in MD (top 100%) — low school quality limits family demand, transient renter base, plan for 1-2y turnover; 79% free/reduced lunch — lower-income household profile, screen leases tightly.
- Market conditions: Rents rising (+1.3%/yr); 393 active listings in the ZIP; 40 comparable units currently listed for rent nearby; rentals at typical pace (median 25d on market — plan ~3-4 weeks tenant-placement turnaround); solid renter incomes; 1,273 units permitted in Baltimore city in 2024 (1,104 in 5+ unit buildings).
- At $3,869/mo this rent would consume 52% of the median local household income ($89k/yr) (locally 1786% of renters already pay >50% of income on rent) — very limited rent-growth headroom before tenants either downsize or default.
Forward outlook
- Local home prices are declining (-3.0%/yr); year-one equity from $2k of loan paydown is wiped out by about $10k of value loss. Plan a longer hold.
- Baltimore County population projected to shrink 4% by 2050 — rents likely to lag national; underwrite the cash flow, not the appreciation.
Negotiation context
- Only 13 days on market — expect competitive offers; lowballing is unlikely to land.
Risks & watch-outs
- Watch-outs: built in 1920 — expect roof / HVAC / electrical / plumbing capex.
Questions for the listing agent
- Have any recent inspections been done? Can we get a copy of the seller's disclosures and any deferred-maintenance estimates?
- Built in 1920 — when were the roof, HVAC, electrical panel, plumbing, and water heater last replaced?
- Is there a deadline driving the sale (1031 exchange, divorce, estate, relocation)? That informs how much negotiation room exists.
- Schools are D-rated, which usually means shorter tenancies and higher turnover. Who's the typical renter profile here, and what's been the actual vacancy rate?
- Crime grade is F in this area — have there been break-ins, vandalism, or insurance claims at this property in the last 3 years? What carrier currently insures it and at what premium?
- What's the average days-on-market for RENTAL listings here right now (not sales)? A rising rental-DOM trend means longer vacancies and softer asking-rent achievability than the comps imply.
- What's the recent tenant-quality profile in this submarket — average credit score on applications, eviction rate, late-payment / NSF rate, and stable-employment percentage? A property-management company in the area should have these aggregated.
- How much new apartment / multifamily construction is in the pipeline within 1–3 miles? Heavy new supply (>2% of stock underway) typically softens rents 12–24 months out; light construction supports rent growth.
Investment metrics
- 1% rule
- 1.19% ✓
- Cap rate
- 9.29%
- Cash-on-cash
- 10.69%
- DSCR
- 1.48
- GRM
- 7.0
CMA / ARV
- ARV (on-the-fly)
- $170,800
- Comps found
- 2
Show comp detail 2 sales within ~0.75 mi
| Address | Dist | Beds/Ba | Sqft | Sold | Price | $/sf | Match |
|---|---|---|---|---|---|---|---|
| 312 S Highland Ave | 0.14mi | 2/— | 1,578 (+13%) | 7mo | $190,000 | $120 | 66 |
| 3722 E Pratt St | 0.37mi | 2/— | 1,513 (+8%) | 12mo | $185,000 | $122 | 59 |
Match score weights: distance 35% · size 25% · config 20% · recency 20%. Top-matched comps best support the ARV.
Projected returns pro-forma
-3.0% appreciation · 1.31% rent growth · sell at horizon
- IRR
- -2.2%
- Equity multiple
- 0.92×
- Total profit
- $-7,454
- Equity at exit
- $48,459
- IRR
- 5.5%
- Equity multiple
- 1.38×
- Total profit
- $34,554
- Equity at exit
- $28,100
Cash invested: $91,000 (down + closing). Projections, not guarantees.
Landlord ↔ Tenant lean methodology
- Overall (CITY)
- 12 Strongly Tenant-Friendly
- State Maryland
- 27 Tenant-Leaning · D+14
- County
- — inherits STATE
- City Baltimore
- 12 Strongly Tenant-Friendly · D+58
ZIP-level market 21224
- Rents YoY
- 1.3%
- Active inventory
- 393
- Price-to-rent
- 14.0×
Monthly cashflow live
- Estimated rent
- $3,869 high interval (Pro) →
- Mortgage (P&I)
- −$1,704
- Tax est. 1.5%
- −$406 /mo · $4,875/yr
- Insurance
- −$135
- HOA
- −$0
- Vacancy / Maint / Mgmt
- −$812
- Net cashflow
- $811
Break-even live
Sensitivity live
| Price | -10% $1,035 | -5% $923 | +0% $811 | +5% $698 | +10% $586 |
|---|---|---|---|---|---|
| Rent | -10% $505 | -5% $658 | +0% $811 | +5% $963 | +10% $1,116 |
| Rate | -1.0pp $974 | -0.5pp $893 | base $811 | +0.5pp $726 | +1.0pp $641 |
2-unit breakdown (identical units grouped — click to expand)
| Units | Beds | Baths | Est. rent |
|---|---|---|---|
| 2× units | 2 | 1 | $3,870 |
| #1 | 2 | 1 | $1,935 |
| #2 | 2 | 1 | $1,935 |
| Total (2 units) | $3,869 | ||
UW: 25.0% down · 7.5% · 30yr · 1.5% tax · 5.0% vac · 8.0% maint · 8.0% mgmt
Financing live
Cash to close
- Down payment
- $81,250
- Closing costs
- $9,750
- Reserves months
- —
- Total cash needed
- —
Loan-product check · same deal, 3 products live
Conventional
25% down · 7.5% · 30yr
- Down + closing
- —
- Monthly P&I
- —
- Monthly cashflow
- —
- DSCR
- —
- Eligible?
- —
Personal DTI + credit; lowest rate.
DSCR
20% down · 8.5% · 30yr
- Down + closing
- —
- Monthly P&I
- —
- Monthly cashflow
- —
- DSCR
- —
- Eligible?
- —
No personal income docs; deal must DSCR.
Hard money
10% down · 12.0% · 12mo
- Down + closing
- —
- Monthly P&I
- —
- Monthly cashflow
- —
- DSCR
- —
- Eligible?
- —
Short-term bridge; refi at stabilization.
Rent comps 40 comps
| Address | Beds | Baths | Sqft | Rent | $/sqft | DOM | Units | Dist |
|---|---|---|---|---|---|---|---|---|
| 400 S Highland Ave Unit 402 Baltimore, MD | 2.0 | 1.0 | 900 | $1,700 | $1.89 | 44d | 1 | 0.09mi |
| 249 S East Ave Baltimore, MD | 2.0 | 2.0 | 1680 | $2,250 | $1.34 | 24d | 1 | 0.15mi |
| 235 S Highland Ave Baltimore, MD | 2.0 | 1.5 | 1222 | $2,000 | $1.64 | 24d | 1 | 0.19mi |
| 3245 Fait Ave Baltimore, MD | 3.0 | 2.0 | 1470 | $2,900 | $1.97 | 44d | 1 | 0.26mi |
| 127 S Robinson St Baltimore, MD | 2.0 | 1.5 | 1400 | $2,000 | $1.43 | 44d | 1 | 0.26mi |
| 106 S Bouldin St Baltimore, MD | 2.0 | 3.0 | 1134 | $2,100 | $1.85 | 21d | 1 | 0.28mi |
| 3036 Hudson St Baltimore, MD | 2.0 | 2.5 | 1428 | $2,600 | $1.82 | 44d | 1 | 0.33mi |
| 3710 E Pratt St Baltimore, MD | 2.0 | 3.5 | 1230 | $1,900 | $1.54 | 24d | 1 | 0.34mi |
| 3502 E Lombard St Baltimore, MD | 3.0 | 2.0 | 1522 | $1,870 | $1.23 | 44d | 1 | 0.35mi |
| 102 S Curley St Baltimore, MD | 2.0 | 1.5 | 1200 | $1,800 | $1.50 | 5d | 1 | 0.37mi |
| 3905 Bank St Baltimore, MD | 4.0 | 1.0–3.0 | 909 | $2,350 | $2.58 | 3d | 20 | 0.37mi |
| 3436 Leverton Ave Baltimore, MD | 3.0 | 3.5 | 1500 | $2,350 | $1.57 | 24d | 1 | 0.38mi |
| 825 S Linwood Ave Baltimore, MD | 1.0 | 1.0 | 1000 | $2,150 | $2.15 | 24d | 1 | 0.38mi |
| 3304 E Baltimore St Baltimore, MD | 3.0 | 1.5 | 1514 | $1,875 | $1.24 | 44d | 1 | 0.39mi |
| 939 S Baylis St Baltimore, MD | 3.0 | 3.0 | 1606 | $3,500 | $2.18 | 18d | 1 | 0.41mi |
| 115 S Eaton St Baltimore, MD | 3.0 | 2.5 | 1393 | $1,800 | $1.29 | 17d | 1 | 0.41mi |
| 3430 E Baltimore St Baltimore, MD | 3.0 | 2.5 | 1316 | $2,250 | $1.71 | 24d | 1 | 0.42mi |
| 17 N East Ave Baltimore, MD | 2.0 | 2.0 | 1326 | $2,550 | $1.92 | 24d | 1 | 0.43mi |
| 3610 Dillon St Baltimore, MD | 1.0–2.0 | 1.0–2.0 | 828 | $2,820 | $3.41 | 44d | 1 | 0.43mi |
| 611 Grundy St Baltimore, MD | 3.0 | 2.0 | 1434 | $2,700 | $1.88 | 24d | 1 | 0.44mi |
| 4015 Eastern Ave Unit 2L Baltimore, MD | 3.0 | 2.0 | 1100 | $1,800 | $1.64 | 44d | 1 | 0.44mi |
| 29 N Ellwood Ave Baltimore, MD | 3.0 | 1.5 | 1100 | $2,395 | $2.18 | 24d | 1 | 0.44mi |
| 502 S Haven St Baltimore, MD | 2.0 | 2.5 | 1440 | $2,400 | $1.67 | 24d | 1 | 0.45mi |
| 502 S Haven St Baltimore, MD | 2.0 | 2.5 | 1440 | $2,400 | $1.67 | 17d | 1 | 0.45mi |
| 113 N Clinton St Baltimore, MD | 2.0 | 1.0 | 1300 | $1,995 | $1.53 | 44d | 1 | 0.47mi |
| 3205 Esther Pl Baltimore, MD | 2.0 | 2.0 | 960 | $1,850 | $1.93 | 24d | 1 | 0.49mi |
| 113 N Decker Ave Baltimore, MD | 3.0 | 3.5 | 1800 | $2,850 | $1.58 | 24d | 1 | 0.49mi |
| 11 N Streeper St Baltimore, MD | 3.0 | 3.5 | 1800 | $2,600 | $1.44 | 44d | 1 | 0.50mi |
| 10 N Streeper St Baltimore, MD | 3.0 | 2.5 | 1440 | $2,500 | $1.74 | 24d | 1 | 0.51mi |
| 34 N Linwood Ave Baltimore, MD | 2.0 | 1.5 | 1288 | $2,400 | $1.86 | 24d | 1 | 0.52mi |
| 3518 Elliott St Baltimore, MD | 3.0 | 2.5 | 1036 | $2,800 | $2.70 | 18d | 1 | 0.55mi |
| 203 N Ellwood Ave Unit Main Baltimore, MD | 2.0 | 2.0 | 880 | $2,200 | $2.50 | 24d | 1 | 0.56mi |
| 150 N Curley St Baltimore, MD | 2.0 | 2.5 | 1266 | $1,850 | $1.46 | 18d | 1 | 0.57mi |
| 1209 S Ellwood Ave Baltimore, MD | 2.0 | 2.0 | 1188 | $2,250 | $1.89 | 44d | 1 | 0.57mi |
| 1200 S Conkling St Baltimore, MD | 1.0–2.0 | 1.0–2.0 | 1085 | $2,933 | $2.70 | 2d | 16 | 0.60mi |
| 9 N Luzerne Ave Baltimore, MD | 3.0 | 2.5 | 1380 | $2,450 | $1.78 | 5d | 1 | 0.63mi |
| 1211 S Eaton St Unit 8038 Baltimore, MD | 1.0 | 1.0 | 1037 | $2,475 | $2.39 | 17d | 1 | 0.63mi |
| 1211 S Eaton St Unit 3035 Baltimore, MD | 3.0 | 2.0 | 1545 | $3,900 | $2.52 | 24d | 1 | 0.63mi |
| 404 N Robinson St Baltimore, MD | 3.0 | 3.0 | 1320 | $2,100 | $1.59 | 17d | 1 | 0.64mi |
| 404 N Robinson St Baltimore, MD | 3.0 | 3.0 | 1320 | $2,200 | $1.67 | 24d | 1 | 0.64mi |
Listing history 8 events
-
2026-06-21days on market $325,000 Active 13 DOM
-
2026-06-18days on market $325,000 Active 10 DOM
-
2026-06-17days on market $325,000 Active 9 DOM
-
2026-06-16days on market $325,000 Active 8 DOM
-
2026-06-15days on market $325,000 Active 7 DOM
-
2026-06-13days on market $325,000 Active 5 DOM
-
2026-06-09remarks 699-char remark
-
2026-06-09$325,000 Active 1 DOM
ⓘ Source: listings_history table (triggers on properties + properties_extension) + one-shot
backfill from property_details.listing_events for pre-trigger history.
Nearby sold comps map
Loading sold comps map…
Walkable amenities ~0.75 mi
Loading nearby amenities…
Taxation est. · year 1
- Rental income
- $46,428
- − Mortgage interest
- −$18,205
- − Property taxes
- −$4,875
- − Insurance
- −$1,625
- − Repairs & maintenance
- −$3,714
- − Management
- −$3,714
- − Depreciation
- −$9,455
- Taxable income
- $4,840
- Est. tax owed @ 24.0%
- −$1,162
- After-tax cash flow
- $8,565/yr
For passive investors: Depreciation is non-cash, so a rental often shows a tax loss while cash-flowing — sheltering income. Rental losses are passive: they offset passive income freely, and up to $25,000/yr can offset ordinary (W-2) income if you actively participate and your MAGI is under $100k (phasing out to $0 by $150k); unused losses carry forward. On sale, claimed depreciation is recaptured at up to 25%, and gains may owe capital-gains tax (a 1031 exchange can defer both). Figures are a year-1 estimate at your 24.0% rate — not tax advice; consult a CPA.
Condition & rehab AI · 3 photos
The property presents as a moderate rehab opportunity with fair exterior and landscaping conditions. Repainting and trimming the yard can significantly enhance its curb appeal and value.
Repairs flagged
- Moderate Exterior siding — Visible weathering and staining.
- Minor Landscaping — Overgrown and needs trimming.
- Minor Fencing — May need minor repairs to ensure safety and appearance.
Value-add opportunities
- Both Paint exterior siding — Fresh paint can improve curb appeal and property value.
- Both Trim landscaping — A well-maintained yard can enhance the property's appeal and value.
- Both Inspect and repair roof — A healthy roof is crucial for the property's longevity and value.
Renovation cost estimate screening
| Repair item | Severity | Est. cost |
|---|---|---|
| Exterior siding · Visible weathering and staining. | Moderate | $3,000–15,000 |
| Landscaping · Overgrown and needs trimming. | Minor | $500–3,000 |
| Fencing · May need minor repairs to ensure safety and appearance. | Minor | $500–3,000 |
| Total estimated repair cost · 3 items | $4,000–21,000 |
Value-add ROI direction
- Both Paint exterior siding — Fresh paint can improve curb appeal and property value. ↑
- Both Trim landscaping — A well-maintained yard can enhance the property's appeal and value. ↑
- Both Inspect and repair roof — A healthy roof is crucial for the property's longevity and value. ↑
ⓘ Cost ranges are severity-bucket heuristics (US national rule-of-thumb). Get contractor quotes + a written scope before underwriting a rehab budget.
Schools (NCES district)
- District
- Baltimore City Public Schools
- NCES district ID
- 2400090
- Math proficiency
- 7% ▼ -9.00%
- Reading proficiency
- 16% ▼ -5.00%
- Median HH income
- $42,108
- Composite
- 10.08/100
- National rank
- #9805
- State rank
- #24 of 24 in MD
Livability — Baltimore
- Score
- 76/100
- State rank
- #90
- US rank
- #3396
Category grades
Schools grade is shown separately in the Schools card above.
Census & demographics
- Census place
- Baltimore, MD
- County
- Baltimore City · 558,601 people
- City population
- 588,727
- Metro
- Baltimore-Columbia-Towson, MD
- Population (ZIP)
- 47,465
- Household income
- $89,017
- Rent vs Own
- Severe rent burden
- 1786.0
Population outlook (Baltimore County) Hauer SSP2
- Today (2025)
- 624,249 people
- By 2030
- 621,541 · -0.4%
- By 2040
- 609,756 · -2.3%
- By 2050
- 597,249 · -4.3%
- By 2075
- 552,236 · -11.5%
- By 2100
- 513,934 · -17.7%
Race, ethnicity, and origin ACS 2023
- Neighborhood character
- Diverse neighborhood (Simpson 0.62)
- Race & ethnicity
- White 55% Hispanic / Latino 21% Black 16% Two or more races 7% Asian 4%
- Hispanic origin (detail)
- Mexican 4% Puerto Rican 2% Dominican 1%
- Common ancestry
- Romanian 5% Lithuanian 2% Italian 1%
- Foreign-born
- 17% · Canada, China, Vietnam
- Languages at home
- 76% English-only · Spanish 18% Other Indo-European 2% Russian/Polish/Slavic 1%
Political lean MEDSL · Baltimore
- 2024 margin
- Solid D (+73.0) · D 85.2% · R 12.2% · Other 2.6%
- 2008→2024 swing
- -2.5pp toward R · 2008: 75.5pp · 2024: 73.0pp
- All cycles
- 2024: D+73.0 2020: D+76.6 2016: D+74.6 2012: D+76.4 2008: D+75.5
Not yet ingested
- Civics
- —
Market trends
- HPI YoY
- ▼ -332.23%
- Current HPI
- 241.284
- Rent YoY
- ▲ 1.31%
- Metro
- Baltimore-Columbia-Towson, MD
- State GDP YoY
- ▲ 2.97%
- F500 in state
- 12
Industry mix (Fortune 500 HQ in MD)
| Industry | F500 HQs | Revenue |
|---|---|---|
| Aerospace / Defense | 1 | $71B |
|
||
| Utilities | 1 | $25B |
|
||
| Hotels | 1 | $24B |
|
||
| Consumer Goods | 1 | $7B |
|
||
| Real Estate | 1 | $6B |
|
||
| Chemicals | 1 | $2B |
|
||
Price history
+0.0% since first listed2 events — show timeline
- 2026-06-09 Listed $325,000 BRIGHT MLS
- 2026-06-08 Coming Soon $325,000 BRIGHT MLS
Cash-flow waterfall
monthlySold comps — $/sqft
last 12 mo · ≤1 miLoading sold comps…