1011 Grant St · Newell, WV
Flood risk 1/10 · Minimal
- FEMA flood zone
- X (unshaded)
- Chance of flooding over 30 yrs
- 0.0%
- Est. flood insurance / yr
- $473 – $860
Fire risk 1/10 · Minimal
- Est. fire insurance / yr
- $787 – $1,461
Heat risk 4/10 · Minor
- Hot days now (above 97°F)
- 7 days/yr
- Hot days in 30 yrs
- 19 days/yr
Wind risk 1/10 · Minimal
- Chance of severe wind over 30 yrs
- —
Air-quality risk 2/10 · Minimal
- Unhealthy air days now
- 1 days/yr
- Unhealthy air days in 30 yrs
- 2 days/yr
Risk factors via First Street. Map © Google.
Why this score? — see what drove the C- grade
The composite is a weighted blend of 9 inputs, each scored 0–100. Each bar is that input's sub-score; the figure is the points it added to the 100-point composite (weight × sub-score).
- Cash flow +15.0/30.0
- Appreciation +9.9/10.0
- ARV discount +7.5/15.0
- 1% rule +5.0/10.0
- DSCR +5.0/10.0
- Schools +3.4/10.0
- Livability +3.0/5.0
- Rent growth +2.5/5.0
- Condition / age +2.5/5.0
$29,900
🖨 Deal sheet 📄 Offer letter ✓ Due diligence
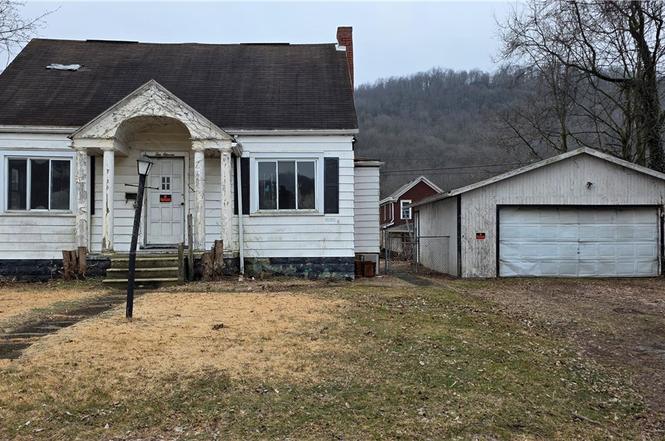
Listing remarks
Lot Potential with Utility Connections Featuring a 2 Car Garage! Fixer-upper opportunity for cash buyers. The house on the property features severe, visible structural issues including a compromised load-bearing beam. Priced for immediate "AS IS" sale. No repairs or inspections to be done by the seller. No access to the interior of the house allowed. Schedule a showing by reaching out to me or your local realtor!
Key facts
- 8,001 sq ft lot
- 2 garage spots
- Built 1940
Property features AI
Exterior
- Parking: 2-car garage; Detached garage; Driveway; On-street parking
- Utilities: Public water; Public sewer
- Home design: 2-story home; Above-grade finished area approximately 1,354
- Construction: Built (year source: Assessor); Block foundation; Asphalt/fiberglass roof
- Exterior features: Aluminum siding; Lot approximately 0.18 acres
Interior
- Bedrooms: 2 main-level bedrooms
- Bathrooms: 1 full bathroom (main level)
- Heating & cooling: Gas heating; Electric cooling
- Interior features: 6 total rooms; Full concrete basement
Neighborhood map
What this means for you Summary
Snapshot
- This is a 4-bed/1.0-bath single-family listed at $30k.
Deal economics
- At list price, monthly cash flow is $817 ($10k/yr) — positive.
- The deal already cash-flows at list — no discount required.
- Meets the 1% rule at list price ($1k rent vs $30k).
- Recommended offer: $28k (6.0% below list) — sets the bar for market timing.
Location & tenants
- Location reads 60/100 on livability (#213 in WV) — a middle-class / working-renter tenant base. Strengths: crime A+, cost of living A+, housing A; Watch: health & safety C-, schools F, amenities F.
- Hancock County Schools (urban): math 37% / reading 43% proficiency, ranked #7 of 55 in WV (top 13%) — families likely to look elsewhere, expect single-tenant / working-renter base with shorter leases.
- Market conditions: 5 active listings in the ZIP; 15 units permitted in Hancock County in 2024 (0 in 5+ unit buildings).
Forward outlook
- In year one you build about $3k of equity ($207 loan paydown + $3k appreciation (9.8% local appreciation)).
- Hancock County population projected at -15% by 2050 — secular population decline; favor cash flow + early exit over multi-decade hold.
- At projected returns (9.8% appreciation + 3.0% rent growth), your $8k cash investment doubles in ~1 year — after that, you're playing with house money.
- By year 9, paydown + projected appreciation supports a ~$32k cash-out refi (75% LTV) — recoverable capital for the next deal without selling this one.
Negotiation context
- It's been on market 68 days — a 6% lower offer ($28k) is reasonable based on typical stale-listing flexibility.
Risks & watch-outs
- Watch-outs: built in 1940 — expect roof / HVAC / electrical / plumbing capex.
Questions for the listing agent
- It's been on market 68 days. Have you received any prior offers? Is the seller open to a 6% concession, seller financing, or rate buy-down credit?
- Built in 1940 — when were the roof, HVAC, electrical panel, plumbing, and water heater last replaced?
- Why hasn't it sold? Are there any deal-killer items the seller is aware of (foundation, flood, title, zoning, code violations)?
- Is there a deadline driving the sale (1031 exchange, divorce, estate, relocation)? That informs how much negotiation room exists.
- Schools are F-rated, which usually means shorter tenancies and higher turnover. Who's the typical renter profile here, and what's been the actual vacancy rate?
- What's the average days-on-market for RENTAL listings here right now (not sales)? A rising rental-DOM trend means longer vacancies and softer asking-rent achievability than the comps imply.
- What's the recent tenant-quality profile in this submarket — average credit score on applications, eviction rate, late-payment / NSF rate, and stable-employment percentage? A property-management company in the area should have these aggregated.
- How much new for-sale + rental construction is in the pipeline within 1–3 miles? Heavy new supply typically softens prices + rents 12–24 months out; constrained supply supports both.
Investment metrics
- 1% rule
- 4.30% ✓
- Cap rate
- 39.08%
- Cash-on-cash
- 117.08%
- DSCR
- 6.21
- GRM
- 1.9
CMA / ARV
- ARV (on-the-fly)
- $64,992
- Comps found
- 4
Show comp detail 4 sales within ~0.75 mi
| Address | Dist | Beds/Ba | Sqft | Sold | Price | $/sf | Match |
|---|---|---|---|---|---|---|---|
| 1011 Grant St | 0.00mi | 4/1.0 | 1,354 (0%) | 1mo | $17,000 | $13 | 99 |
| 510 Grant St | 0.55mi | 4/2.0 | 1,500 (+11%) | 14mo | $72,000 | $48 | 41 |
| 524 Grant St | 0.52mi | 3/1.5 (-1) | 1,524 (+13%) | 11mo | $33,000 | $22 | 39 |
| 313 Grant St | 0.72mi | 3/1.0 (-1) | 1,182 (-13%) | 8mo | $125,000 | $106 | 34 |
Match score weights: distance 35% · size 25% · config 20% · recency 20%. Top-matched comps best support the ARV.
Projected returns pro-forma
9.77% appreciation · 3.0% rent growth · sell at horizon
- IRR
- —
- Equity multiple
- 9.10×
- Total profit
- $67,851
- Equity at exit
- $26,433
- IRR
- —
- Equity multiple
- 19.97×
- Total profit
- $158,804
- Equity at exit
- $56,477
Cash invested: $8,372 (down + closing). Projections, not guarantees.
Landlord ↔ Tenant lean methodology
- Overall (STATE)
- 83 Strongly Landlord-Friendly
- State West Virginia
- 83 Strongly Landlord-Friendly · R+22
- County
- — inherits STATE
- City
- — inherits STATE
ZIP-level market 26050
- Home prices YoY
- 6.4%
- Active inventory
- 5
- Price-to-rent
- 1.9×
Monthly cashflow live
- Estimated rent
- $1,286 medium interval (Pro) →
- Mortgage (P&I)
- −$157
- Tax from tax record
- −$30 /mo · $363/yr
- Insurance
- −$12
- HOA
- −$0
- Vacancy / Maint / Mgmt
- −$270
- Net cashflow
- $817
Break-even live
UW: 25.0% down · 7.5% · 30yr · 1.5% tax · 5.0% vac · 8.0% maint · 8.0% mgmt
Financing live
Cash to close
- Down payment
- $7,475
- Closing costs
- $897
- Reserves months
- —
- Total cash needed
- —
Loan-product check · same deal, 3 products live
Conventional
25% down · 7.5% · 30yr
- Down + closing
- —
- Monthly P&I
- —
- Monthly cashflow
- —
- DSCR
- —
- Eligible?
- —
Personal DTI + credit; lowest rate.
DSCR
20% down · 8.5% · 30yr
- Down + closing
- —
- Monthly P&I
- —
- Monthly cashflow
- —
- DSCR
- —
- Eligible?
- —
No personal income docs; deal must DSCR.
Hard money
10% down · 12.0% · 12mo
- Down + closing
- —
- Monthly P&I
- —
- Monthly cashflow
- —
- DSCR
- —
- Eligible?
- —
Short-term bridge; refi at stabilization.
Listing history 4 events
-
2026-05-11status Pending
-
2026-04-07price $29,900
-
2026-03-03$35,000 Active
-
1990-03-23soldstatus $35,500
ⓘ Source: listings_history table (triggers on properties + properties_extension) + one-shot
backfill from property_details.listing_events for pre-trigger history.
Tax reassessment forecast WV · Resets to sale price
- Current annual tax
- $363 · $30/mo
- Projected year-2 tax
- $363 · $30/mo
- Expected delta
- $0/yr ($0/mo · 0.0%)
ⓘ Screening estimate from a state-policy table — verify with the county assessor before closing.
Climate risk First Street
- Flood 1/10 Low FEMA zone X (unshaded) · 0% chance over 30 yrs
- Wildfire 1/10 Low
- Heat 4/10 Moderate 7 d/yr ≥97°F today · 19 d/yr by 30 yrs out
- Wind 1/10 Low
- Air quality 2/10 Low 1 unhealthy d/yr today · 2 by 30 yrs out
Nearby sold comps map
Loading sold comps map…
Walkable amenities ~0.75 mi
Loading nearby amenities…
Taxation est. · year 1
- Rental income
- $15,438
- − Mortgage interest
- −$1,675
- − Property taxes
- −$363
- − Insurance
- −$150
- − Repairs & maintenance
- −$1,235
- − Management
- −$1,235
- − Depreciation
- −$870
- Taxable income
- $9,911
- Est. tax owed @ 24.0%
- −$2,379
- After-tax cash flow
- $7,423/yr
For passive investors: Depreciation is non-cash, so a rental often shows a tax loss while cash-flowing — sheltering income. Rental losses are passive: they offset passive income freely, and up to $25,000/yr can offset ordinary (W-2) income if you actively participate and your MAGI is under $100k (phasing out to $0 by $150k); unused losses carry forward. On sale, claimed depreciation is recaptured at up to 25%, and gains may owe capital-gains tax (a 1031 exchange can defer both). Figures are a year-1 estimate at your 24.0% rate — not tax advice; consult a CPA.
Schools (NCES district)
- District
- Hancock County Schools
- NCES district ID
- 5400450
- Math proficiency
- 37% ▼ -11.00%
- Reading proficiency
- 43% ▼ -5.00%
- Median HH income
- $39,803
- Composite
- 33.5/100
- National rank
- #5445
- State rank
- #7 of 55 in WV
Livability — Newell
- Score
- 60/100
- State rank
- #213
- US rank
- #18588
Category grades
Schools grade is shown separately in the Schools card above.
Census & demographics
- Census place
- Newell, WV
- Population (ZIP)
- 1,504
Population outlook (Hancock County) Hauer SSP2
- Today (2025)
- 28,704 people
- By 2030
- 27,913 · -2.8%
- By 2040
- 26,078 · -9.1%
- By 2050
- 24,521 · -14.6%
- By 2075
- 21,630 · -24.6%
- By 2100
- 17,867 · -37.8%
Race, ethnicity, and origin ACS 2023
- Neighborhood character
- Predominantly White (95%)
- Race & ethnicity
- White 95% Two or more races 3% Asian 2%
- Common ancestry
- Italian 5% Serbian 3% Romanian 2%
- Foreign-born
- 2%
- Languages at home
- 98% English-only · Tagalog/Filipino 2%
Political lean MEDSL · Hancock
- 2024 margin
- Solid R (+46.8) · D 25.8% · R 72.6% · Other 1.6%
- 2008→2024 swing
- -31.6pp toward R · 2008: -15.2pp · 2024: -46.8pp
- All cycles
- 2024: R+46.8 2020: R+43.6 2016: R+44.5 2012: R+21.6 2008: R+15.2
Not yet ingested
- Civics
- —
Market trends
- HPI YoY
- ▲ 9.77%
- Current HPI
- 161.7743
- Rent YoY
- —
- Metro
- —
- State GDP YoY
- —
- F500 in state
- 0
Price history
-15.8% since first listed4 events — show timeline
- 2026-05-11 Pending — MLSNOW
- 2026-04-07 Price Changed $29,900 MLSNOW
- 2026-03-03 Listed $35,000 MLSNOW
- 1990-03-23 Sold (Public Records) $35,500 Public Records
Property tax history
-7.0%/yrLatest (2025): $363 · +4.9% YoY. Source: county tax records.
Cash-flow waterfall
monthlySold comps — $/sqft
last 12 mo · ≤1 miLoading sold comps…