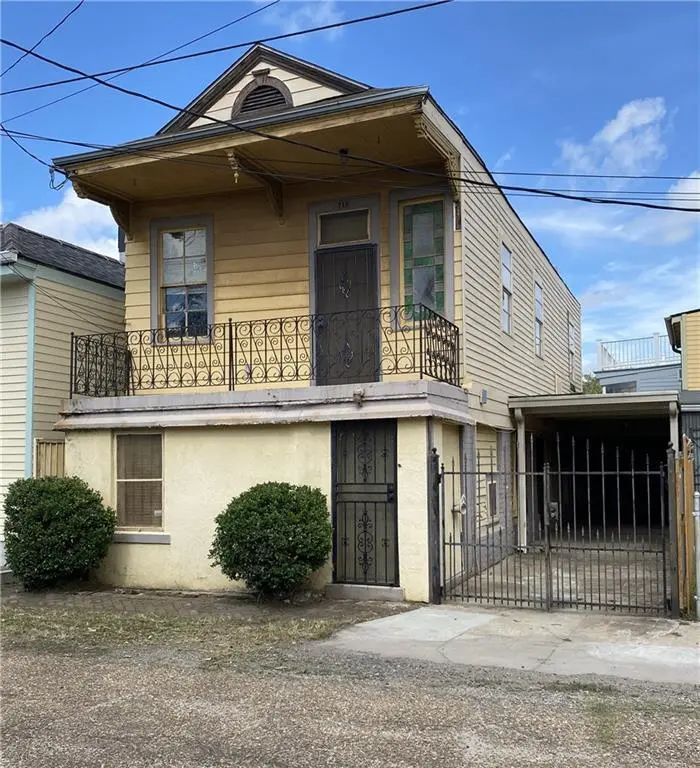
715 Harmony St · New Orleans, LA
Flood risk 6/10 · Moderate
- FEMA flood zone
- X
- Chance of flooding over 30 yrs
- 0.56%
- Est. flood insurance / yr
- $507 – $1,088
Fire risk 1/10 · Minimal
- Est. fire insurance / yr
- $1,269 – $2,357
Heat risk 10/10 · Severe
- Hot days now (above 108°F)
- 7 days/yr
- Hot days in 30 yrs
- 21 days/yr
Wind risk 10/10 · Severe
- Chance of severe wind over 30 yrs
- 99.0%
Air-quality risk 3/10 · Minor
- Unhealthy air days now
- 3 days/yr
- Unhealthy air days in 30 yrs
- 4 days/yr
Risk factors via First Street. Map © Google.
Why this score? — see what drove the C grade
The composite is a weighted blend of 9 inputs, each scored 0–100. Each bar is that input's sub-score; the figure is the points it added to the 100-point composite (weight × sub-score).
- Cash flow +25.0/30.0
- DSCR +8.2/10.0
- ARV discount +7.5/15.0
- 1% rule +6.8/10.0
- Livability +4.0/5.0
- Condition / age +2.5/5.0
- Rent growth +2.1/5.0
- Schools +1.6/10.0
- Appreciation +0.0/10.0
$230,000
🖨 Deal sheet 📄 Offer letter ✓ Due diligence
Listing remarks MLS
This solid Irish Channel residence features two stories, three bedrooms, and two half-baths. It includes a living/dining area, a den, and a combination of wood and tile flooring. Notable features of the house include original stained-glass window, wooden mantles, oak doors, and original architectural corbels. There are two wooden interior staircases and a large porch/balcony on the second floor. The property also offers ample side yard space, perfect for entertaining or parking. Additionally, there is potential to convert it into a multifamily residence. It is conveniently located within walking distance of all that Magazine and Tchoupitoulas Streets have to offer.
Key facts
- Parking
- Built 1920
- Listed 49 days
Property features AI
Exterior
- Parking: Off-street parking (one space)
- Utilities: Public water; Public sewer
- Home design: Two-story property; Average condition; Slab foundation
- Construction: Aluminum siding; Brick exterior; Wood siding; Asphalt shingle roof; Built with slab foundation
- Exterior features: Balcony; Porch; Fence; City lot; Irregular lot
Interior
- Bathrooms: Two half bathrooms
- Interior features: Pantry
Neighborhood map
What this means for you Summary
Snapshot
- This is a 3-bed/2.0-bath single-family listed at $230k.
Deal economics
- At list price, monthly cash flow is $501 ($6k/yr) — positive.
- The deal already cash-flows at list — no discount required.
- Meets the 1% rule at list price ($3k rent vs $230k).
- Recommended offer: $223k (3.0% below list) — sets the bar for market timing.
- Cap rate 8.9% vs local median 4.4% in New Orleans — top-decile yield for the area; either an underpriced asset or a hidden risk that comps aren't pricing in. Stress-test before assuming the spread holds.
Location & tenants
- Location reads 81/100 on livability (#3 in LA, #1,383 nationally) — a professional / high-income tenant draw. Strengths: amenities A+, commute A+, health & safety A+; Watch: crime C-, employment D.
- Orleans Parish (urban): math 11% / reading 27% proficiency, ranked #69 of 98 in LA (top 70%) — low school quality limits family demand, transient renter base, plan for 1-2y turnover; 68% free/reduced lunch — lower-income household profile, screen leases tightly.
- Market conditions: Rents soft (-1.4%/yr); 278 active listings in the ZIP; 40 comparable units currently listed for rent nearby; rentals at typical pace (median 24d on market — plan ~3-4 weeks tenant-placement turnaround); solid renter incomes; 710 units permitted in Orleans Parish in 2024 (244 in 5+ unit buildings).
- This rent runs 36% of the median local income ($90k/yr) — at the standard rent-burdened threshold; future hikes will face affordability resistance.
Forward outlook
- Local home prices are declining (-3.0%/yr); year-one equity from $2k of loan paydown is wiped out by about $7k of value loss. Plan a longer hold.
- Orleans County population projected at +61% by 2050 — long-run rental-demand tailwind backs the buy-and-hold thesis.
Negotiation context
- It's been on market 49 days — a 3% lower offer ($223k) is reasonable based on typical stale-listing flexibility.
- 11 sale attempts since 11y ago with the ask held roughly flat each time — persistent listings suggest the price (not the market) is what's stuck; bring a comps-based counter.
- Current owner paid $12k; list at $230k implies a 1900% gain — meaningful room to come down on a strong offer.
Risks & watch-outs
- Watch-outs: built in 1920 — expect roof / HVAC / electrical / plumbing capex.
- Climate carrying-cost: major flood risk; severe wind risk, 99% chance of damaging wind over 30y; extreme-heat days projected 7→21/yr by 2055 (HVAC capex compounding) — expect insurance premiums to compound above CPI over the hold.
Questions for the listing agent
- It's been on market 49 days. Have you received any prior offers? Is the seller open to a 3% concession, seller financing, or rate buy-down credit?
- Built in 1920 — when were the roof, HVAC, electrical panel, plumbing, and water heater last replaced?
- Is there a deadline driving the sale (1031 exchange, divorce, estate, relocation)? That informs how much negotiation room exists.
- What's the average days-on-market for RENTAL listings here right now (not sales)? A rising rental-DOM trend means longer vacancies and softer asking-rent achievability than the comps imply.
- What's the recent tenant-quality profile in this submarket — average credit score on applications, eviction rate, late-payment / NSF rate, and stable-employment percentage? A property-management company in the area should have these aggregated.
- How much new for-sale + rental construction is in the pipeline within 1–3 miles? Heavy new supply typically softens prices + rents 12–24 months out; constrained supply supports both.
Investment metrics
- 1% rule
- 1.18% ✓
- Cap rate
- 8.91%
- Cash-on-cash
- 9.33%
- DSCR
- 1.42
- GRM
- 7.1
CMA / ARV
- ARV (median comp)
- $583,031
- List price
- $230,000
- Delta
- -60.55%
- Verdict
- UNDERPRICED
- Comps
- 20 within 1.0 mi
Show comp detail 12 sales within ~0.75 mi
| Address | Dist | Beds/Ba | Sqft | Sold | Price | $/sf | Match |
|---|---|---|---|---|---|---|---|
| 617 Eighth St | 0.12mi | 3/2.0 | 1,535 (-7%) | 6mo | $300,000 | $195 | 78 |
| 905 Aline St | 0.32mi | 3/2.0 | 1,596 (-4%) | 2mo | $730,000 | $457 | 77 |
| 3209 Laurel St | 0.14mi | 3/2.0 | 1,800 (+9%) | 5mo | $341,325 | $190 | 75 |
| 803 7th St | 0.17mi | 3/2.0 | 1,504 (-9%) | 5mo | $225,000 | $150 | 73 |
| 915 Sixth St | 0.26mi | 3/2.5 | 1,562 (-6%) | 7mo | $788,000 | $504 | 70 |
| 3512 Camp St | 0.45mi | 3/1.0 | 1,738 (+5%) | 7mo | $960,000 | $552 | 61 |
| 2919 Laurel St | 0.22mi | 2/2.5 (-1) | 1,475 (-11%) | 7mo | $445,000 | $302 | 59 |
| 930 Foucher St | 0.42mi | 2/2.5 (-1) | 1,782 (+8%) | 7mo | $400,000 | $224 | 55 |
| 3910 Coliseum St | 0.74mi | 3/3.0 | 1,726 (+4%) | 1mo | $740,000 | $429 | 53 |
| 924 Amelia St | 0.52mi | 2/2.0 (-1) | 1,476 (-11%) | 2mo | $640,000 | $434 | 51 |
| 715 Constantinople St | 0.73mi | 3/2.0 | 1,482 (-10%) | 6mo | $515,000 | $348 | 44 |
| 721 Constantinople St | 0.73mi | 2/2.0 (-1) | 1,451 (-12%) | 1mo | $655,000 | $451 | 40 |
Match score weights: distance 35% · size 25% · config 20% · recency 20%. Top-matched comps best support the ARV.
Projected returns pro-forma
-3.0% appreciation · 0.0% rent growth · sell at horizon
- IRR
- -5.7%
- Equity multiple
- 0.79×
- Total profit
- $-13,241
- Equity at exit
- $34,294
- IRR
- -0.2%
- Equity multiple
- 0.99×
- Total profit
- $-867
- Equity at exit
- $19,886
Cash invested: $64,400 (down + closing). Projections, not guarantees.
Landlord ↔ Tenant lean methodology
- Overall (STATE)
- 90 Strongly Landlord-Friendly
- State Louisiana
- 90 Strongly Landlord-Friendly · R+12
- County
- — inherits STATE
- City
- — inherits STATE
ZIP-level market 70115
- Rents YoY
- -1.4%
- Active inventory
- 278
- Price-to-rent
- 7.1×
Monthly cashflow live
- Estimated rent
- $2,712 high interval (Pro) →
- Mortgage (P&I)
- −$1,206
- Tax from tax record
- −$339 /mo · $4,072/yr
- Insurance
- −$96
- HOA
- −$0
- Vacancy / Maint / Mgmt
- −$569
- Net cashflow
- $501
Break-even live
UW: 25.0% down · 7.5% · 30yr · 1.5% tax · 5.0% vac · 8.0% maint · 8.0% mgmt
Financing live
Cash to close
- Down payment
- $57,500
- Closing costs
- $6,900
- Reserves months
- —
- Total cash needed
- —
Loan-product check · same deal, 3 products live
Conventional
25% down · 7.5% · 30yr
- Down + closing
- —
- Monthly P&I
- —
- Monthly cashflow
- —
- DSCR
- —
- Eligible?
- —
Personal DTI + credit; lowest rate.
DSCR
20% down · 8.5% · 30yr
- Down + closing
- —
- Monthly P&I
- —
- Monthly cashflow
- —
- DSCR
- —
- Eligible?
- —
No personal income docs; deal must DSCR.
Hard money
10% down · 12.0% · 12mo
- Down + closing
- —
- Monthly P&I
- —
- Monthly cashflow
- —
- DSCR
- —
- Eligible?
- —
Short-term bridge; refi at stabilization.
Rent comps 40 comps
| Address | Beds | Baths | Sqft | Rent | $/sqft | DOM | Units | Dist |
|---|---|---|---|---|---|---|---|---|
| 617 7th St New Orleans, LA | 3.0 | 2.0 | 1768 | $3,400 | $1.92 | 3d | 1 | 0.14mi |
| 929 Eighth St New Orleans, LA | 3.0 | 1.5 | 1600 | $2,250 | $1.41 | 23d | 1 | 0.18mi |
| 912 Louisiana Ave New Orleans, LA | 2.0 | 3.5 | 2175 | $4,250 | $1.95 | 43d | 1 | 0.27mi |
| 514 Washington Ave New Orleans, LA | 2.0 | 2.0 | 1100 | $2,200 | $2.00 | 3d | 1 | 0.29mi |
| 1111 6th St New Orleans, LA | 3.0 | 1.5 | 1425 | $2,995 | $2.10 | 43d | 1 | 0.33mi |
| 817 4th St New Orleans, LA | 2.0 | 2.0 | 1232 | $2,540 | $2.06 | 3d | 1 | 0.35mi |
| 1216 6th St New Orleans, LA | 2.0 | 1.0 | 1209 | $3,600 | $2.98 | 43d | 1 | 0.39mi |
| 2628 Magazine St New Orleans, LA | 3.0 | 2.0 | 1400 | $2,650 | $1.89 | 17d | 1 | 0.42mi |
| 515 3rd St New Orleans, LA | 3.0 | 3.0 | 1687 | $2,650 | $1.57 | 44d | 1 | 0.42mi |
| 2517 Saint Thomas St New Orleans, LA | 3.0 | 3.0 | 2010 | $4,000 | $1.99 | 3d | 1 | 0.42mi |
| 2608 Magazine St New Orleans, LA | 3.0 | 2.0 | 1844 | $3,100 | $1.68 | 43d | 1 | 0.44mi |
| 2502 Laurel St New Orleans, LA | 3.0 | 2.0 | 1333 | $2,300 | $1.73 | 17d | 1 | 0.45mi |
| 530 2nd St New Orleans, LA | 3.0 | 2.5 | 2050 | $5,250 | $2.56 | 43d | 1 | 0.45mi |
| 1410 6th St New Orleans, LA | 3.0 | 2.0 | 1400 | $5,000 | $3.57 | 16d | 1 | 0.50mi |
| 1118 Foucher St New Orleans, LA | 3.0 | 2.5 | 1620 | $2,490 | $1.54 | 17d | 1 | 0.50mi |
| 2725 Chestnut St New Orleans, LA | 2.0 | 2.0 | 1766 | $2,500 | $1.42 | 43d | 1 | 0.50mi |
| 532 1st St New Orleans, LA | 2.0 | 1.5 | 1202 | $2,175 | $1.81 | 3d | 1 | 0.50mi |
| 1104 2nd St Unit B New Orleans, LA | 2.0 | 2.0 | 1750 | $10,000 | $5.71 | 23d | 1 | 0.52mi |
| 428 1st St New Orleans, LA | 2.0 | 1.5 | 1378 | $2,800 | $2.03 | 23d | 1 | 0.53mi |
| 2325 Laurel St New Orleans, LA | 2.0 | 1.0 | 1200 | $1,600 | $1.33 | 17d | 1 | 0.59mi |
| 1441 Washington Ave Unit A New Orleans, LA | 2.0 | 2.5 | 2027 | $3,500 | $1.73 | 11d | 1 | 0.59mi |
| 2726 Prytania St #7 New Orleans, LA | 2.0 | 2.0 | 1436 | $2,500 | $1.74 | 43d | 1 | 0.60mi |
| 2726 Prytania St #7 New Orleans, LA | 2.0 | 2.0 | 1436 | $2,350 | $1.64 | 23d | 1 | 0.60mi |
| 1525 Louisiana Ave New Orleans, LA | 2.0 | 1.0 | 1650 | $2,500 | $1.52 | 17d | 1 | 0.61mi |
| 3201 Saint Charles Ave New Orleans, LA | 1.0–2.0 | 1.0–2.0 | 922 | $2,250 | $2.44 | 17d | 4 | 0.66mi |
| 536 Jackson Ave New Orleans, LA | 2.0 | 1.0 | 1259 | $2,475 | $1.97 | 21d | 1 | 0.70mi |
| 939 Jackson Ave New Orleans, LA | 2.0 | 2.0 | 1500 | $2,950 | $1.97 | 43d | 1 | 0.74mi |
| 1706 Seventh St Unit B New Orleans, LA | 2.0 | 1.0 | 1158 | $1,550 | $1.34 | 23d | 1 | 0.74mi |
| 2115 Chippewa St New Orleans, LA | 3.0 | 2.0 | 1315 | $2,500 | $1.90 | 43d | 1 | 0.75mi |
| 2115 Chippewa St New Orleans, LA | 3.0 | 2.0 | 1315 | $2,400 | $1.83 | 16d | 1 | 0.75mi |
| 1719 Seventh St Unit A New Orleans, LA | 2.0 | 1.0 | 1093 | $1,525 | $1.40 | 23d | 1 | 0.76mi |
| 427 Jackson Ave New Orleans, LA | 1.0–2.0 | 1.0–2.0 | 915 | $3,495 | $3.82 | 1d | 4 | 0.76mi |
| 1725 Louisiana Ave New Orleans, LA | 2.0 | 2.0 | 1350 | $2,000 | $1.48 | 23d | 1 | 0.78mi |
| 1618 3rd St New Orleans, LA | 2.0 | 1.0 | 1210 | $1,850 | $1.53 | 23d | 1 | 0.78mi |
| 3900 Prytania St Unit D New Orleans, LA | 2.0 | 1.0 | 1050 | $1,700 | $1.62 | 23d | 1 | 0.79mi |
| 2931 Baronne St New Orleans, LA | 3.0 | 1.0 | 1145 | $1,510 | $1.32 | 23d | 1 | 0.80mi |
| 2041 S Chippewa St Unit 2041 New Orleans, LA | 3.0 | 2.5 | 1400 | $2,700 | $1.93 | 43d | 1 | 0.80mi |
| 4023 Tchoupitoulas St New Orleans, LA | 3.0 | 2.0 | 1608 | $3,200 | $1.99 | 43d | 1 | 0.82mi |
| 3439 Baronne St New Orleans, LA | 2.0 | 2.0 | 1492 | $3,500 | $2.35 | 16d | 1 | 0.83mi |
| 3429 Baronne St New Orleans, LA | 3.0 | 2.5 | 1600 | $2,500 | $1.56 | 43d | 1 | 0.84mi |
Listing history 35 events
-
2026-06-18days on market $230,000 Active 49 DOM
-
2026-06-17days on market $230,000 Active 48 DOM
-
2026-06-16days on market $230,000 Active 47 DOM
-
2026-06-15days on market $230,000 Active 46 DOM
-
2026-06-13days on market $230,000 Active 44 DOM
-
2026-06-10days on market $230,000 Active 41 DOM
-
2026-06-09days on market $230,000 Active 40 DOM
-
2026-06-08days on market $230,000 Active 39 DOM
-
2026-06-07days on market $230,000 Active 38 DOM
-
2026-06-05days on market $230,000 Active 35 DOM
-
2026-06-03days on market $230,000 Active 34 DOM
-
2026-06-02days on market $230,000 Active 33 DOM
-
2026-06-01days on market $230,000 Active 32 DOM
-
2026-05-31days on market $230,000 Active 31 DOM
-
2026-04-30$230,000 Active 673-char remark
Show marketing remark (673 chars)
This solid Irish Channel residence features two stories, three bedrooms, and two half-baths. It includes a living/dining area, a den, and a combination of wood and tile flooring. Notable features of the house include original stained-glass window, wooden mantles, oak doors, and original architectural corbels. There are two wooden interior staircases and a large porch/balcony on the second floor. The property also offers ample side yard space, perfect for entertaining or parking. Additionally, there is potential to convert it into a multifamily residence. It is conveniently located within walking distance of all that Magazine and Tchoupitoulas Streets have to offer.
-
2025-11-29price $257,000
-
2025-11-14price $257,000
-
2025-09-09$279,000 Active
-
2025-09-09$279,000 Active
-
2025-04-02price $287,000
-
2025-04-02price $287,000
-
2024-12-06$299,000 Active
-
2024-01-24$315,000
-
2023-10-01$327,000
-
2019-10-16$327,000
-
2016-01-10historical
-
2016-01-10historical
-
2015-11-21price $350,000
-
2015-11-21price $350,000
-
2015-10-09$395,000 Active
-
2015-10-09$395,000 Active
-
2015-10-09$350,000
-
2015-10-09$350,000
-
1980-10-07soldstatus $11,500
ⓘ Source: listings_history table (triggers on properties + properties_extension) + one-shot
backfill from property_details.listing_events for pre-trigger history.
Tax reassessment forecast LA · Resets to sale price
- Current annual tax
- $4,072 · $339/mo
- Projected year-2 tax
- $4,072 · $339/mo
- Expected delta
- $0/yr ($0/mo · 0.0%)
ⓘ Screening estimate from a state-policy table — verify with the county assessor before closing.
Climate risk First Street
- Flood 6/10 Major FEMA zone X · 56% chance over 30 yrs
- Wildfire 1/10 Low
- Heat 10/10 Extreme 7 d/yr ≥108°F today · 21 d/yr by 30 yrs out
- Wind 10/10 Extreme 99% chance of damaging wind over 30 yrs
- Air quality 3/10 Moderate 3 unhealthy d/yr today · 4 by 30 yrs out
Nearby sold comps map
Loading sold comps map…
Walkable amenities ~0.75 mi
Loading nearby amenities…
Taxation est. · year 1
- Rental income
- $32,541
- − Mortgage interest
- −$12,884
- − Property taxes
- −$4,072
- − Insurance
- −$1,150
- − Repairs & maintenance
- −$2,603
- − Management
- −$2,603
- − Depreciation
- −$6,691
- Taxable income
- $2,537
- Est. tax owed @ 24.0%
- −$609
- After-tax cash flow
- $5,402/yr
For passive investors: Depreciation is non-cash, so a rental often shows a tax loss while cash-flowing — sheltering income. Rental losses are passive: they offset passive income freely, and up to $25,000/yr can offset ordinary (W-2) income if you actively participate and your MAGI is under $100k (phasing out to $0 by $150k); unused losses carry forward. On sale, claimed depreciation is recaptured at up to 25%, and gains may owe capital-gains tax (a 1031 exchange can defer both). Figures are a year-1 estimate at your 24.0% rate — not tax advice; consult a CPA.
Schools (NCES district)
- District
- Orleans Parish
- NCES district ID
- 2201170
- Math proficiency
- 11% ▼ -52.00%
- Reading proficiency
- 27% ▼ -46.00%
- Median HH income
- $37,011
- Composite
- 15.78/100
- National rank
- #9271
- State rank
- #69 of 98 in LA
Livability — New Orleans
- Score
- 81/100
- State rank
- #3
- US rank
- #1383
Category grades
Schools grade is shown separately in the Schools card above.
Census & demographics
- Census place
- New Orleans, LA
- County
- Orleans Parish · 338,817 people
- City population
- 338,817
- Metro
- New Orleans-Metairie, LA
- Population (ZIP)
- 31,183
- Household income
- $90,182
- Rent vs Own
- Severe rent burden
- 1756.0
Population outlook (Orleans County) Hauer SSP2
- Today (2025)
- 513,025 people
- By 2030
- 575,781 · +12.2%
- By 2040
- 700,174 · +36.5%
- By 2050
- 826,541 · +61.1%
- By 2075
- 1,123,374 · +119.0%
- By 2100
- 1,355,609 · +164.2%
Race, ethnicity, and origin ACS 2023
- Neighborhood character
- Diverse neighborhood (Simpson 0.58)
- Race & ethnicity
- White 59% Black 26% Two or more races 8% Hispanic / Latino 7% Asian 3%
- Hispanic origin (detail)
- Mexican 1%
- Common ancestry
- Lithuanian 8% Italian 3% Slovak 3%
- Foreign-born
- 5% · Canada, China
- Languages at home
- 91% English-only · Spanish 4% French/Haitian/Cajun 2% Other Indo-European 1%
Political lean MEDSL · Orleans
- 2024 margin
- Solid D (+67.0) · D 82.2% · R 15.2% · Other 2.7%
- 2008→2024 swing
- +6.7pp toward D · 2008: 60.3pp · 2024: 67.0pp
- All cycles
- 2024: D+67.0 2020: D+68.2 2016: D+66.2 2012: D+62.5 2008: D+60.3
Not yet ingested
- Civics
- —
Market trends
- HPI YoY
- ▼ -272.08%
- Current HPI
- 287.2138
- Rent YoY
- ▼ -1.42%
- Metro
- New Orleans-Metairie, LA
- State GDP YoY
- ▲ 3.29%
- F500 in state
- 10
Industry mix (Fortune 500 HQ in LA)
| Industry | F500 HQs | Revenue |
|---|---|---|
| Telecommunications | 2 | $23B |
|
||
| Utilities | 1 | $12B |
|
||
| Wholesale / Distribution | 1 | $5B |
|
||
| Advertising | 1 | $2B |
|
||
Price history
+1900.0% since first listed20 events — show timeline
- 2026-04-30 Listed $230,000 GSREIN
- 2026-04-30 Listed $230,000 AcadianaMLS
- 2025-11-29 Price Changed $257,000 AcadianaMLS
- 2025-11-14 Price Changed $257,000 GSREIN
- 2025-09-09 Listed $279,000 AcadianaMLS
- 2025-04-02 Price Changed $287,000 AcadianaMLS
- 2025-04-02 Price Changed $287,000 GSREIN
- 2024-12-06 Listed $299,000 AcadianaMLS
- 2024-01-24 Listed $315,000 AcadianaMLS
- 2023-10-01 Listed $327,000 AcadianaMLS
- 2019-10-16 Listed $327,000 AcadianaMLS
- 2016-01-10 Listing Removed — GSREIN
- 2016-01-10 Listing Removed — GSREIN
- 2015-11-21 Price Changed $350,000 GSREIN
- 2015-11-21 Price Changed $350,000 GSREIN
- 2015-10-09 Listed $395,000 GSREIN
- 2015-10-09 Listed $395,000 GSREIN
- 2015-10-09 Listed $350,000 AcadianaMLS
- 2015-10-09 Listed $350,000 AcadianaMLS
- 1980-10-07 Sold (Public Records) $11,500 Public Records
Property tax history
+2.7%/yrLatest (2026): $4,072 · -24.5% YoY. Source: county tax records.
Cash-flow waterfall
monthlySold comps — $/sqft
last 12 mo · ≤1 miLoading sold comps…