 🏗️ New Construction
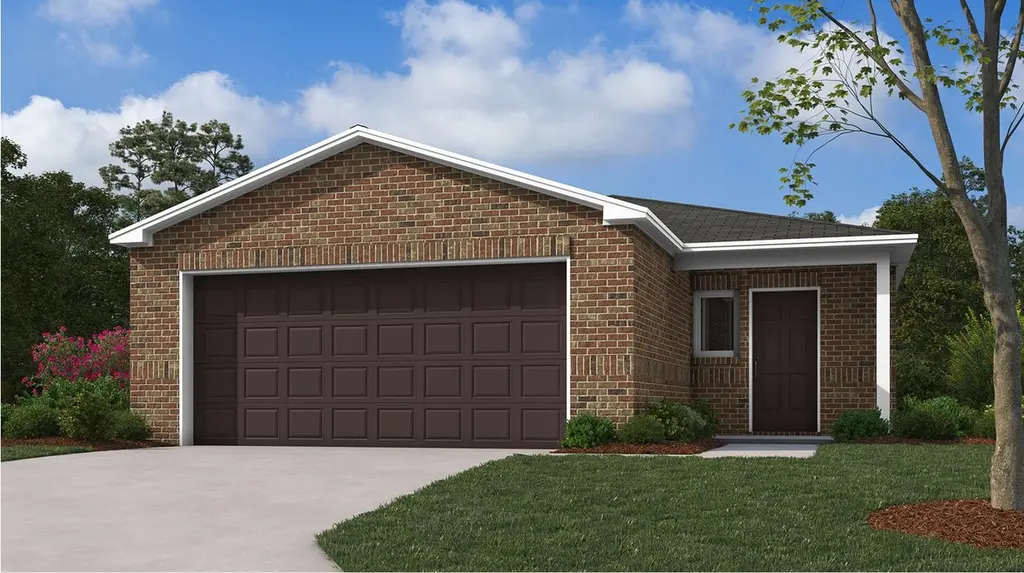
RC Keswick Plan · North Little Rock, AR
Flood risk No data
- FEMA flood zone
- —
- Chance of flooding over 30 yrs
- —
- Est. flood insurance / yr
- —
Fire risk No data
- Est. fire insurance / yr
- —
Heat risk No data
- Hot days now (above threshold)
- —
- Hot days in 30 yrs
- —
Wind risk No data
- Chance of severe wind over 30 yrs
- —
Air-quality risk No data
- Unhealthy air days now
- —
- Unhealthy air days in 30 yrs
- —
Risk factors via First Street. Map © Google.
Why this score? — see what drove the F grade
The composite is a weighted blend of 9 inputs, each scored 0–100. Each bar is that input's sub-score; the figure is the points it added to the 100-point composite (weight × sub-score).
- ARV discount +7.5/15.0
- Cash flow +7.3/30.0
- Livability +3.7/5.0
- Schools +2.6/10.0
- 1% rule +2.1/10.0
- Rent growth +2.0/5.0
- DSCR +1.5/10.0
- Condition / age +1.0/5.0
- Appreciation +0.0/10.0
$193,900
🖨 Deal sheet (PDF) 📄 Offer letter ✓ Due diligence
Listing remarks MLS
This single-story home is designed for modern lifestyles. A spacious and flexible open-concept layout combines the kitchen, living and dining areas to maximize interior space. One bedroom is tucked away to the side, with two additional bedrooms located at the back of the home, including the lavish owner's suite with a full bathroom and walk-in closet.
Key facts
- 2 garage spots
- Listed 416 days
Neighborhood map
What this means for you Summary
Snapshot
- This is a 3-bed/2.0-bath single-family listed at $194k. Condition is rated poor.
Deal economics
- At list price, monthly cash flow is $-301 ($-4k/yr) — negative.
- To cash-flow at today's rent, offer at most $183k (5.4% below list).
- To meet the 1% rule (rent ≥ 1% of price), the offer needs to be $160k (17.3% below list).
- Recommended offer: $160k (17.3% below list) — sets the bar for 1% rule.
Location & tenants
- Location reads 73/100 on livability (#24 in AR) — a middle-class / working-renter tenant base. Strengths: commute A+, cost of living A+, housing A+; Watch: crime F, amenities F, employment D-.
- Pulaski County Spec. School District (rural): math 27% / reading 31% proficiency, ranked #150 of 238 in AR (top 63%) — low school quality limits family demand, transient renter base, plan for 1-2y turnover.
- Zoned schools: Crystal Hill Elementary (math 23% / reading 16%, grade F, #383 of 454 statewide, top 86%, 504 students, 96% FRL); Maumelle Middle School (math 25% / reading 31%, grade F, #150 of 201 statewide, top 76%, 589 students, 56% FRL); Maumelle High School (math 16% / reading 25%, grade F, #233 of 292 statewide, top 80%, 844 students, 40% FRL) — zoned schools average 64% FRL vs 48% district-wide (17 pts higher); higher-poverty schools than district average — tighter screening recommended.
- Market conditions: Rents soft (-2.1%/yr); 269 active listings in the ZIP; 6 comparable units currently listed for rent nearby; rentals at typical pace (median 26d on market — plan ~3-4 weeks tenant-placement turnaround); solid renter incomes; 1,006 units permitted in Pulaski County in 2024 (0 in 5+ unit buildings).
Forward outlook
- Local home prices are declining (-3.0%/yr); year-one equity from $2k of loan paydown is wiped out by about $7k of value loss. Plan a longer hold.
- Pulaski County population projected at +6% by 2050 — modest demand growth; plan on rents tracking national, not racing it.
Negotiation context
- It's been on market 416 days — a 12% lower offer ($171k) is reasonable based on typical stale-listing flexibility.
- 2 sale attempts with the ask held roughly flat each time — persistent listings suggest the price (not the market) is what's stuck; bring a comps-based counter.
Questions for the listing agent
- What do current leases actually rent for vs. the listed asking? Can we see a recent rent roll and the last 12 months of T-12 income?
- It's been on market 416 days. Have you received any prior offers? Is the seller open to a 17% concession, seller financing, or rate buy-down credit?
- Have any recent inspections been done? Can we get a copy of the seller's disclosures and any deferred-maintenance estimates?
- Why hasn't it sold? Are there any deal-killer items the seller is aware of (foundation, flood, title, zoning, code violations)?
- Is there a deadline driving the sale (1031 exchange, divorce, estate, relocation)? That informs how much negotiation room exists.
- Schools are D-rated, which usually means shorter tenancies and higher turnover. Who's the typical renter profile here, and what's been the actual vacancy rate?
- Crime grade is F in this area — have there been break-ins, vandalism, or insurance claims at this property in the last 3 years? What carrier currently insures it and at what premium?
- The area grade is low — what's the realistic commute time and amenity access for the typical tenant pool here? Any planned neighborhood developments (good or bad) we should know about?
- What's the average days-on-market for RENTAL listings here right now (not sales)? A rising rental-DOM trend means longer vacancies and softer asking-rent achievability than the comps imply.
- What's the recent tenant-quality profile in this submarket — average credit score on applications, eviction rate, late-payment / NSF rate, and stable-employment percentage? A property-management company in the area should have these aggregated.
- How much new for-sale + rental construction is in the pipeline within 1–3 miles? Heavy new supply typically softens prices + rents 12–24 months out; constrained supply supports both.
Investment metrics
- 1% rule
- 0.71% ✗
- Cap rate
- 4.70%
- Cash-on-cash
- -5.68%
- DSCR
- 0.75
- GRM
- 11.8
CMA / ARV
- ARV (median comp)
- $226,896
- List price
- $193,900
- Delta
- -14.54%
- Verdict
- UNDERPRICED
- Comps
- 20 within 1.0 mi
Show comp detail 12 sales within ~0.75 mi
| Address | Dist | Beds/Ba | Sqft | Sold | Price | $/sf | Match |
|---|---|---|---|---|---|---|---|
| 10608 Mason Dr | 0.37mi | 3/2.0 | 1,051 (0%) | 2mo | $176,850 | $168 | 82 |
| 10620 Mason Dr | 0.37mi | 3/2.0 | 1,051 (0%) | 3mo | $173,000 | $165 | 80 |
| 10908 Mason Dr | 0.43mi | 3/2.0 | 1,051 (0%) | 3mo | $187,000 | $178 | 77 |
| 10808 Mason Dr | 0.38mi | 3/2.0 | 1,051 (0%) | 6mo | $184,000 | $175 | 77 |
| 10313 Paul Eells Dr | 0.31mi | 3/2.0 | 1,125 (+7%) | 4mo | $198,000 | $176 | 70 |
| 10221 Paul Eells Dr | 0.39mi | 3/2.0 | 1,125 (+7%) | 2mo | $199,735 | $178 | 69 |
| 10301 Paul Eells Dr | 0.39mi | 3/2.0 | 1,125 (+7%) | 3mo | $196,285 | $174 | 68 |
| 10401 Paul Eells Dr | 0.39mi | 3/2.0 | 1,125 (+7%) | 4mo | $195,000 | $173 | 67 |
| 10417 Paul Eells Dr | 0.39mi | 3/2.0 | 1,125 (+7%) | 4mo | $194,435 | $173 | 67 |
| 10709 Mason Dr | 0.35mi | 2/2.0 (-1) | 1,114 (+6%) | 5mo | $188,125 | $169 | 65 |
| 8204 Stacey Ln | 0.40mi | 3/2.0 | 1,145 (+9%) | 7mo | $179,025 | $156 | 60 |
| 8209 Fitzgerald Ln | 0.63mi | 2/2.0 (-1) | 1,114 (+6%) | 8mo | $164,900 | $148 | 48 |
Match score weights: distance 35% · size 25% · config 20% · recency 20%. Top-matched comps best support the ARV.
Projected returns pro-forma
-3.0% appreciation · 0.0% rent growth · sell at horizon
- IRR
- -29.4%
- Equity multiple
- 0.05×
- Total profit
- $-60,606
- Equity at exit
- $33,831
- IRR
- -48.4%
- Equity multiple
- -0.50×
- Total profit
- $-95,518
- Equity at exit
- $19,618
Cash invested: $63,531 (down + closing). Projections, not guarantees.
Landlord ↔ Tenant lean methodology
- Overall (STATE)
- 92 Strongly Landlord-Friendly
- State Arkansas
- 92 Strongly Landlord-Friendly · R+14
- County
- — inherits STATE
- City
- — inherits STATE
ZIP-level market 72113
- Home prices YoY
- -17.0%
- Rents YoY
- -2.1%
- Active inventory
- 269
- Price-to-rent
- 10.1×
Monthly cashflow live
- Estimated rent
- $1,604 high interval (Pro) →
- Mortgage (P&I)
- −$1,190
- Tax est. 1.5%
- −$284 /mo · $3,403/yr
- Insurance
- −$95
- HOA
- −$0
- Vacancy / Maint / Mgmt
- −$337
- Net cashflow
- $-301
Break-even live
Sensitivity live
| Price | -10% $-144 | -5% $-222 | +0% $-301 | +5% $-379 | +10% $-458 |
|---|---|---|---|---|---|
| Rent | -10% $-428 | -5% $-364 | +0% $-301 | +5% $-238 | +10% $-174 |
| Rate | -1.0pp $-187 | -0.5pp $-243 | base $-301 | +0.5pp $-360 | +1.0pp $-419 |
UW: 25.0% down · 7.5% · 30yr · 1.5% tax · 5.0% vac · 8.0% maint · 8.0% mgmt
Financing live
Cash to close
- Down payment
- $56,724
- Closing costs
- $6,807
- Reserves months
- —
- Total cash needed
- —
Loan-product check · same deal, 3 products live
Conventional
25% down · 7.5% · 30yr
- Down + closing
- —
- Monthly P&I
- —
- Monthly cashflow
- —
- DSCR
- —
- Eligible?
- —
Personal DTI + credit; lowest rate.
DSCR
20% down · 8.5% · 30yr
- Down + closing
- —
- Monthly P&I
- —
- Monthly cashflow
- —
- DSCR
- —
- Eligible?
- —
No personal income docs; deal must DSCR.
Hard money
10% down · 12.0% · 12mo
- Down + closing
- —
- Monthly P&I
- —
- Monthly cashflow
- —
- DSCR
- —
- Eligible?
- —
Short-term bridge; refi at stabilization.
Rent comps 6 comps
| Address | Beds | Baths | Sqft | Rent | $/sqft | DOM | Units | Dist |
|---|---|---|---|---|---|---|---|---|
| 10224 Debbie Dr North Little Rock, AR | 3.0 | 2.0 | 1340 | $1,655 | $1.24 | 45d | 1 | 0.11mi |
| 208 Sofia Dr Maumelle, AR | 3.0 | 2.0 | 1472 | $1,775 | $1.21 | 25d | 1 | 0.34mi |
| 8213 Eastwood Creek Dr North Little Rock, AR | 3.0 | 2.0 | 1402 | $1,750 | $1.25 | 25d | 1 | 0.35mi |
| 8305 Counts Massie Rd North Little Rock, AR | 1.0–2.0 | 1.0–2.0 | 818 | $1,100 | $1.34 | 16d | 1 | 0.78mi |
| 12025 Paul Eells Dr North Little Rock, AR | 1.0–2.0 | 1.0–2.0 | 818 | $1,100 | $1.34 | 16d | 1 | 1.22mi |
| 8000 River Pointe Dr North Little Rock, AR | 1.0–2.0 | 1.0–2.0 | 1004 | $1,502 | $1.50 | 16d | 17 | 1.47mi |
Listing history 19 events
-
2026-06-21days on market $193,900 Active 416 DOM
-
2026-06-18days on market $193,900 Active 413 DOM
-
2026-06-17days on market $193,900 Active 412 DOM
-
2026-06-16days on market $193,900 Active 411 DOM
-
2026-06-15days on market $193,900 Active 410 DOM
-
2026-06-14days on market $193,900 Active 408 DOM
-
2026-06-13days on market $193,900 Active 407 DOM
-
2026-06-10days on market $193,900 Active 405 DOM
-
2026-06-09days on market $193,900 Active 404 DOM
-
2026-06-08days on market $193,900 Active 403 DOM
-
2026-06-07days on market $193,900 Active 402 DOM
-
2026-06-05days on market $193,900 Active 399 DOM
-
2026-06-03days on market $193,900 Active 398 DOM
-
2026-06-02days on market $193,900 Active 397 DOM
-
2026-06-01days on market $193,900 Active 396 DOM
-
2026-05-31days on market $193,900 Active 395 DOM
-
2026-05-31days on market $193,900 Active 394 DOM
-
2025-05-02$193,900 Active 353-char remark
Show marketing remark (353 chars)
This single-story home is designed for modern lifestyles. A spacious and flexible open-concept layout combines the kitchen, living and dining areas to maximize interior space. One bedroom is tucked away to the side, with two additional bedrooms located at the back of the home, including the lavish owner's suite with a full bathroom and walk-in closet.
ⓘ Source: listings_history table (triggers on properties + properties_extension) + one-shot
backfill from property_details.listing_events for pre-trigger history.
Nearby sold comps map
Loading sold comps map…
Walkable amenities ~0.75 mi
Loading nearby amenities…
Taxation est. · year 1
- Rental income
- $19,248
- − Mortgage interest
- −$12,710
- − Property taxes
- −$3,403
- − Insurance
- −$1,134
- − Repairs & maintenance
- −$1,540
- − Management
- −$1,540
- − Depreciation
- −$6,601
- Taxable loss
- −$7,680
- Est. tax savings @ 24.0%
- +$1,843
- After-tax cash flow
- $-1,767/yr
For passive investors: Depreciation is non-cash, so a rental often shows a tax loss while cash-flowing — sheltering income. Rental losses are passive: they offset passive income freely, and up to $25,000/yr can offset ordinary (W-2) income if you actively participate and your MAGI is under $100k (phasing out to $0 by $150k); unused losses carry forward. On sale, claimed depreciation is recaptured at up to 25%, and gains may owe capital-gains tax (a 1031 exchange can defer both). Figures are a year-1 estimate at your 24.0% rate — not tax advice; consult a CPA.
Condition & rehab AI · 2 photos
This single-story home requires extensive repairs and maintenance, including major work on the siding, roof, and landscaping. Significant updates are needed to bring the property up to a livable condition.
Repairs flagged
- Major siding — Severe weathering
- Major paint — Peeling and chipping
- Major roof — Significant wear
- Major landscaping — Overgrown and unkempt
Value-add opportunities
- Both painting and repainting — Fresh paint enhances curb appeal and interior aesthetics
- Both landscaping — Well-maintained landscaping improves curb appeal and property value
- Both roof repair — A new roof ensures structural integrity and protects the home
- Both siding repair — New siding improves the home's appearance and durability
Renovation cost estimate screening
| Repair item | Severity | Est. cost |
|---|---|---|
| siding · Severe weathering | Major | $15,000–50,000 |
| paint · Peeling and chipping | Major | $15,000–50,000 |
| roof · Significant wear | Major | $15,000–50,000 |
| landscaping · Overgrown and unkempt | Major | $15,000–50,000 |
| Total estimated repair cost · 4 items | $60,000–200,000 |
Value-add ROI direction
- Both painting and repainting — Fresh paint enhances curb appeal and interior aesthetics ↑
- Both landscaping — Well-maintained landscaping improves curb appeal and property value ↑
- Both roof repair — A new roof ensures structural integrity and protects the home ↑
- Both siding repair — New siding improves the home's appearance and durability ↑
ⓘ Cost ranges are severity-bucket heuristics (US national rule-of-thumb). Get contractor quotes + a written scope before underwriting a rehab budget.
Schools (NCES district)
- District
- Pulaski County Spec. School District
- NCES district ID
- 0511850
- Math proficiency
- 27% ▼ -13.00%
- Reading proficiency
- 31% ▼ -10.00%
- Median HH income
- $53,218
- Composite
- 25.67/100
- National rank
- #7394
- State rank
- #150 of 238 in AR
Livability — North Little Rock
- Score
- 73/100
- State rank
- #24
- US rank
- #5452
Category grades
Schools grade is shown separately in the Schools card above.
Census & demographics
- Census place
- North Little Rock, AR
- County
- Pulaski County · 372,764 people
- City population
- 55,470
- Metro
- Little Rock-North Little Rock-Conway, AR
- Population (ZIP)
- 25,596
- Household income
- $79,248
- Rent vs Own
- Severe rent burden
- 746.0
Population outlook (Pulaski County) Hauer SSP2
- Today (2025)
- 415,378 people
- By 2030
- 423,720 · +2.0%
- By 2040
- 435,182 · +4.8%
- By 2050
- 440,904 · +6.1%
- By 2075
- 445,521 · +7.3%
- By 2100
- 419,173 · +0.9%
Race, ethnicity, and origin ACS 2023
- Neighborhood character
- Diverse neighborhood (Simpson 0.56)
- Race & ethnicity
- White 60% Black 27% Two or more races 8% Hispanic / Latino 5% Asian 3%
- Common ancestry
- Lithuanian 3% Slovak 2% Italian 1%
- Foreign-born
- 5% · Canada, Dominican Republic, China
- Languages at home
- 94% English-only · Spanish 3% Tagalog/Filipino 1% French/Haitian/Cajun 1%
Political lean MEDSL · Pulaski
- 2024 margin
- Strong D (+22.1) · D 59.8% · R 37.7% · Other 2.5%
- 2008→2024 swing
- +10.6pp toward D · 2008: 11.6pp · 2024: 22.1pp
- All cycles
- 2024: D+22.1 2020: D+22.5 2016: D+17.9 2012: D+11.4 2008: D+11.6
Not yet ingested
- Civics
- —
Market trends
- HPI YoY
- ▼ -40.01%
- Current HPI
- 195.9346
- Rent YoY
- ▼ -2.08%
- Metro
- Little Rock-North Little Rock-Conway, AR
- State GDP YoY
- ▲ 3.80%
- F500 in state
- 10
Industry mix (Fortune 500 HQ in AR)
| Industry | F500 HQs | Revenue |
|---|---|---|
| Retail | 1 | $681B |
|
||
| Food / Agriculture | 1 | $53B |
|
||
| Retail / Energy | 1 | $22B |
|
||
| Transportation / Logistics | 1 | $12B |
|
||
| Energy | 1 | $4B |
|
||
Price history
+0.0% since first listed2 events — show timeline
- 2025-05-02 Listed $193,900 Zillow
- 2025-05-02 Listed $193,900 Zillow
Cash-flow waterfall
monthlySold comps — $/sqft
last 12 mo · ≤1 miLoading sold comps…