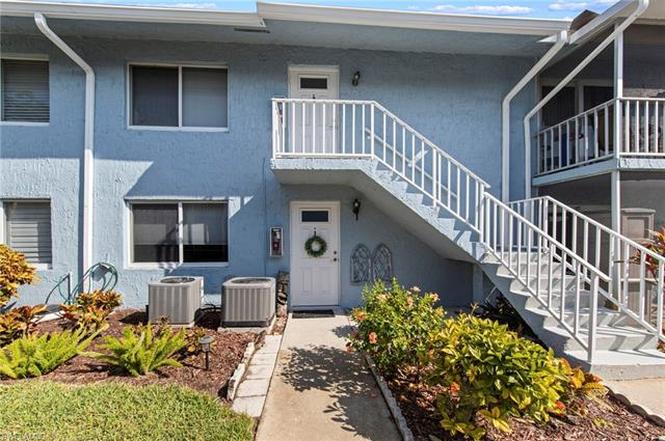
256 Palm Dr #1 · Naples, FL
Flood risk 9/10 · Severe
- FEMA flood zone
- AE
- Chance of flooding over 30 yrs
- 0.99%
- Est. flood insurance / yr
- $1,737 – $8,500
Fire risk 3/10 · Minor
- Est. fire insurance / yr
- $947 – $1,759
Heat risk 10/10 · Severe
- Hot days now (above 107°F)
- 7 days/yr
- Hot days in 30 yrs
- 28 days/yr
Wind risk 10/10 · Severe
- Chance of severe wind over 30 yrs
- 99.0%
Air-quality risk 3/10 · Minor
- Unhealthy air days now
- 3 days/yr
- Unhealthy air days in 30 yrs
- 3 days/yr
Risk factors via First Street. Map © Google.
Why this score? — see what drove the B- grade
The composite is a weighted blend of 9 inputs, each scored 0–100. Each bar is that input's sub-score; the figure is the points it added to the 100-point composite (weight × sub-score).
- Cash flow +26.6/30.0
- 1% rule +10.0/10.0
- DSCR +9.1/10.0
- ARV discount +7.5/15.0
- Schools +5.0/10.0
- Livability +4.0/5.0
- Condition / age +2.5/5.0
- Rent growth +2.1/5.0
- Appreciation +0.0/10.0
$169,900
🖨 Deal sheet 📄 Offer letter ✓ Due diligence
Listing remarks
Welcome to 256 Palm Drive #1, a 2-bedroom, 2-bath first-floor condominium offering 1,010 square feet of comfortable living space in The Glades Golf & Country Club. This well-maintained unit features easy first-floor access and valuable updates including newer plumbing, an A/C system approximately 6 years old, and a hot water heater (2009). Priced at $174,900, it presents an exceptional opportunity to enjoy bundled golf living at an attractive price point. The Glades Golf & Country Club offers unlimited play on two beautifully maintained golf courses, 12 pickleball courts, Har-Tru tennis courts, 9 swimming pools, the popular 19th Hole Restaurant, bocce, shuffleboard, and a full c
Key facts
- Pickleball courts
- A/c system
- Two golf courses
Tags
Property features AI
Finance
- Other: Part of Glades / Glades Country Club development; No commercial use and no RV allowed
- HOA & community: Mandatory HOA with on-site management; Monthly condo fee of $1,094 (total annual recurring fees $13,128); One-time fees $150; Community is golf-course bundled; Community amenities include clubhouse, community pool, golf course, bocce court, putting green, tennis and pickleball courts, shuffleboard, restaurant, library, vehicle wash area, and internet access; HOA maintenance covers cable, golf course, insurance, internet/WiFi, irrigation water, lawn/land maintenance, legal/accounting, manager, exterior and interior pest control, repairs, sewer, street maintenance, trash removal and water
Exterior
- Parking: Common parking
- Security: Impact resistant doors and windows (storm protection)
- Utilities: Central water; Central sewer; Central electric for heat and cooling
- Home design: Residential property; Low-rise building (1–3 stories); 2-story building
- Construction: Concrete block construction; Built in 1974
- Exterior features: Stucco exterior; Built-up/flat and shingle roofs; Impact resistant windows and sliding windows; Impact resistant doors; Zero lot line; Irrigation (central and reclaimed); Rear exposure faces west; View: see remarks
Interior
- Kitchen: Dishwasher; Disposal; Microwave; Range; Refrigerator
- Bedrooms: 2 bedrooms
- Flooring: Tile
- Bathrooms: 2 full bathrooms; Master bath with shower only
- Heating & cooling: Central electric heat; Central electric cooling
- Interior features: Foyer; Dining area connected to family room; Screened lanai/porch; Turnkey furnished; Split bedroom floor plan
- Laundry & utility: Washer; Dryer
Neighborhood map
What this means for you Summary
Snapshot
- This is a 2-bed/2.0-bath condo listed at $170k.
Deal economics
- At list price, monthly cash flow is $27 ($321/yr) — positive.
- The deal already cash-flows at list — no discount required.
- Meets the 1% rule at list price ($3k rent vs $170k).
- Recommended offer: $155k (9.0% below list) — sets the bar for market timing.
Location & tenants
- Location reads 80/100 on livability (#126 in FL, #1,903 nationally) — a professional / high-income tenant draw. Strengths: crime A+, amenities A+, employment A+; Watch: commute D+, cost of living F.
- Collier (suburban): math 60% / reading 56% proficiency, ranked #16 of 73 in FL (top 22%) — acceptable for families but not a draw, mixed tenant base, ~2y average lease.
- Market conditions: Rents soft (-1.7%/yr); 771 active listings in the ZIP; 40 comparable units currently listed for rent nearby; rentals at typical pace (median 14d on market — plan ~3-4 weeks tenant-placement turnaround); 3,520 units permitted in Collier County in 2024 (959 in 5+ unit buildings).
- At $3,231/mo this rent would consume 56% of the median local household income ($70k/yr) (locally 980% of renters already pay >50% of income on rent) — very limited rent-growth headroom before tenants either downsize or default.
Forward outlook
- Local home prices are declining (-3.0%/yr); year-one equity from $1k of loan paydown is wiped out by about $5k of value loss. Plan a longer hold.
- Collier County population projected at +30% by 2050 — long-run rental-demand tailwind backs the buy-and-hold thesis.
Negotiation context
- It's been on market 111 days — a 9% lower offer ($155k) is reasonable based on typical stale-listing flexibility.
- 4 sale attempts since 6y ago with the ask held roughly flat each time — persistent listings suggest the price (not the market) is what's stuck; bring a comps-based counter.
- Current owner paid $104k; list at $170k implies a 64% gain — meaningful room to come down on a strong offer.
Risks & watch-outs
- Watch-outs: flood insurance adds $427/mo; HOA is 34% of rent.
- Climate carrying-cost: in FEMA flood zone AE (mandatory federal flood insurance); severe wind risk, 99% chance of damaging wind over 30y; extreme-heat days projected 7→28/yr by 2055 (HVAC capex compounding) — expect insurance premiums to compound above CPI over the hold.
Questions for the listing agent
- It's been on market 111 days. Have you received any prior offers? Is the seller open to a 9% concession, seller financing, or rate buy-down credit?
- Built in 1974 — when were the roof, HVAC, electrical panel, plumbing, and water heater last replaced?
- What's the actual annual flood-insurance premium (NFIP or private), and is the property in a SFHA with mandatory coverage?
- What does the HOA fee cover, when was the last increase, and are there any pending special assessments or reserve-fund shortfalls?
- Any open or pending special assessments — roof, HVAC, plumbing, elevator, façade? What's the per-unit balance and payoff schedule, and is the seller paying it off at close or rolling it to the buyer?
- Why hasn't it sold? Are there any deal-killer items the seller is aware of (foundation, flood, title, zoning, code violations)?
- Is there a deadline driving the sale (1031 exchange, divorce, estate, relocation)? That informs how much negotiation room exists.
- Schools are B-rated — typically a magnet for longer-tenancy family renters. What's the average tenant stay here, and is there a school-zone premium baked into asking?
- What's the average days-on-market for RENTAL listings here right now (not sales)? A rising rental-DOM trend means longer vacancies and softer asking-rent achievability than the comps imply.
- What's the recent tenant-quality profile in this submarket — average credit score on applications, eviction rate, late-payment / NSF rate, and stable-employment percentage? A property-management company in the area should have these aggregated.
- How much new apartment / multifamily construction is in the pipeline within 1–3 miles? Heavy new supply (>2% of stock underway) typically softens rents 12–24 months out; light construction supports rent growth.
Investment metrics
- 1% rule
- 1.90% ✓
- Cap rate
- 9.49%
- Cash-on-cash
- 11.43%
- DSCR
- 1.51
- GRM
- 4.4
CMA / ARV
No comps found within radius.
Projected returns pro-forma
-3.0% appreciation · 0.0% rent growth · sell at horizon
- IRR
- -22.2%
- Equity multiple
- 0.28×
- Total profit
- $-34,417
- Equity at exit
- $25,333
- IRR
- -57.7%
- Equity multiple
- -0.28×
- Total profit
- $-60,799
- Equity at exit
- $14,690
Cash invested: $47,572 (down + closing). Projections, not guarantees.
Landlord ↔ Tenant lean methodology
- Overall (STATE)
- 87 Strongly Landlord-Friendly
- State Florida
- 87 Strongly Landlord-Friendly · R+3
- County
- — inherits STATE
- City
- — inherits STATE
ZIP-level market 34112
- Rents YoY
- -1.7%
- Active inventory
- 771
- Price-to-rent
- 4.4×
Monthly cashflow live
- Estimated rent
- $3,231 high interval (Pro) →
- Mortgage (P&I)
- −$891
- Tax from tax record
- −$44 /mo · $524/yr
- Insurance
- −$71
- Flood insurance flood zone
- −$427 /mo · $5,118/yr
- HOA
- −$1,094
- Vacancy / Maint / Mgmt
- −$679
- Net cashflow
- $27
Break-even live
UW: 25.0% down · 7.5% · 30yr · 1.5% tax · 5.0% vac · 8.0% maint · 8.0% mgmt
Financing live
Cash to close
- Down payment
- $42,475
- Closing costs
- $5,097
- Reserves months
- —
- Total cash needed
- —
Loan-product check · same deal, 3 products live
Conventional
25% down · 7.5% · 30yr
- Down + closing
- —
- Monthly P&I
- —
- Monthly cashflow
- —
- DSCR
- —
- Eligible?
- —
Personal DTI + credit; lowest rate.
DSCR
20% down · 8.5% · 30yr
- Down + closing
- —
- Monthly P&I
- —
- Monthly cashflow
- —
- DSCR
- —
- Eligible?
- —
No personal income docs; deal must DSCR.
Hard money
10% down · 12.0% · 12mo
- Down + closing
- —
- Monthly P&I
- —
- Monthly cashflow
- —
- DSCR
- —
- Eligible?
- —
Short-term bridge; refi at stabilization.
Rent comps 40 comps
| Address | Beds | Baths | Sqft | Rent | $/sqft | DOM | Units | Dist |
|---|---|---|---|---|---|---|---|---|
| 256 Palm Dr #6 Naples, FL | 2.0 | 2.0 | 1010 | $4,500 | $4.46 | 14d | 1 | 0.00mi |
| 240 Palm Dr Unit 48-1 Naples, FL | 2.0 | 2.0 | 1100 | $1,800 | $1.64 | 23d | 1 | 0.04mi |
| 232 Palm Dr Unit 47-5 Naples, FL | 2.0 | 2.0 | 1010 | $2,500 | $2.48 | 23d | 1 | 0.06mi |
| 239 Palm Dr #2 Naples, FL | 2.0 | 2.0 | 1215 | $4,000 | $3.29 | 14d | 1 | 0.06mi |
| 265 Palm Dr Unit 265-2 Naples, FL | 2.0 | 2.0 | 1215 | $1,499 | $1.23 | 14d | 1 | 0.06mi |
| 229 Palm Dr Unit 229-2 Naples, FL | 2.0 | 2.0 | 1215 | $4,400 | $3.62 | 14d | 1 | 0.08mi |
| 216 Palm Dr #5 Naples, FL | 2.0 | 2.0 | 1010 | $4,500 | $4.46 | 14d | 1 | 0.09mi |
| 306 Palm Dr #2 Naples, FL | 2.0 | 2.0 | 1270 | $5,200 | $4.09 | 23d | 1 | 0.10mi |
| 200 Palm Dr #7 Naples, FL | 2.0 | 2.0 | 1010 | $1,600 | $1.58 | 14d | 1 | 0.13mi |
| 209 Palm Dr #1 Naples, FL | 2.0 | 2.0 | 1215 | $5,000 | $4.12 | 14d | 1 | 0.13mi |
| 146 Lollypop Ln #851 Naples, FL | 2.0 | 2.0 | 1335 | $3,750 | $2.81 | 23d | 1 | 0.14mi |
| 190 Palm Dr Unit 3085 Naples, FL | 2.0 | 2.0 | 1251 | $1,850 | $1.48 | 14d | 1 | 0.19mi |
| 202 Peppermint Ln #2 Naples, FL | 2.0 | 2.0 | 1335 | $5,000 | $3.75 | 14d | 1 | 0.19mi |
| 195 Peppermint Ln Unit 881 Naples, FL | 2.0 | 2.0 | 1335 | $5,000 | $3.75 | 14d | 1 | 0.19mi |
| 195 Peppermint Ln #2 Naples, FL | 2.0 | 2.0 | 1198 | $2,600 | $2.17 | 14d | 1 | 0.19mi |
| 195 Peppermint Ln Unit 884 Naples, FL | 2.0 | 2.0 | 1335 | $3,800 | $2.85 | 14d | 1 | 0.19mi |
| 195 Peppermint Ln Unit 4 Naples, FL | 2.0 | 2.0 | 1335 | $2,500 | $1.87 | 23d | 1 | 0.19mi |
| 348 Tern Dr Unit 4 Naples, FL | 2.0 | 2.0 | 1270 | $5,000 | $3.94 | 23d | 1 | 0.21mi |
| 348 Tern Dr #2 Naples, FL | 2.0 | 2.0 | 1270 | $1,800 | $1.42 | 14d | 1 | 0.21mi |
| 364 Tern Dr #4 Naples, FL | 2.0 | 2.0 | 1264 | $1,800 | $1.42 | 14d | 1 | 0.25mi |
| 131 Teryl Rd Unit 3UNIT 3 Naples, FL | 2.0 | 2.0 | 1080 | $1,750 | $1.62 | 14d | 1 | 0.25mi |
| 131 Teryl Rd Unit C3 Naples, FL | 2.0 | 2.0 | 1080 | $3,495 | $3.24 | 23d | 1 | 0.25mi |
| 159 Teryl Rd #2 Naples, FL | 2.0 | 2.0 | 1080 | $5,200 | $4.81 | 14d | 1 | 0.28mi |
| 154 Palm Dr Unit 1049699P Naples, FL | 2.0 | 2.0 | 1248 | $2,732 | $2.19 | 21d | 1 | 0.28mi |
| 149 Palm Dr Unit 8617 Naples, FL | 2.0 | 2.0 | 981 | $2,000 | $2.04 | 14d | 1 | 0.30mi |
| 2155 Great Blue Dr Naples, FL | 1.0–3.0 | 1.0–2.0 | 895 | $1,910 | $2.13 | 14d | 43 | 0.32mi |
| 162 Teryl Rd Unit 6-2 Naples, FL | 2.0 | 2.0 | 1188 | $2,500 | $2.10 | 23d | 1 | 0.32mi |
| 96 Glades Blvd Unit 513 Naples, FL | 2.0 | 2.0 | 1370 | $4,500 | $3.28 | 14d | 1 | 0.32mi |
| 135 Palm Dr #12 Naples, FL | 2.0 | 2.0 | 1180 | $2,200 | $1.86 | 14d | 1 | 0.32mi |
| 83 Glades Blvd #3 Naples, FL | 2.0 | 2.0 | 1204 | $5,200 | $4.32 | 14d | 1 | 0.41mi |
| 581 Teryl Rd #5 Naples, FL | 2.0 | 2.0 | 1403 | $4,500 | $3.21 | 14d | 1 | 0.43mi |
| 3608 Arctic Cir #514 Naples, FL | 2.0 | 2.0 | 1250 | $4,200 | $3.36 | 23d | 1 | 0.43mi |
| 3350 Putney Ct Naples, FL | 1.0–3.0 | 1.0–2.0 | 1038 | $2,986 | $2.88 | 14d | 26 | 0.46mi |
| 432 Teryl Rd Unit 1546319P Naples, FL | 2.0 | 2.0 | 1496 | $1,561 | $1.04 | 14d | 1 | 0.47mi |
| 3676 Arctic Cir #112 Naples, FL | 2.0 | 2.0 | 1246 | $2,700 | $2.17 | 21d | 1 | 0.48mi |
| 3618 Arctic Cir #3618 Naples, FL | 2.0 | 2.0 | 1200 | $3,450 | $2.88 | 23d | 1 | 0.48mi |
| 3504 Antarctic Cir Naples, FL | 2.0 | 2.0 | 1246 | $3,000 | $2.41 | 23d | 1 | 0.49mi |
| 3510 Antarctic Cir Unit 1 Naples, FL | 2.0 | 2.0 | 1200 | $2,350 | $1.96 | 23d | 1 | 0.50mi |
| 4472 Beechwood Lake Dr Naples, FL | 3.0 | 2.0 | 1352 | $3,050 | $2.26 | 23d | 1 | 0.50mi |
| 3005 Gordon St Naples, FL | 3.0 | 2.0 | 967 | $2,275 | $2.35 | 23d | 1 | 0.52mi |
HOA detail condo
- Monthly dues
- $1,094 · $13,128/yr
- Likely covers
- waterpool
- Assessments
- None detected in remarks — confirm with the listing agent.
Listing history 14 events
-
2026-06-18days on market $169,900 Active 111 DOM
-
2026-06-17days on market $169,900 Active 110 DOM
-
2026-06-16days on market $169,900 Active 109 DOM
-
2026-06-15days on market $169,900 Active 108 DOM
-
2026-06-14days on market $169,900 Active 106 DOM
-
2026-06-10days on market $169,900 Active 103 DOM
-
2026-06-09days on market $169,900 Active 102 DOM
-
2026-06-08days on market $169,900 Active 101 DOM
-
2026-06-07days on market $169,900 Active 100 DOM
-
2026-06-03days on market $169,900 Active 96 DOM
-
2026-06-02days on market $169,900 Active 95 DOM
-
2026-06-01days on market $169,900 Active 94 DOM
-
2026-05-31remarks 691-char remark
-
2026-05-31$169,900 Active 93 DOM
ⓘ Source: listings_history table (triggers on properties + properties_extension) + one-shot
backfill from property_details.listing_events for pre-trigger history.
Tax reassessment forecast FL · Resets to sale price
- Current annual tax
- $524 · $44/mo
- Projected year-2 tax
- $1,410 · $118/mo
- Expected delta
- +$886/yr (+$74/mo · 169.0%)
ⓘ Screening estimate from a state-policy table — verify with the county assessor before closing.
Climate risk First Street
- Flood 9/10 Extreme FEMA zone AE · 99% chance over 30 yrs
- Wildfire 3/10 Moderate
- Heat 10/10 Extreme 7 d/yr ≥107°F today · 28 d/yr by 30 yrs out
- Wind 10/10 Extreme 99% chance of damaging wind over 30 yrs
- Air quality 3/10 Moderate 3 unhealthy d/yr today · 3 by 30 yrs out
Nearby sold comps map
Loading sold comps map…
Walkable amenities ~0.75 mi
Loading nearby amenities…
Taxation est. · year 1
- Rental income
- $38,776
- − Mortgage interest
- −$9,517
- − Property taxes
- −$524
- − Insurance
- −$5,968
- − Repairs & maintenance
- −$3,102
- − Management
- −$3,102
- − HOA
- −$13,128
- − Depreciation
- −$4,943
- Taxable loss
- −$1,508
- Est. tax savings @ 24.0%
- +$362
- After-tax cash flow
- $683/yr
For passive investors: Depreciation is non-cash, so a rental often shows a tax loss while cash-flowing — sheltering income. Rental losses are passive: they offset passive income freely, and up to $25,000/yr can offset ordinary (W-2) income if you actively participate and your MAGI is under $100k (phasing out to $0 by $150k); unused losses carry forward. On sale, claimed depreciation is recaptured at up to 25%, and gains may owe capital-gains tax (a 1031 exchange can defer both). Figures are a year-1 estimate at your 24.0% rate — not tax advice; consult a CPA.
Schools (NCES district)
- District
- Collier
- NCES district ID
- 1200330
- Math proficiency
- 60% ▼ -4.00%
- Reading proficiency
- 56% ▼ -2.00%
- Median HH income
- $58,275
- Composite
- 50.23/100
- National rank
- #1892
- State rank
- #16 of 73 in FL
Livability — Naples
- Score
- 80/100
- State rank
- #126
- US rank
- #1903
Category grades
Schools grade is shown separately in the Schools card above.
Census & demographics
- County
- Collier County · 396,295 people
- City population
- 344,941
- Metro
- Naples-Marco Island, FL
- Population (ZIP)
- 27,193
- Household income
- $69,842
- Rent vs Own
- Severe rent burden
- 980.0
Population outlook (Collier County) Hauer SSP2
- Today (2025)
- 420,858 people
- By 2030
- 450,054 · +6.9%
- By 2040
- 502,232 · +19.3%
- By 2050
- 544,932 · +29.5%
- By 2075
- 627,203 · +49.0%
- By 2100
- 659,015 · +56.6%
Race, ethnicity, and origin ACS 2023
- Neighborhood character
- Predominantly White (74%)
- Race & ethnicity
- White 74% Hispanic / Latino 18% Two or more races 9% Black 6% Native American 2% Asian 1%
- Hispanic origin (detail)
- Mexican 7% Puerto Rican 2% Cuban 4% Dominican 1%
- Common ancestry
- Hispanic 4% Romanian 3% Portuguese 2%
- Foreign-born
- 19% · Canada, Jamaica
- Languages at home
- 75% English-only · Spanish 17% French/Haitian/Cajun 4% German/W. Germanic 1%
Political lean MEDSL · Collier
- 2024 margin
- Solid R (+33.1) · D 33.1% · R 66.2%
- 2008→2024 swing
- -10.6pp toward R · 2008: -22.5pp · 2024: -33.1pp
- All cycles
- 2024: R+33.1 2020: R+24.7 2016: R+26.0 2012: R+30.1 2008: R+22.5
Not yet ingested
- Civics
- —
Market trends
- HPI YoY
- ▼ -235.10%
- Current HPI
- 256.9182
- Rent YoY
- ▼ -1.69%
- Metro
- Naples-Marco Island, FL
- State GDP YoY
- ▲ 3.28%
- F500 in state
- 36
Industry mix (Fortune 500 HQ in FL)
| Industry | F500 HQs | Revenue |
|---|---|---|
| Industrial Technology | 2 | $29B |
|
||
| Insurance | 2 | $17B |
|
||
| Retail | 1 | $60B |
|
||
| Technology Distribution | 1 | $58B |
|
||
| Homebuilding | 1 | $35B |
|
||
| Technology Manufacturing | 1 | $35B |
|
||
Price history
+188.0% since first listed15 events — show timeline
- 2026-05-31 Price Changed $169,900 NAPLESMLS
- 2026-02-27 Listed $174,900 NAPLESMLS
- 2023-11-30 Listing Removed — NAPLESMLS
- 2023-11-11 Listed $236,000 NAPLESMLS
- 2023-08-15 Listing Removed — NAPLESMLS
- 2023-06-01 Listed $246,700 NAPLESMLS
- 2021-01-08 Sold (Public Records) $103,900 Public Records
- 2021-01-06 Sold (MLS) $103,900 NAPLESMLS
- 2020-12-06 Pending — NAPLESMLS
- 2020-09-25 Listed $109,900 NAPLESMLS
- 2008-06-13 Sold (Public Records) $115,000 Public Records
- 2000-12-01 Sold (Public Records) $64,000 Public Records
- 1999-12-30 Sold (Public Records) $57,500 Public Records
- 1991-12-01 Sold (Public Records) $55,500 Public Records
- 1984-07-01 Sold (Public Records) $59,000 Public Records
Property tax history
-2.9%/yrLatest (2025): $524 · +7.9% YoY. Source: county tax records.
Cash-flow waterfall
monthlySold comps — $/sqft
last 12 mo · ≤1 miLoading sold comps…