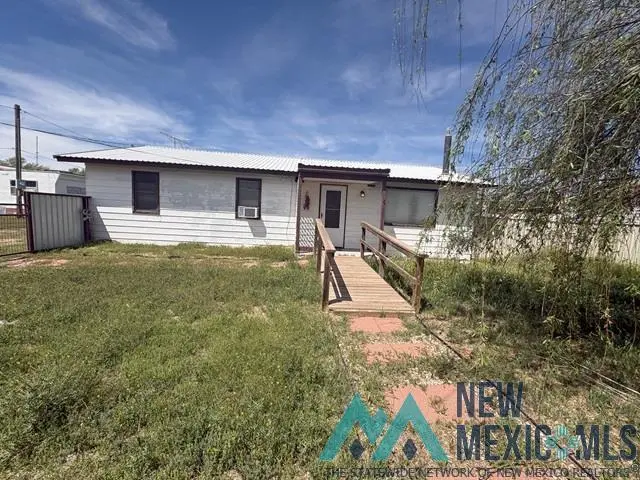
1796 S Roosevelt Rd 3 · Dora, NM
Flood risk 1/10 · Minimal
- FEMA flood zone
- D
- Chance of flooding over 30 yrs
- 0.0%
- Est. flood insurance / yr
- $544 – $1,084
Fire risk 3/10 · Minor
- Est. fire insurance / yr
- $706 – $1,312
Heat risk 4/10 · Minor
- Hot days now (above 97°F)
- 4 days/yr
- Hot days in 30 yrs
- 11 days/yr
Wind risk 2/10 · Minimal
- Chance of severe wind over 30 yrs
- 1.0%
Air-quality risk 1/10 · Minimal
- Unhealthy air days now
- 0 days/yr
- Unhealthy air days in 30 yrs
- 0 days/yr
Risk factors via First Street. Map © Google.
Why this score? — see what drove the C+ grade
The composite is a weighted blend of 9 inputs, each scored 0–100. Each bar is that input's sub-score; the figure is the points it added to the 100-point composite (weight × sub-score).
- Cash flow +26.6/30.0
- DSCR +9.1/10.0
- ARV discount +7.5/15.0
- 1% rule +7.1/10.0
- Rent growth +3.8/5.0
- Schools +3.1/10.0
- Livability +3.0/5.0
- Condition / age +2.2/5.0
- Appreciation +0.0/10.0
$90,000
🖨 Deal sheet 📄 Offer letter ✓ Due diligence
Listing remarks MLS
Attention Cash or Conventional Loan buyers, if you have the time, here is the opportunity. This property has plenty of projects and has the potential to produce some income or could be the perfect setup for you and yours. 3 single wide mobile homes and an additional single family home all on approximately 1.3 acres. The property also has an in ground storm shelter to weather storms when the occassion calls for it. Call a broker today for your private showing.
Key facts
- Single family home
- 1.3 acre lot
- 2 garage spots
Tags
Neighborhood map
What this means for you Summary
Snapshot
- This is a 3-bed/1.5-bath single-family listed at $90k. Condition is rated fair.
Deal economics
- At list price, monthly cash flow is $241 ($3k/yr) — positive.
- The deal already cash-flows at list — no discount required.
- Meets the 1% rule at list price ($1k rent vs $90k).
- Recommended offer: $85k (6.0% below list) — sets the bar for market timing.
Location & tenants
- Location reads 59/100 on livability (#132 in NM) — a working-class tenant base; expect higher turnover. Strengths: cost of living A+, housing A+; Watch: health & safety C-, schools F, crime F.
- Portales Municipal Schools (town): math 17% / reading 57% proficiency, ranked #15 of 29 in NM (top 52%) — families likely to look elsewhere, expect single-tenant / working-renter base with shorter leases; 62% free/reduced lunch — lower-income household profile, screen leases tightly.
- Market conditions: Rents rising fast (+5.4%/yr); 128 active listings in the ZIP; 31 units permitted in Roosevelt County in 2024 (0 in 5+ unit buildings).
Forward outlook
- Local home prices are declining (-3.0%/yr); year-one equity from $622 of loan paydown is wiped out by about $3k of value loss. Plan a longer hold.
- Roosevelt County population projected at -28% by 2050 — secular population decline; favor cash flow + early exit over multi-decade hold.
- At projected returns (-3.0% appreciation + 5.4% rent growth), your $25k cash investment doubles in ~8 years — after that, you're playing with house money.
Negotiation context
- It's been on market 67 days — a 6% lower offer ($85k) is reasonable based on typical stale-listing flexibility.
- 2 sale attempts with the ask held roughly flat each time — persistent listings suggest the price (not the market) is what's stuck; bring a comps-based counter.
Questions for the listing agent
- It's been on market 67 days. Have you received any prior offers? Is the seller open to a 6% concession, seller financing, or rate buy-down credit?
- Have any recent inspections been done? Can we get a copy of the seller's disclosures and any deferred-maintenance estimates?
- Why hasn't it sold? Are there any deal-killer items the seller is aware of (foundation, flood, title, zoning, code violations)?
- Is there a deadline driving the sale (1031 exchange, divorce, estate, relocation)? That informs how much negotiation room exists.
- Schools are F-rated, which usually means shorter tenancies and higher turnover. Who's the typical renter profile here, and what's been the actual vacancy rate?
- Crime grade is F in this area — have there been break-ins, vandalism, or insurance claims at this property in the last 3 years? What carrier currently insures it and at what premium?
- What's the average days-on-market for RENTAL listings here right now (not sales)? A rising rental-DOM trend means longer vacancies and softer asking-rent achievability than the comps imply.
- What's the recent tenant-quality profile in this submarket — average credit score on applications, eviction rate, late-payment / NSF rate, and stable-employment percentage? A property-management company in the area should have these aggregated.
- How much new for-sale + rental construction is in the pipeline within 1–3 miles? Heavy new supply typically softens prices + rents 12–24 months out; constrained supply supports both.
Investment metrics
- 1% rule
- 1.21% ✓
- Cap rate
- 9.51%
- Cash-on-cash
- 11.49%
- DSCR
- 1.51
- GRM
- 6.9
CMA / ARV
No comps found within radius.
Projected returns pro-forma
-3.0% appreciation · 5.38% rent growth · sell at horizon
- IRR
- 3.5%
- Equity multiple
- 1.14×
- Total profit
- $3,482
- Equity at exit
- $13,419
- IRR
- 15.2%
- Equity multiple
- 2.37×
- Total profit
- $34,434
- Equity at exit
- $7,782
Cash invested: $25,200 (down + closing). Projections, not guarantees.
Landlord ↔ Tenant lean methodology
- Overall (STATE)
- 55 Moderately Landlord-Leaning
- State New Mexico
- 55 Moderately Landlord-Leaning · D+3
- County
- — inherits STATE
- City
- — inherits STATE
ZIP-level market 88130
- Rents YoY
- 5.4%
- Active inventory
- 128
- Price-to-rent
- 6.9×
Monthly cashflow live
- Estimated rent
- $1,093 medium interval (Pro) →
- Mortgage (P&I)
- −$472
- Tax est. 1.5%
- −$112 /mo · $1,350/yr
- Insurance
- −$38
- HOA
- −$0
- Vacancy / Maint / Mgmt
- −$229
- Net cashflow
- $241
Break-even live
UW: 25.0% down · 7.5% · 30yr · 1.5% tax · 5.0% vac · 8.0% maint · 8.0% mgmt
Financing live
Cash to close
- Down payment
- $22,500
- Closing costs
- $2,700
- Reserves months
- —
- Total cash needed
- —
Loan-product check · same deal, 3 products live
Conventional
25% down · 7.5% · 30yr
- Down + closing
- —
- Monthly P&I
- —
- Monthly cashflow
- —
- DSCR
- —
- Eligible?
- —
Personal DTI + credit; lowest rate.
DSCR
20% down · 8.5% · 30yr
- Down + closing
- —
- Monthly P&I
- —
- Monthly cashflow
- —
- DSCR
- —
- Eligible?
- —
No personal income docs; deal must DSCR.
Hard money
10% down · 12.0% · 12mo
- Down + closing
- —
- Monthly P&I
- —
- Monthly cashflow
- —
- DSCR
- —
- Eligible?
- —
Short-term bridge; refi at stabilization.
Listing history 19 events
-
2026-06-19days on market $90,000 Active 67 DOM
-
2026-06-18days on market $90,000 Active 66 DOM
-
2026-06-17days on market $90,000 Active 65 DOM
-
2026-06-16days on market $90,000 Active 64 DOM
-
2026-06-15days on market $90,000 Active 63 DOM
-
2026-06-14days on market $90,000 Active 61 DOM
-
2026-06-12days on market $90,000 Active 60 DOM
-
2026-06-09days on market $90,000 Active 57 DOM
-
2026-06-08days on market $90,000 Active 56 DOM
-
2026-06-07days on market $90,000 Active 55 DOM
-
2026-06-05days on market $90,000 Active 52 DOM
-
2026-06-03days on market $90,000 Active 51 DOM
-
2026-06-02days on market $90,000 Active 50 DOM
-
2026-06-01days on market $90,000 Active 49 DOM
-
2026-05-31days on market $90,000 Active 48 DOM
-
2026-05-30days on market $90,000 Active 47 DOM
-
2026-04-13$90,000 Active 463-char remark
Show marketing remark (463 chars)
Attention Cash or Conventional Loan buyers, if you have the time, here is the opportunity. This property has plenty of projects and has the potential to produce some income or could be the perfect setup for you and yours. 3 single wide mobile homes and an additional single family home all on approximately 1.3 acres. The property also has an in ground storm shelter to weather storms when the occassion calls for it. Call a broker today for your private showing.
-
2025-07-17price $110,000
-
2025-05-02$125,000 Active
ⓘ Source: listings_history table (triggers on properties + properties_extension) + one-shot
backfill from property_details.listing_events for pre-trigger history.
Climate risk First Street
- Flood 1/10 Low FEMA zone D · 0% chance over 30 yrs
- Wildfire 3/10 Moderate
- Heat 4/10 Moderate 4 d/yr ≥97°F today · 11 d/yr by 30 yrs out
- Wind 2/10 Low 100% chance of damaging wind over 30 yrs
- Air quality 1/10 Low 0 unhealthy d/yr today · 0 by 30 yrs out
Nearby sold comps map
Loading sold comps map…
Walkable amenities ~0.75 mi
Loading nearby amenities…
Taxation est. · year 1
- Rental income
- $13,113
- − Mortgage interest
- −$5,041
- − Property taxes
- −$1,350
- − Insurance
- −$450
- − Repairs & maintenance
- −$1,049
- − Management
- −$1,049
- − Depreciation
- −$2,618
- Taxable income
- $1,556
- Est. tax owed @ 24.0%
- −$373
- After-tax cash flow
- $2,523/yr
For passive investors: Depreciation is non-cash, so a rental often shows a tax loss while cash-flowing — sheltering income. Rental losses are passive: they offset passive income freely, and up to $25,000/yr can offset ordinary (W-2) income if you actively participate and your MAGI is under $100k (phasing out to $0 by $150k); unused losses carry forward. On sale, claimed depreciation is recaptured at up to 25%, and gains may owe capital-gains tax (a 1031 exchange can defer both). Figures are a year-1 estimate at your 24.0% rate — not tax advice; consult a CPA.
Condition & rehab AI · 12 photos
This property requires moderate renovations, focusing on exterior siding, flooring, and interior painting to improve its condition and value.
Repairs flagged
- Major exterior siding — Corrugated metal siding with visible rust
- Major flooring — Carpeted floors in poor condition
- Minor interior walls/paint — Some scuff marks
Value-add opportunities
- Resale paint exterior — Enhances curb appeal
- Resale repair flooring — Improves living space
- Resale paint interior walls — Enhances interior appearance
Renovation cost estimate screening
| Repair item | Severity | Est. cost |
|---|---|---|
| exterior siding · Corrugated metal siding with visible rust | Major | $15,000–50,000 |
| flooring · Carpeted floors in poor condition | Major | $15,000–50,000 |
| interior walls/paint · Some scuff marks | Minor | $500–3,000 |
| Total estimated repair cost · 3 items | $30,500–103,000 |
Value-add ROI direction
- Resale paint exterior — Enhances curb appeal ↑
- Resale repair flooring — Improves living space ↑
- Resale paint interior walls — Enhances interior appearance ↑
ⓘ Cost ranges are severity-bucket heuristics (US national rule-of-thumb). Get contractor quotes + a written scope before underwriting a rehab budget.
Schools (NCES district)
- District
- Portales Municipal Schools
- NCES district ID
- 3502100
- Math proficiency
- 17% ▼ -5.00%
- Reading proficiency
- 57% ▲ 20.00%
- Median HH income
- $36,151
- Composite
- 30.52/100
- National rank
- #6209
- State rank
- #15 of 29 in NM
Livability — Dora
- Score
- 59/100
- State rank
- #132
- US rank
- #20323
Category grades
Schools grade is shown separately in the Schools card above.
Census & demographics
- County
- Roosevelt County · 17,842 people
- Metro
- Portales, NM
- Population (ZIP)
- 17,842
- Household income
- $52,434
- Rent vs Own
- Severe rent burden
- 574.0
Population outlook (Roosevelt County) Hauer SSP2
- Today (2025)
- 16,821 people
- By 2030
- 15,818 · -6.0%
- By 2040
- 13,766 · -18.2%
- By 2050
- 12,152 · -27.8%
- By 2075
- 9,601 · -42.9%
- By 2100
- 8,241 · -51.0%
Race, ethnicity, and origin ACS 2023
- Neighborhood character
- Diverse neighborhood (Simpson 0.57)
- Race & ethnicity
- White 48% Hispanic / Latino 45% Two or more races 18% Native American 1%
- Hispanic origin (detail)
- Mexican 39% Puerto Rican 1%
- Common ancestry
- Italian 2% Slovak 2% Serbian 1%
- Foreign-born
- 6% · Canada
- Languages at home
- 78% English-only · Spanish 21%
Political lean MEDSL · Roosevelt
- 2024 margin
- Solid R (+43.2) · D 27.4% · R 70.6% · Other 2.0%
- 2008→2024 swing
- -13.3pp toward R · 2008: -29.9pp · 2024: -43.2pp
- All cycles
- 2024: R+43.2 2020: R+42.9 2016: R+41.3 2012: R+38.9 2008: R+29.9
Not yet ingested
- Civics
- —
Market trends
- HPI YoY
- ▼ -154.72%
- Current HPI
- 108.0555
- Rent YoY
- ▲ 5.38%
- Metro
- Portales, NM
- State GDP YoY
- —
- F500 in state
- 0
Price history
-28.0% since first listed3 events — show timeline
- 2026-04-13 Listed $90,000 NMMLS
- 2025-07-17 Price Changed $110,000 NMMLS
- 2025-05-02 Listed $125,000 NMMLS
Cash-flow waterfall
monthlySold comps — $/sqft
last 12 mo · ≤1 miLoading sold comps…