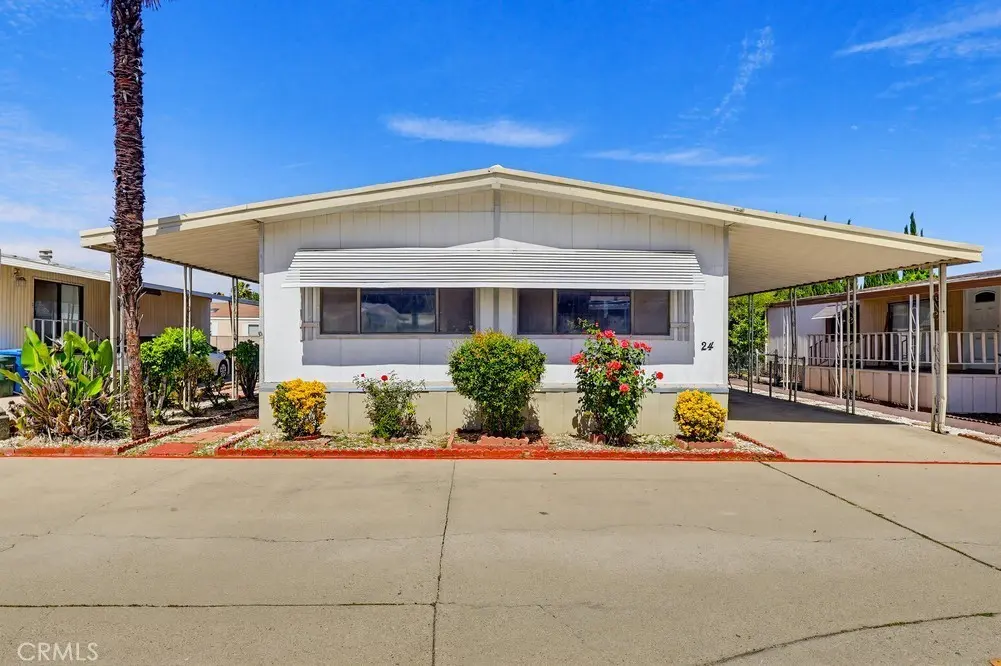
3745 Valley Blvd #24 · Pomona, CA
Flood risk 3/10 · Minor
- FEMA flood zone
- X (unshaded)
- Chance of flooding over 30 yrs
- 0.12%
- Est. flood insurance / yr
- $507 – $1,088
Fire risk 3/10 · Minor
- Est. fire insurance / yr
- $659 – $1,223
Heat risk 7/10 · Major
- Hot days now (above 99°F)
- 7 days/yr
- Hot days in 30 yrs
- 19 days/yr
Wind risk 1/10 · Minimal
- Chance of severe wind over 30 yrs
- —
Air-quality risk 6/10 · Moderate
- Unhealthy air days now
- 10 days/yr
- Unhealthy air days in 30 yrs
- 13 days/yr
Risk factors via First Street. Map © Google.
Why this score? — see what drove the B grade
The composite is a weighted blend of 9 inputs, each scored 0–100. Each bar is that input's sub-score; the figure is the points it added to the 100-point composite (weight × sub-score).
- Cash flow +30.0/30.0
- ARV discount +15.0/15.0
- 1% rule +10.0/10.0
- DSCR +10.0/10.0
- Livability +2.9/5.0
- Rent growth +2.6/5.0
- Condition / age +2.2/5.0
- Schools +2.0/10.0
- Appreciation +0.0/10.0
$138,000
🖨 Deal sheet 📄 Offer letter ✓ Due diligence
Listing remarks
This lovely home located in the beautiful City of Walnut is ready for you to call home. Close to shopping, freeways, Mt San Antonio College and Cal Poly Pomona. Features include, 2 bedrooms, 2 baths, large living room, open concept kitchen and family/dining room. Covered tandem driveway. Large covered front porch and private backyard with spacious storage shed. Common areas include pool, jacuzzi, banquet hall, kitchen, pool tables, library, and so much more.
Key facts
- Community pool
- Built 1976
- Listed 47 days
Property features AI
Finance
- Other: Pets allowed with size, breed and number restrictions
- Financial info: Monthly land lease of $1,500 (park-managed)
- HOA & community: Located in Walnut Hills Mobile Home Park; Suburban community features; Manager approval required for park residency; Park land lease
Exterior
- Parking: Concrete driveway; Covered parking (tandem covered); Attached carport; Guest parking available
- Security: Smoke and carbon monoxide detectors
- Utilities: Natural gas connected; Electricity connected (standard); Public/district water; Public sewer
- Home design: Mobile home (Hunter Manor model); Single-story; Front entry; Mobile home remains on site
- Construction: Property described as needing cosmetic repairs; Mobile width 23 ft and length 56 ft
- Exterior features: Front porch; Back yard; Community pool; In-ground pool; One shed on property; Paved road access; Has view
Interior
- Kitchen: Gas cooktop; Dishwasher; Laminate counters; Gas water heater
- Bedrooms: Bedrooms on one level
- Flooring: Carpet; Laminate flooring
- Bathrooms: One full bathroom; One 3/4 bathroom; Bathtub, shower, and double sinks in master bath
- Heating & cooling: Central furnace heating; Wall/window cooling
- Interior features: Open floor plan; Front entry; One-level home; Blinds; Carbon monoxide and smoke detectors; Community in-ground spa
- Laundry & utility: Laundry inside the home
Neighborhood map
What this means for you Summary
Snapshot
- This is a 2-bed/2.0-bath manufactured listed at $138k. Condition is rated fair.
Deal economics
- At list price, monthly cash flow is $2k ($21k/yr) — positive.
- The deal already cash-flows at list — no discount required.
- Meets the 1% rule at list price ($3k rent vs $138k).
- Recommended offer: $134k (3.0% below list) — sets the bar for market timing.
- Cap rate 21.5% vs local median 2.8% in Pomona — top-decile yield for the area; either an underpriced asset or a hidden risk that comps aren't pricing in. Stress-test before assuming the spread holds.
Location & tenants
- Location reads 58/100 on livability (#676 in CA) — a working-class tenant base; expect higher turnover. Strengths: commute A+; Watch: schools D, crime F, amenities F.
- Pomona Unified (suburban): math 12% / reading 31% proficiency, ranked #444 of 517 in CA (top 86%) — low school quality limits family demand, transient renter base, plan for 1-2y turnover; 73% free/reduced lunch — lower-income household profile, screen leases tightly.
- Market conditions: Rents flat; 137 active listings in the ZIP; 7 comparable units currently listed for rent nearby; rentals leasing fast (median 13d on market — plan ~1-2 weeks tenant-placement turnaround); high-income renter base; 19,697 units permitted in Los Angeles County in 2024 (9,426 in 5+ unit buildings).
- This rent runs 31% of the median local income ($126k/yr) — at the standard rent-burdened threshold; future hikes will face affordability resistance.
Forward outlook
- Local home prices are declining (-3.0%/yr); year-one equity from $954 of loan paydown is wiped out by about $4k of value loss. Plan a longer hold.
- Los Angeles County population projected at +9% by 2050 — modest demand growth; plan on rents tracking national, not racing it.
- At projected returns (-3.0% appreciation + 0.3% rent growth), your $39k cash investment doubles in ~3 years — after that, you're playing with house money.
Negotiation context
- It's been on market 47 days — a 3% lower offer ($134k) is reasonable based on typical stale-listing flexibility.
Risks & watch-outs
- Climate carrying-cost: extreme-heat days projected 7→19/yr by 2055 (HVAC capex compounding) — expect insurance premiums to compound above CPI over the hold.
Questions for the listing agent
- It's been on market 47 days. Have you received any prior offers? Is the seller open to a 3% concession, seller financing, or rate buy-down credit?
- Have any recent inspections been done? Can we get a copy of the seller's disclosures and any deferred-maintenance estimates?
- Built in 1976 — when were the roof, HVAC, electrical panel, plumbing, and water heater last replaced?
- Is there a deadline driving the sale (1031 exchange, divorce, estate, relocation)? That informs how much negotiation room exists.
- Schools are D-rated, which usually means shorter tenancies and higher turnover. Who's the typical renter profile here, and what's been the actual vacancy rate?
- Crime grade is F in this area — have there been break-ins, vandalism, or insurance claims at this property in the last 3 years? What carrier currently insures it and at what premium?
- What's the average days-on-market for RENTAL listings here right now (not sales)? A rising rental-DOM trend means longer vacancies and softer asking-rent achievability than the comps imply.
- What's the recent tenant-quality profile in this submarket — average credit score on applications, eviction rate, late-payment / NSF rate, and stable-employment percentage? A property-management company in the area should have these aggregated.
- How much new for-sale + rental construction is in the pipeline within 1–3 miles? Heavy new supply typically softens prices + rents 12–24 months out; constrained supply supports both.
Investment metrics
- 1% rule
- 2.36% ✓
- Cap rate
- 21.53%
- Cash-on-cash
- 54.43%
- DSCR
- 3.42
- GRM
- 3.5
CMA / ARV
- ARV (median comp)
- $180,809
- List price
- $138,000
- Delta
- -23.68%
- Verdict
- UNDERPRICED
- Comps
- 10 within 1.0 mi
Show comp detail 9 sales within ~0.75 mi
| Address | Dist | Beds/Ba | Sqft | Sold | Price | $/sf | Match |
|---|---|---|---|---|---|---|---|
| 3745 Valley Blvd | 0.00mi | 3/2.0 (+1) | 1,440 (0%) | 1mo | $253,000 | $176 | 94 |
| 3745 Valley Blvd #160 | 0.00mi | 3/2.0 (+1) | 1,440 (0%) | 6mo | $255,000 | $177 | 90 |
| 3745 Valley Blvd #117 | 0.00mi | 3/2.0 (+1) | 1,440 (0%) | 19mo | $198,000 | $138 | 80 |
| 3667 Valley Blvd #54 | 0.15mi | 2/2.0 | 1,344 (-7%) | 8mo | $175,000 | $130 | 75 |
| 3667 Valley Blvd | 0.13mi | 3/2.0 (+1) | 1,458 (+1%) | 16mo | $279,000 | $191 | 74 |
| 3745 Valley | 0.01mi | 2/2.0 | 1,585 (+10%) | 18mo | $210,000 | $132 | 68 |
| 3667 VALLEY Blvd #64 | 0.15mi | 3/2.0 (+1) | 1,248 (-13%) | 2mo | $205,000 | $164 | 64 |
| 3825 VALLEY Blvd #14 | 0.13mi | 3/2.0 (+1) | 1,259 (-13%) | 9mo | $169,000 | $134 | 60 |
| 3667 Valley Blvd #215 | 0.15mi | 3/2.0 (+1) | 1,638 (+14%) | 10mo | $299,880 | $183 | 56 |
Match score weights: distance 35% · size 25% · config 20% · recency 20%. Top-matched comps best support the ARV.
Projected returns pro-forma
-3.0% appreciation · 0.35% rent growth · sell at horizon
- IRR
- 49.7%
- Equity multiple
- 3.09×
- Total profit
- $80,764
- Equity at exit
- $20,576
- IRR
- 54.2%
- Equity multiple
- 5.68×
- Total profit
- $180,984
- Equity at exit
- $11,932
Cash invested: $38,640 (down + closing). Projections, not guarantees.
Landlord ↔ Tenant lean methodology
- Overall (STATE)
- 18 Strongly Tenant-Friendly
- State California
- 18 Strongly Tenant-Friendly · D+13
- County
- — inherits STATE
- City
- — inherits STATE
ZIP-level market 91789
- Rents YoY
- 0.3%
- Active inventory
- 137
- Price-to-rent
- 3.5×
Monthly cashflow live
- Estimated rent
- $3,260 high interval (Pro) →
- Mortgage (P&I)
- −$724
- Tax from tax record
- −$41 /mo · $495/yr
- Insurance
- −$58
- HOA
- −$0
- Vacancy / Maint / Mgmt
- −$685
- Net cashflow
- $1,753
Break-even live
UW: 25.0% down · 7.5% · 30yr · 1.5% tax · 5.0% vac · 8.0% maint · 8.0% mgmt
Financing live
Cash to close
- Down payment
- $34,500
- Closing costs
- $4,140
- Reserves months
- —
- Total cash needed
- —
Loan-product check · same deal, 3 products live
Conventional
25% down · 7.5% · 30yr
- Down + closing
- —
- Monthly P&I
- —
- Monthly cashflow
- —
- DSCR
- —
- Eligible?
- —
Personal DTI + credit; lowest rate.
DSCR
20% down · 8.5% · 30yr
- Down + closing
- —
- Monthly P&I
- —
- Monthly cashflow
- —
- DSCR
- —
- Eligible?
- —
No personal income docs; deal must DSCR.
Hard money
10% down · 12.0% · 12mo
- Down + closing
- —
- Monthly P&I
- —
- Monthly cashflow
- —
- DSCR
- —
- Eligible?
- —
Short-term bridge; refi at stabilization.
Rent comps 7 comps
| Address | Beds | Baths | Sqft | Rent | $/sqft | DOM | Units | Dist |
|---|---|---|---|---|---|---|---|---|
| 3507 Legato Ct Pomona, CA | 2.0 | 2.0 | 920 | $2,400 | $2.61 | 44d | 1 | 1.12mi |
| 3435 Legato Ct Pomona, CA | 2.0 | 2.0 | 930 | $2,445 | $2.63 | 13d | 1 | 1.15mi |
| 400 Appian Way Pomona, CA | 2.0 | 1.0–2.0 | 624 | $3,145 | $5.04 | 4d | 1 | 1.22mi |
| 356 Carrione Ct Pomona, CA | 2.0 | 2.5 | 1392 | $3,500 | $2.51 | 44d | 1 | 1.28mi |
| 227 Red Cloud Dr Diamond Bar, CA | 3.0 | 2.0 | 1449 | $3,550 | $2.45 | 10d | 1 | 1.37mi |
| 227 Red Cloud Dr Diamond Bar, CA | 3.0 | 1.5 | 1449 | $3,550 | $2.45 | 7d | 1 | 1.37mi |
| 24151 High Knob Rd Diamond Bar, CA | 2.0 | 1.0 | 1174 | $2,300 | $1.96 | 13d | 1 | 1.48mi |
Listing history 16 events
-
2026-06-18days on market $138,000 Active 47 DOM
-
2026-06-17days on market $138,000 Active 46 DOM
-
2026-06-16days on market $138,000 Active 45 DOM
-
2026-06-15days on market $138,000 Active 44 DOM
-
2026-06-13days on market $138,000 Active 42 DOM
-
2026-06-13days on market $138,000 Active 41 DOM
-
2026-06-09days on market $138,000 Active 38 DOM
-
2026-06-08days on market $138,000 Active 37 DOM
-
2026-06-07days on market $138,000 Active 36 DOM
-
2026-06-04days on market $138,000 Active 33 DOM
-
2026-06-03days on market $138,000 Active 32 DOM
-
2026-06-02days on market $138,000 Active 31 DOM
-
2026-06-01days on market $138,000 Active 30 DOM
-
2026-05-31days on market $138,000 Active 29 DOM
-
2026-05-02$138,000 Active 462-char remark
-
2026-04-30historical $138,000 462-char remark
ⓘ Source: listings_history table (triggers on properties + properties_extension) + one-shot
backfill from property_details.listing_events for pre-trigger history.
Tax reassessment forecast CA · Resets to sale price
- Current annual tax
- $495 · $41/mo
- Projected year-2 tax
- $1,049 · $87/mo
- Expected delta
- +$554/yr (+$46/mo · 111.8%)
ⓘ Screening estimate from a state-policy table — verify with the county assessor before closing.
Climate risk First Street
- Flood 3/10 Moderate FEMA zone X (unshaded) · 12% chance over 30 yrs
- Wildfire 3/10 Moderate
- Heat 7/10 Severe 7 d/yr ≥99°F today · 19 d/yr by 30 yrs out
- Wind 1/10 Low
- Air quality 6/10 Major 10 unhealthy d/yr today · 13 by 30 yrs out
Nearby sold comps map
Loading sold comps map…
Walkable amenities ~0.75 mi
Loading nearby amenities…
Taxation est. · year 1
- Rental income
- $39,115
- − Mortgage interest
- −$7,730
- − Property taxes
- −$495
- − Insurance
- −$690
- − Repairs & maintenance
- −$3,129
- − Management
- −$3,129
- − Depreciation
- −$4,015
- Taxable income
- $19,927
- Est. tax owed @ 24.0%
- −$4,782
- After-tax cash flow
- $16,249/yr
For passive investors: Depreciation is non-cash, so a rental often shows a tax loss while cash-flowing — sheltering income. Rental losses are passive: they offset passive income freely, and up to $25,000/yr can offset ordinary (W-2) income if you actively participate and your MAGI is under $100k (phasing out to $0 by $150k); unused losses carry forward. On sale, claimed depreciation is recaptured at up to 25%, and gains may owe capital-gains tax (a 1031 exchange can defer both). Figures are a year-1 estimate at your 24.0% rate — not tax advice; consult a CPA.
Condition & rehab AI · 12 photos
This mobile home is in fair condition with cosmetic updates needed to enhance its resale and rental value.
Repairs flagged
- Minor kitchen cabinets — slight wear
- Minor bathroom fixtures — outdated design
- Moderate exterior siding — moderate wear
Value-add opportunities
- Resale paint interior walls — enhances curb appeal
- Rental replace carpeting — improves comfort and cleanliness
- Resale update kitchen cabinets — modernizes space
- Resale update bathroom fixtures — modernizes space
- Resale repair exterior siding — enhances curb appeal
Renovation cost estimate screening
| Repair item | Severity | Est. cost |
|---|---|---|
| kitchen cabinets · slight wear | Minor | $500–3,000 |
| bathroom fixtures · outdated design | Minor | $500–3,000 |
| exterior siding · moderate wear | Moderate | $3,000–15,000 |
| Total estimated repair cost · 3 items | $4,000–21,000 |
Value-add ROI direction
- Resale paint interior walls — enhances curb appeal ↑
- Rental replace carpeting — improves comfort and cleanliness ↑
- Resale update kitchen cabinets — modernizes space ↑
- Resale update bathroom fixtures — modernizes space ↑
- Resale repair exterior siding — enhances curb appeal ↑
ⓘ Cost ranges are severity-bucket heuristics (US national rule-of-thumb). Get contractor quotes + a written scope before underwriting a rehab budget.
Schools (NCES district)
- District
- Pomona Unified
- NCES district ID
- 0631320
- Math proficiency
- 12% ▼ -15.00%
- Reading proficiency
- 31% ▼ -10.00%
- Median HH income
- $54,839
- Composite
- 19.54/100
- National rank
- #8761
- State rank
- #444 of 517 in CA
Livability — Pomona
- Score
- 58/100
- State rank
- #676
- US rank
- #20782
Category grades
Schools grade is shown separately in the Schools card above.
Census & demographics
- Census place
- Pomona, CA
- County
- Los Angeles County · 9,444,647 people
- City population
- 152,679
- Metro
- Los Angeles-Long Beach-Anaheim, CA
- Population (ZIP)
- 40,298
- Household income
- $125,720
- Rent vs Own
- Severe rent burden
- 603.0
Population outlook (Los Angeles County) Hauer SSP2
- Today (2025)
- 10,940,515 people
- By 2030
- 11,256,481 · +2.9%
- By 2040
- 11,729,929 · +7.2%
- By 2050
- 11,948,407 · +9.2%
- By 2075
- 11,818,114 · +8.0%
- By 2100
- 10,842,928 · -0.9%
Race, ethnicity, and origin ACS 2023
- Neighborhood character
- Predominantly Asian (67%)
- Race & ethnicity
- Asian 67% Hispanic / Latino 18% White 9% Two or more races 7% Black 2%
- Hispanic origin (detail)
- Mexican 15%
- Foreign-born
- 51% · China, South Korea, Canada
- Languages at home
- 33% English-only · Chinese 38% Spanish 9% Tagalog/Filipino 6%
Political lean MEDSL · Los Angeles
- 2024 margin
- Solid D (+32.9) · D 64.8% · R 31.9% · Other 3.3%
- 2008→2024 swing
- -7.4pp toward R · 2008: 40.4pp · 2024: 32.9pp
- All cycles
- 2024: D+32.9 2020: D+44.2 2016: D+48.0 2012: D+40.0 2008: D+40.4
Not yet ingested
- Civics
- —
Market trends
- HPI YoY
- ▼ -884.62%
- Current HPI
- 368.0775
- Rent YoY
- ▲ 0.35%
- Metro
- Los Angeles-Long Beach-Anaheim, CA
- State GDP YoY
- ▲ 3.21%
- F500 in state
- 116
Industry mix (Fortune 500 HQ in CA)
| Industry | F500 HQs | Revenue |
|---|---|---|
| Technology | 27 | $1,492B |
|
||
| Financial Services | 3 | $174B |
|
||
| Retail | 3 | $44B |
|
||
| Insurance | 3 | $26B |
|
||
| Media / Entertainment | 2 | $115B |
|
||
| Pharmaceuticals / Biotech | 2 | $62B |
|
||
Price history
+0.0% since first listed2 events — show timeline
- 2026-05-02 Listed $138,000 CRMLS
- 2026-04-30 Coming Soon $138,000 CRMLS
Property tax history
+10.0%/yrLatest (2025): $495 · +10.0% YoY. Source: county tax records.
Cash-flow waterfall
monthlySold comps — $/sqft
last 12 mo · ≤1 miLoading sold comps…