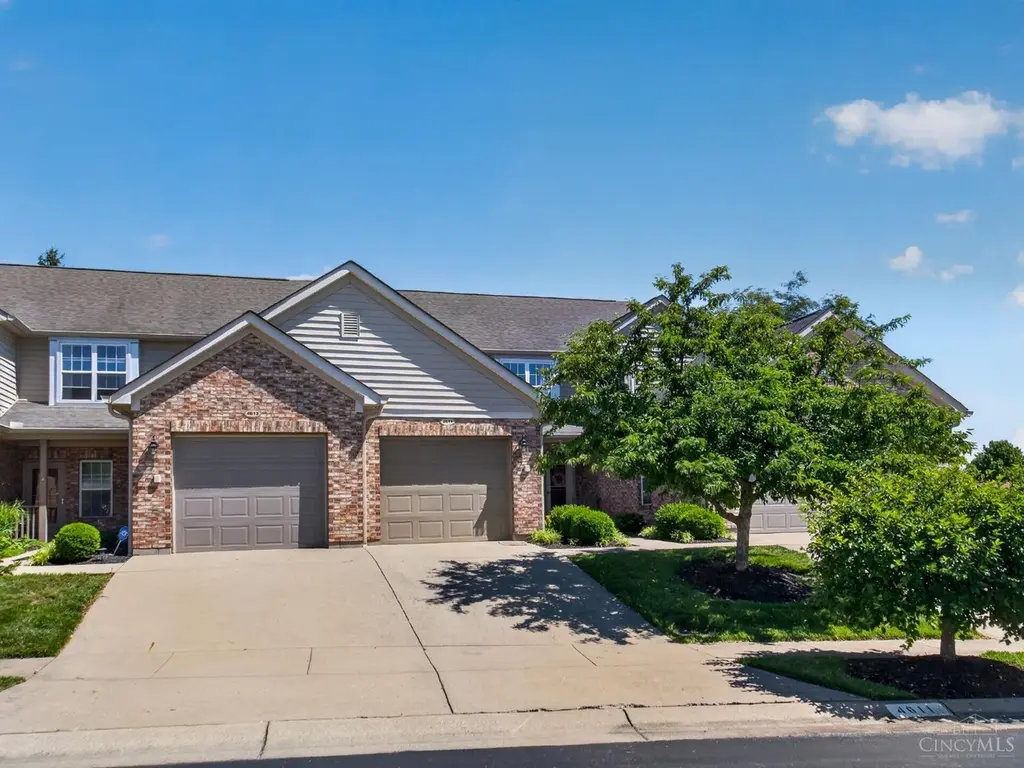
4611 Court Yard Dr · Mason, OH
Flood risk 1/10 · Minimal
- FEMA flood zone
- X (unshaded)
- Chance of flooding over 30 yrs
- 0.0%
- Est. flood insurance / yr
- $507 – $1,088
Fire risk 1/10 · Minimal
- Est. fire insurance / yr
- $713 – $1,323
Heat risk 4/10 · Minor
- Hot days now (above 103°F)
- 7 days/yr
- Hot days in 30 yrs
- 19 days/yr
Wind risk 2/10 · Minimal
- Chance of severe wind over 30 yrs
- 1.0%
Air-quality risk 4/10 · Minor
- Unhealthy air days now
- 5 days/yr
- Unhealthy air days in 30 yrs
- 6 days/yr
Risk factors via First Street. Map © Google.
Why this score? — see what drove the D grade
The composite is a weighted blend of 9 inputs, each scored 0–100. Each bar is that input's sub-score; the figure is the points it added to the 100-point composite (weight × sub-score).
- Cash flow +9.0/30.0
- ARV discount +7.5/15.0
- Schools +7.2/10.0
- Livability +4.2/5.0
- 1% rule +3.9/10.0
- Rent growth +3.4/5.0
- DSCR +2.5/10.0
- Condition / age +2.5/5.0
- Appreciation +0.0/10.0
$229,000
🖨 Deal sheet (PDF) 📄 Offer letter ✓ Due diligence
Listing remarks MLS
Second floor 2 BR 2 BA condo with attached garage, whole house water filter, includes washer & dryer with home warranty.
Key facts
- Walk-in closet
- Private balcony
- Large kitchen
Tags
Property features AI
Finance
- HOA & community: HOA present with a $280 monthly fee; Association fee covers trash, water, and community landscaping
Exterior
- Parking: Built-in front garage with 2 garage spaces; Driveway parking; On-street parking
- Utilities: Public water; Public sewer; Natural gas
- Home design: Traditional single-family home; Two levels; Poured foundation
- Construction: Brick construction; Shingle roof
- Exterior features: Balcony; Double-hung vinyl windows
Interior
- Kitchen: Pantry; Quartz counters; Counter bar; Window treatments; Laminate flooring; Dishwasher; Garbage disposal; Microwave; Oven/Range; Refrigerator
- Bedrooms: Two bedrooms total; Primary bedroom (Level 2) with walkout
- Flooring: Laminate floors in living, dining, entry, and kitchen areas
- Bathrooms: Two full bathrooms; Primary bathroom includes bidet and shower
- Heating & cooling: Gas heating; Central air conditioning; Gas water heating
- Interior features: 9-foot ceilings and cathedral ceiling; Ceiling fan; Seven total rooms
Neighborhood map
What this means for you Summary
Snapshot
- This is a 2-bed/2.0-bath condo listed at $229k.
Deal economics
- At list price, monthly cash flow is $-181 ($-2k/yr) — negative.
- To cash-flow at today's rent, offer at most $197k (14.0% below list).
- To meet the 1% rule (rent ≥ 1% of price), the offer needs to be $204k (11.0% below list).
- Recommended offer: $197k (14.0% below list) — sets the bar for cash-flow.
- Cap rate 5.3% vs local median 3.2% in Mason — top-decile yield for the area; either an underpriced asset or a hidden risk that comps aren't pricing in. Stress-test before assuming the spread holds.
Location & tenants
- Location reads 85/100 on livability (#43 in OH, #590 nationally) — a professional / high-income tenant draw. Strengths: crime A+, employment A+, housing A+; Watch: health & safety C-, commute F.
- Mason City (suburban): math 81% / reading 81% proficiency, ranked #33 of 656 in OH (top 5%) — strong family-tenant draw, lease renewals of 3-5y typical; only 6% free/reduced lunch — higher-income household profile.
- Zoned schools: Mason Early Childhood Center Elementary School (2,085 students, 10% FRL); Mason Middle School (math 77% / reading 80%, grade A+, #58 of 654 statewide, top 9%, 1,662 students, 8% FRL); William Mason High School (math 74% / reading 86%, grade A, #31 of 781 statewide, top 4%, 3,414 students, 8% FRL) — zoned schools at 8% FRL track the district average.
- Market conditions: Rents rising (+3.5%/yr); 136 active listings in the ZIP; 4 comparable units currently listed for rent nearby; rentals leasing fast (median 13d on market — plan ~1-2 weeks tenant-placement turnaround); high-income renter base; 1,224 units permitted in Warren County in 2024 (474 in 5+ unit buildings).
Forward outlook
- Local home prices are declining (-3.0%/yr); year-one equity from $2k of loan paydown is wiped out by about $7k of value loss. Plan a longer hold.
- Warren County population projected at +16% by 2050 — long-run rental-demand tailwind backs the buy-and-hold thesis.
Negotiation context
- It's been on market 17 days — a 2% lower offer ($226k) is reasonable based on typical stale-listing flexibility.
- 6 sale attempts since 27y ago with the ask held roughly flat each time — persistent listings suggest the price (not the market) is what's stuck; bring a comps-based counter.
- Current owner paid $138k; list at $229k implies a 67% gain — meaningful room to come down on a strong offer.
Questions for the listing agent
- What do current leases actually rent for vs. the listed asking? Can we see a recent rent roll and the last 12 months of T-12 income?
- What does the HOA fee cover, when was the last increase, and are there any pending special assessments or reserve-fund shortfalls?
- Any open or pending special assessments — roof, HVAC, plumbing, elevator, façade? What's the per-unit balance and payoff schedule, and is the seller paying it off at close or rolling it to the buyer?
- Is there a deadline driving the sale (1031 exchange, divorce, estate, relocation)? That informs how much negotiation room exists.
- Schools are A-rated — typically a magnet for longer-tenancy family renters. What's the average tenant stay here, and is there a school-zone premium baked into asking?
- The area grade is low — what's the realistic commute time and amenity access for the typical tenant pool here? Any planned neighborhood developments (good or bad) we should know about?
- What's the average days-on-market for RENTAL listings here right now (not sales)? A rising rental-DOM trend means longer vacancies and softer asking-rent achievability than the comps imply.
- What's the recent tenant-quality profile in this submarket — average credit score on applications, eviction rate, late-payment / NSF rate, and stable-employment percentage? A property-management company in the area should have these aggregated.
- How much new apartment / multifamily construction is in the pipeline within 1–3 miles? Heavy new supply (>2% of stock underway) typically softens rents 12–24 months out; light construction supports rent growth.
Investment metrics
- 1% rule
- 0.89% ✗
- Cap rate
- 5.34%
- Cash-on-cash
- -3.39%
- DSCR
- 0.85
- GRM
- 9.4
CMA / ARV
No comps found within radius.
Projected returns pro-forma
-3.0% appreciation · 3.51% rent growth · sell at horizon
- IRR
- -21.2%
- Equity multiple
- 0.26×
- Total profit
- $-47,425
- Equity at exit
- $34,145
- IRR
- -13.3%
- Equity multiple
- 0.20×
- Total profit
- $-51,137
- Equity at exit
- $19,800
Cash invested: $64,120 (down + closing). Projections, not guarantees.
Landlord ↔ Tenant lean methodology
- Overall (STATE)
- 73 Landlord-Friendly
- State Ohio
- 73 Landlord-Friendly · R+6
- County
- — inherits STATE
- City
- — inherits STATE
ZIP-level market 45040
- Rents YoY
- 3.5%
- Active inventory
- 136
- Price-to-rent
- 9.4×
Monthly cashflow live
- Estimated rent
- $2,038 medium interval (Pro) →
- Mortgage (P&I)
- −$1,201
- Tax from tax record
- −$215 /mo · $2,576/yr
- Insurance
- −$95
- HOA
- −$280
- Vacancy / Maint / Mgmt
- −$428
- Net cashflow
- $-181
Break-even live
Sensitivity live
| Price | -10% $-51 | -5% $-116 | +0% $-181 | +5% $-246 | +10% $-311 |
|---|---|---|---|---|---|
| Rent | -10% $-342 | -5% $-261 | +0% $-181 | +5% $-100 | +10% $-20 |
| Rate | -1.0pp $-66 | -0.5pp $-123 | base $-181 | +0.5pp $-240 | +1.0pp $-301 |
UW: 25.0% down · 7.5% · 30yr · 1.5% tax · 5.0% vac · 8.0% maint · 8.0% mgmt
Financing live
Cash to close
- Down payment
- $57,250
- Closing costs
- $6,870
- Reserves months
- —
- Total cash needed
- —
Loan-product check · same deal, 3 products live
Conventional
25% down · 7.5% · 30yr
- Down + closing
- —
- Monthly P&I
- —
- Monthly cashflow
- —
- DSCR
- —
- Eligible?
- —
Personal DTI + credit; lowest rate.
DSCR
20% down · 8.5% · 30yr
- Down + closing
- —
- Monthly P&I
- —
- Monthly cashflow
- —
- DSCR
- —
- Eligible?
- —
No personal income docs; deal must DSCR.
Hard money
10% down · 12.0% · 12mo
- Down + closing
- —
- Monthly P&I
- —
- Monthly cashflow
- —
- DSCR
- —
- Eligible?
- —
Short-term bridge; refi at stabilization.
Rent comps 4 comps
| Address | Beds | Baths | Sqft | Rent | $/sqft | DOM | Units | Dist |
|---|---|---|---|---|---|---|---|---|
| 4676 Court Yard Dr Mason, OH | 2.0 | 2.0 | 1232 | $2,050 | $1.66 | 45d | 1 | 0.08mi |
| 4150 Spanish Bay Dr Mason, OH | 2.0 | 1.5 | 1208 | $1,825 | $1.51 | 12d | 1 | 1.00mi |
| 4114 Spanish Bay Dr Mason, OH | 2.0 | 1.5 | 1144 | $2,995 | $2.62 | 0d | 1 | 1.03mi |
| 4068 Spanish Bay Dr Mason, OH | 2.0 | 1.5 | 1144 | $1,700 | $1.49 | 12d | 1 | 1.05mi |
HOA detail condo
- Monthly dues
- $280 · $3,360/yr
- Likely covers
- water
- Assessments
- None detected in remarks — confirm with the listing agent.
Listing history 10 events
-
2026-06-21days on market $229,000 Active 17 DOM
-
2026-06-18days on market $229,000 Active 14 DOM
-
2026-06-17days on market $229,000 Active 13 DOM
-
2026-06-16days on market $229,000 Active 12 DOM
-
2026-06-15days on market $229,000 Active 11 DOM
-
2026-06-13pricedays on market $229,000 Active 9 DOM
-
2026-06-09days on market $235,000 Active 5 DOM
-
2026-06-08days on market $235,000 Active 4 DOM
-
2026-06-07remarks 493-char remark
-
2026-06-07$235,000 Active 3 DOM
ⓘ Source: listings_history table (triggers on properties + properties_extension) + one-shot
backfill from property_details.listing_events for pre-trigger history.
Tax reassessment forecast OH · Partial reset (capped growth)
- Current annual tax
- $2,576 · $215/mo
- Projected year-2 tax
- $3,074 · $256/mo
- Expected delta
- +$498/yr (+$42/mo · 19.3%)
ⓘ Screening estimate from a state-policy table — verify with the county assessor before closing.
Climate risk First Street
- Flood 1/10 Low FEMA zone X (unshaded) · 0% chance over 30 yrs
- Wildfire 1/10 Low
- Heat 4/10 Moderate 7 d/yr ≥103°F today · 19 d/yr by 30 yrs out
- Wind 2/10 Low 100% chance of damaging wind over 30 yrs
- Air quality 4/10 Moderate 5 unhealthy d/yr today · 6 by 30 yrs out
Nearby sold comps map
Loading sold comps map…
Walkable amenities ~0.75 mi
Loading nearby amenities…
Taxation est. · year 1
- Rental income
- $24,456
- − Mortgage interest
- −$12,828
- − Property taxes
- −$2,576
- − Insurance
- −$1,145
- − Repairs & maintenance
- −$1,956
- − Management
- −$1,956
- − HOA
- −$3,360
- − Depreciation
- −$6,662
- Taxable loss
- −$6,028
- Est. tax savings @ 24.0%
- +$1,447
- After-tax cash flow
- $-725/yr
For passive investors: Depreciation is non-cash, so a rental often shows a tax loss while cash-flowing — sheltering income. Rental losses are passive: they offset passive income freely, and up to $25,000/yr can offset ordinary (W-2) income if you actively participate and your MAGI is under $100k (phasing out to $0 by $150k); unused losses carry forward. On sale, claimed depreciation is recaptured at up to 25%, and gains may owe capital-gains tax (a 1031 exchange can defer both). Figures are a year-1 estimate at your 24.0% rate — not tax advice; consult a CPA.
Schools (NCES district)
- District
- Mason City
- NCES district ID
- 3905045
- Math proficiency
- 81% ▼ -8.00%
- Reading proficiency
- 81% ▼ -5.00%
- Median HH income
- $91,430
- Composite
- 72.46/100
- National rank
- #200
- State rank
- #33 of 656 in OH
Livability — Mason
- Score
- 85/100
- State rank
- #43
- US rank
- #590
Category grades
Schools grade is shown separately in the Schools card above.
Census & demographics
- Census place
- Mason, OH
- County
- Warren County · 196,906 people
- City population
- 59,518
- Metro
- Cincinnati, OH-KY-IN
- Population (ZIP)
- 59,518
- Household income
- $133,240
- Rent vs Own
- Severe rent burden
- 562.0
Population outlook (Warren County) Hauer SSP2
- Today (2025)
- 248,603 people
- By 2030
- 259,345 · +4.3%
- By 2040
- 277,666 · +11.7%
- By 2050
- 289,599 · +16.5%
- By 2075
- 311,681 · +25.4%
- By 2100
- 302,738 · +21.8%
Race, ethnicity, and origin ACS 2023
- Neighborhood character
- Predominantly White (70%)
- Race & ethnicity
- White 70% Asian 19% Two or more races 6% Black 4% Hispanic / Latino 3%
- Common ancestry
- Romanian 2% Slovak 2% Lithuanian 1%
- Foreign-born
- 20% · China, Canada, Vietnam
- Languages at home
- 77% English-only · Other Asian/Pacific 6% Other Indo-European 6% Chinese 4%
Political lean MEDSL · Warren
- 2024 margin
- Solid R (+31.5) · D 33.8% · R 65.3%
- 2008→2024 swing
- +4.5pp toward D · 2008: -36.1pp · 2024: -31.5pp
- All cycles
- 2024: R+31.5 2020: R+30.8 2016: R+37.6 2012: R+39.5 2008: R+36.1
Not yet ingested
- Civics
- —
Market trends
- HPI YoY
- ▼ -210.08%
- Current HPI
- 234.0754
- Rent YoY
- ▲ 3.51%
- Metro
- Cincinnati, OH-KY-IN
- State GDP YoY
- ▲ 1.98%
- F500 in state
- 48
Industry mix (Fortune 500 HQ in OH)
| Industry | F500 HQs | Revenue |
|---|---|---|
| Insurance | 3 | $145B |
|
||
| Industrial Machinery | 3 | $49B |
|
||
| Financial Services | 3 | $24B |
|
||
| Consumer Goods | 2 | $93B |
|
||
| Aerospace / Defense | 2 | $47B |
|
||
| Utilities | 2 | $33B |
|
||
Price history
+136.2% since first listed14 events — show timeline
- 2026-06-04 Listed $235,000 Cincy MLS
- 2020-02-25 Sold (MLS) $137,500 Cincy MLS
- 2020-02-06 Contingent — Cincy MLS
- 2020-02-05 Listed $130,000 Cincy MLS
- 2005-10-24 Sold (Public Records) $116,900 Public Records
- 2005-10-20 Sold (MLS) $116,900 Cincy MLS
- 2005-09-08 Listed $114,950 Cincy MLS
- 2002-06-24 Listing Removed — Cincy MLS
- 2001-03-15 Sold (Public Records) $99,500 Public Records
- 2001-02-26 Sold (MLS) $99,500 Cincy MLS
- 2001-01-21 Listed $101,500 Cincy MLS
- 2000-03-24 Sold (MLS) $96,900 Cincy MLS
- 2000-03-19 Listed $99,900 Cincy MLS
- 1999-09-13 Listed $99,500 Cincy MLS
Property tax history
+3.4%/yrLatest (2025): $2,576 · -0.5% YoY. Source: county tax records.
Cash-flow waterfall
monthlySold comps — $/sqft
last 12 mo · ≤1 miLoading sold comps…