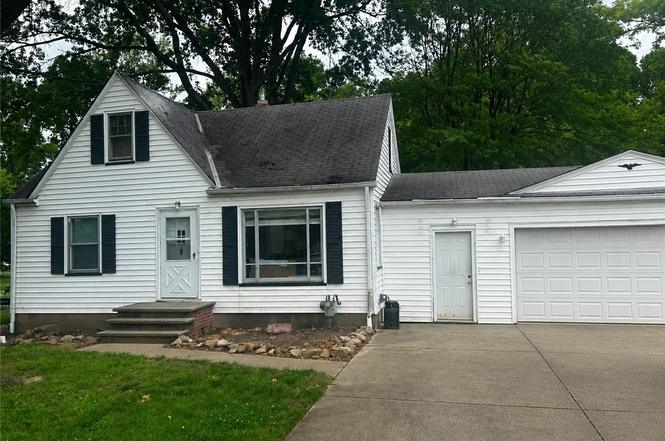
5220 Royalwood Rd · North Royalton, OH
Flood risk 1/10 · Minimal
- FEMA flood zone
- X (unshaded)
- Chance of flooding over 30 yrs
- 0.0%
- Est. flood insurance / yr
- $473 – $860
Fire risk 1/10 · Minimal
- Est. fire insurance / yr
- $713 – $1,323
Heat risk 2/10 · Minimal
- Hot days now (above 94°F)
- 7 days/yr
- Hot days in 30 yrs
- 17 days/yr
Wind risk 1/10 · Minimal
- Chance of severe wind over 30 yrs
- —
Air-quality risk 2/10 · Minimal
- Unhealthy air days now
- 1 days/yr
- Unhealthy air days in 30 yrs
- 3 days/yr
Risk factors via First Street. Map © Google.
Why this score? — see what drove the C grade
The composite is a weighted blend of 9 inputs, each scored 0–100. Each bar is that input's sub-score; the figure is the points it added to the 100-point composite (weight × sub-score).
- Cash flow +18.4/30.0
- ARV discount +15.0/15.0
- Schools +6.7/10.0
- DSCR +5.8/10.0
- 1% rule +5.0/10.0
- Livability +3.9/5.0
- Rent growth +2.5/5.0
- Condition / age +2.5/5.0
- Appreciation +0.0/10.0
$165,000
🖨 Deal sheet 📄 Offer letter ✓ Due diligence
Listing remarks
Welcome to 5220 Royalwood Road, where space, privacy, and opportunity come together in the heart of North Royalton. Situated on nearly an acre of land, this charming Cape Cod offers a setting that's becoming increasingly difficult to find. Set back on a deep lot with mature surroundings, the property offers ample space to spread out, entertain, garden, or simply enjoy the outdoors. Inside, you'll find three bedrooms, comfortable living spaces, and the timeless character that makes a house feel like home. The layout offers flexibility for a variety of lifestyles, whether you're looking for your first home, a place to grow, or a property you can personalize over time. A full basement provides
Key facts
- Deep lot
- Full basement
- 0.89 acre lot
Tags
Property features AI
Exterior
- Parking: Attached concrete garage; Two garage spaces
- Utilities: Private water source; Public sewer
- Home design: Single-family property; Asphalt shingle roof; Vinyl siding
- Construction: Built (year per public records); Vinyl siding construction; Asphalt shingle roof; Full foundation
- Exterior features: Lot just under 0.9 acres
Interior
- Kitchen: Refrigerator included
- Bedrooms: Two main-level bedrooms
- Bathrooms: One full bathroom (main level)
- Heating & cooling: Forced air gas heating; Wall unit cooling
- Interior features: Full unfinished basement
Neighborhood map
What this means for you Summary
Snapshot
- This is a 3-bed/1.0-bath single-family listed at $165k.
Deal economics
- At list price, monthly cash flow is $155 ($2k/yr) — positive.
- The deal already cash-flows at list — no discount required.
- Meets the 1% rule at list price ($2k rent vs $165k).
- Cap rate 7.4% vs local median 2.5% in North Royalton — top-decile yield for the area; either an underpriced asset or a hidden risk that comps aren't pricing in. Stress-test before assuming the spread holds.
Location & tenants
- Location reads 77/100 on livability (#199 in OH, #3,064 nationally) — a middle-class / working-renter tenant base. Strengths: schools A+, crime A+, cost of living A+; Watch: amenities F, commute F.
- North Royalton City (suburban): math 74% / reading 81% proficiency, ranked #60 of 656 in OH (top 9%) — strong family-tenant draw, lease renewals of 3-5y typical; only 14% free/reduced lunch — higher-income household profile.
- Market conditions: 146 active listings in the ZIP; 5 comparable units currently listed for rent nearby; rentals leasing fast (median 2d on market — plan ~1-2 weeks tenant-placement turnaround); solid renter incomes; 1,441 units permitted in Cuyahoga County in 2024 (700 in 5+ unit buildings).
Forward outlook
- Local home prices are declining (-3.0%/yr); year-one equity from $1k of loan paydown is wiped out by about $5k of value loss. Plan a longer hold.
- Cuyahoga County population projected to shrink 8% by 2050 — rents likely to lag national; underwrite the cash flow, not the appreciation.
Negotiation context
- Only 6 days on market — expect competitive offers; lowballing is unlikely to land.
- 2 sale attempts since 34y ago with the ask held roughly flat each time — persistent listings suggest the price (not the market) is what's stuck; bring a comps-based counter.
Risks & watch-outs
- Watch-outs: built in 1953 — expect roof / HVAC / electrical / plumbing capex.
Questions for the listing agent
- Built in 1953 — when were the roof, HVAC, electrical panel, plumbing, and water heater last replaced?
- Is there a deadline driving the sale (1031 exchange, divorce, estate, relocation)? That informs how much negotiation room exists.
- Schools are A-rated — typically a magnet for longer-tenancy family renters. What's the average tenant stay here, and is there a school-zone premium baked into asking?
- What's the average days-on-market for RENTAL listings here right now (not sales)? A rising rental-DOM trend means longer vacancies and softer asking-rent achievability than the comps imply.
- What's the recent tenant-quality profile in this submarket — average credit score on applications, eviction rate, late-payment / NSF rate, and stable-employment percentage? A property-management company in the area should have these aggregated.
- How much new for-sale + rental construction is in the pipeline within 1–3 miles? Heavy new supply typically softens prices + rents 12–24 months out; constrained supply supports both.
Investment metrics
- 1% rule
- 1.00% ✓
- Cap rate
- 7.42%
- Cash-on-cash
- 4.03%
- DSCR
- 1.18
- GRM
- 8.3
CMA / ARV
- ARV (on-the-fly)
- $248,034
- Comps found
- 5
Show comp detail 5 sales within ~0.75 mi
| Address | Dist | Beds/Ba | Sqft | Sold | Price | $/sf | Match |
|---|---|---|---|---|---|---|---|
| 5110 Royalwood Rd | 0.05mi | 3/2.0 | 1,339 (+8%) | 9mo | $310,000 | $232 | 72 |
| 6172 Royalwood Rd | 0.39mi | 2/1.0 (-1) | 1,170 (-5%) | 3mo | $235,000 | $201 | 65 |
| 11540 State Rd | 0.49mi | 3/1.0 | 1,349 (+9%) | 22mo | $205,000 | $152 | 44 |
| 12419 Ridge Rd | 0.72mi | 3/1.0 | 1,125 (-9%) | 12mo | $260,000 | $231 | 41 |
| 11633 State Rd | 0.47mi | 3/2.0 | 1,396 (+13%) | 20mo | $230,000 | $165 | 35 |
Match score weights: distance 35% · size 25% · config 20% · recency 20%. Top-matched comps best support the ARV.
Projected returns pro-forma
-3.0% appreciation · 3.0% rent growth · sell at horizon
- IRR
- -10.0%
- Equity multiple
- 0.64×
- Total profit
- $-16,832
- Equity at exit
- $24,602
- IRR
- -0.6%
- Equity multiple
- 0.96×
- Total profit
- $-1,813
- Equity at exit
- $14,266
Cash invested: $46,200 (down + closing). Projections, not guarantees.
Landlord ↔ Tenant lean methodology
- Overall (STATE)
- 73 Landlord-Friendly
- State Ohio
- 73 Landlord-Friendly · R+6
- County
- — inherits STATE
- City
- — inherits STATE
ZIP-level market 44133
- Active inventory
- 146
- Price-to-rent
- 8.3×
Monthly cashflow live
- Estimated rent
- $1,654 high interval (Pro) →
- Mortgage (P&I)
- −$865
- Tax from tax record
- −$218 /mo · $2,615/yr
- Insurance
- −$69
- HOA
- −$0
- Vacancy / Maint / Mgmt
- −$347
- Net cashflow
- $155
Break-even live
UW: 25.0% down · 7.5% · 30yr · 1.5% tax · 5.0% vac · 8.0% maint · 8.0% mgmt
Financing live
Cash to close
- Down payment
- $41,250
- Closing costs
- $4,950
- Reserves months
- —
- Total cash needed
- —
Loan-product check · same deal, 3 products live
Conventional
25% down · 7.5% · 30yr
- Down + closing
- —
- Monthly P&I
- —
- Monthly cashflow
- —
- DSCR
- —
- Eligible?
- —
Personal DTI + credit; lowest rate.
DSCR
20% down · 8.5% · 30yr
- Down + closing
- —
- Monthly P&I
- —
- Monthly cashflow
- —
- DSCR
- —
- Eligible?
- —
No personal income docs; deal must DSCR.
Hard money
10% down · 12.0% · 12mo
- Down + closing
- —
- Monthly P&I
- —
- Monthly cashflow
- —
- DSCR
- —
- Eligible?
- —
Short-term bridge; refi at stabilization.
Rent comps 5 comps
| Address | Beds | Baths | Sqft | Rent | $/sqft | DOM | Units | Dist |
|---|---|---|---|---|---|---|---|---|
| 5301 Royalwood Rd North Royalton, OH | 2.0 | 1.0 | 900 | $1,242 | $1.38 | 1d | 2 | 0.06mi |
| 14010 Pine Forest Dr North Royalton, OH | 1.0–2.0 | 1.0 | 840 | $1,309 | $1.56 | 1d | 16 | 0.75mi |
| 10800 State Rd North Royalton, OH | 3.0 | 2.0 | 1200 | $2,095 | $1.75 | 19d | 1 | 0.78mi |
| 7475 Glenmont Dr North Royalton, OH | 1.0–2.0 | 1.0–2.0 | 860 | $1,647 | $1.91 | 1d | 29 | 1.02mi |
| 8290 Royalton Rd North Royalton, OH | 1.0–2.0 | 1.0–2.0 | 894 | $1,882 | $2.11 | 1d | 20 | 1.43mi |
Listing history 7 events
-
2026-06-18status $165,000 Pending 6 DOM
-
2026-06-18days on market $165,000 Active 6 DOM
-
2026-06-17days on market $165,000 Active 5 DOM
-
2026-06-16days on market $165,000 Active 4 DOM
-
2026-06-15days on market $165,000 Active 3 DOM
-
2026-06-13remarks 699-char remark
-
2026-06-13$165,000 Active 1 DOM
ⓘ Source: listings_history table (triggers on properties + properties_extension) + one-shot
backfill from property_details.listing_events for pre-trigger history.
Tax reassessment forecast OH · Partial reset (capped growth)
- Current annual tax
- $2,615 · $218/mo
- Projected year-2 tax
- $2,615 · $218/mo
- Expected delta
- $0/yr ($0/mo · 0.0%)
ⓘ Screening estimate from a state-policy table — verify with the county assessor before closing.
Climate risk First Street
- Flood 1/10 Low FEMA zone X (unshaded) · 0% chance over 30 yrs
- Wildfire 1/10 Low
- Heat 2/10 Low 7 d/yr ≥94°F today · 17 d/yr by 30 yrs out
- Wind 1/10 Low
- Air quality 2/10 Low 1 unhealthy d/yr today · 3 by 30 yrs out
Nearby sold comps map
Loading sold comps map…
Walkable amenities ~0.75 mi
Loading nearby amenities…
Taxation est. · year 1
- Rental income
- $19,852
- − Mortgage interest
- −$9,243
- − Property taxes
- −$2,615
- − Insurance
- −$825
- − Repairs & maintenance
- −$1,588
- − Management
- −$1,588
- − Depreciation
- −$4,800
- Taxable loss
- −$806
- Est. tax savings @ 24.0%
- +$194
- After-tax cash flow
- $2,054/yr
For passive investors: Depreciation is non-cash, so a rental often shows a tax loss while cash-flowing — sheltering income. Rental losses are passive: they offset passive income freely, and up to $25,000/yr can offset ordinary (W-2) income if you actively participate and your MAGI is under $100k (phasing out to $0 by $150k); unused losses carry forward. On sale, claimed depreciation is recaptured at up to 25%, and gains may owe capital-gains tax (a 1031 exchange can defer both). Figures are a year-1 estimate at your 24.0% rate — not tax advice; consult a CPA.
Schools (NCES district)
- District
- North Royalton City
- NCES district ID
- 3904454
- Math proficiency
- 74% ▼ -11.00%
- Reading proficiency
- 81% ▼ -4.00%
- Median HH income
- $69,090
- Composite
- 67.39/100
- National rank
- #381
- State rank
- #60 of 656 in OH
Livability — North Royalton
- Score
- 77/100
- State rank
- #199
- US rank
- #3064
Category grades
Schools grade is shown separately in the Schools card above.
Census & demographics
- Census place
- North Royalton, OH
- County
- Cuyahoga County · 1,090,369 people
- City population
- 31,018
- Metro
- Cleveland-Elyria, OH
- Population (ZIP)
- 31,018
- Household income
- $83,717
- Rent vs Own
- Severe rent burden
- 406.0
Population outlook (Cuyahoga County) Hauer SSP2
- Today (2025)
- 1,244,621 people
- By 2030
- 1,230,093 · -1.2%
- By 2040
- 1,189,108 · -4.5%
- By 2050
- 1,145,706 · -7.9%
- By 2075
- 1,076,557 · -13.5%
- By 2100
- 978,987 · -21.3%
Race, ethnicity, and origin ACS 2023
- Neighborhood character
- Predominantly White (87%)
- Race & ethnicity
- White 87% Two or more races 5% Asian 5% Hispanic / Latino 4% Black 1%
- Common ancestry
- Romanian 12% Subsaharan African 6% Lithuanian 2%
- Foreign-born
- 12% · Canada
- Languages at home
- 83% English-only · Russian/Polish/Slavic 7% Other Indo-European 3% Spanish 2%
Political lean MEDSL · Cuyahoga
- 2024 margin
- Solid D (+31.5) · D 65.4% · R 33.9%
- 2008→2024 swing
- -7.4pp toward R · 2008: 38.9pp · 2024: 31.5pp
- All cycles
- 2024: D+31.5 2020: D+34.1 2016: D+35.0 2012: D+38.7 2008: D+38.9
Not yet ingested
- Civics
- —
Market trends
- HPI YoY
- ▼ -151.75%
- Current HPI
- 199.4398
- Rent YoY
- —
- Metro
- Cleveland-Elyria, OH
- State GDP YoY
- ▲ 1.98%
- F500 in state
- 48
Industry mix (Fortune 500 HQ in OH)
| Industry | F500 HQs | Revenue |
|---|---|---|
| Insurance | 3 | $145B |
|
||
| Industrial Machinery | 3 | $49B |
|
||
| Financial Services | 3 | $24B |
|
||
| Consumer Goods | 2 | $93B |
|
||
| Aerospace / Defense | 2 | $47B |
|
||
| Utilities | 2 | $33B |
|
||
Price history
+74.6% since first listed3 events — show timeline
- 2026-06-12 Listed $165,000 MLSNOW
- 1993-04-05 Listing Removed — MLSNOW
- 1992-10-05 Listed $94,500 MLSNOW
Property tax history
+2.1%/yrLatest (2025): $2,615 · -6.6% YoY. Source: county tax records.
Cash-flow waterfall
monthlySold comps — $/sqft
last 12 mo · ≤1 miLoading sold comps…