 Triplex
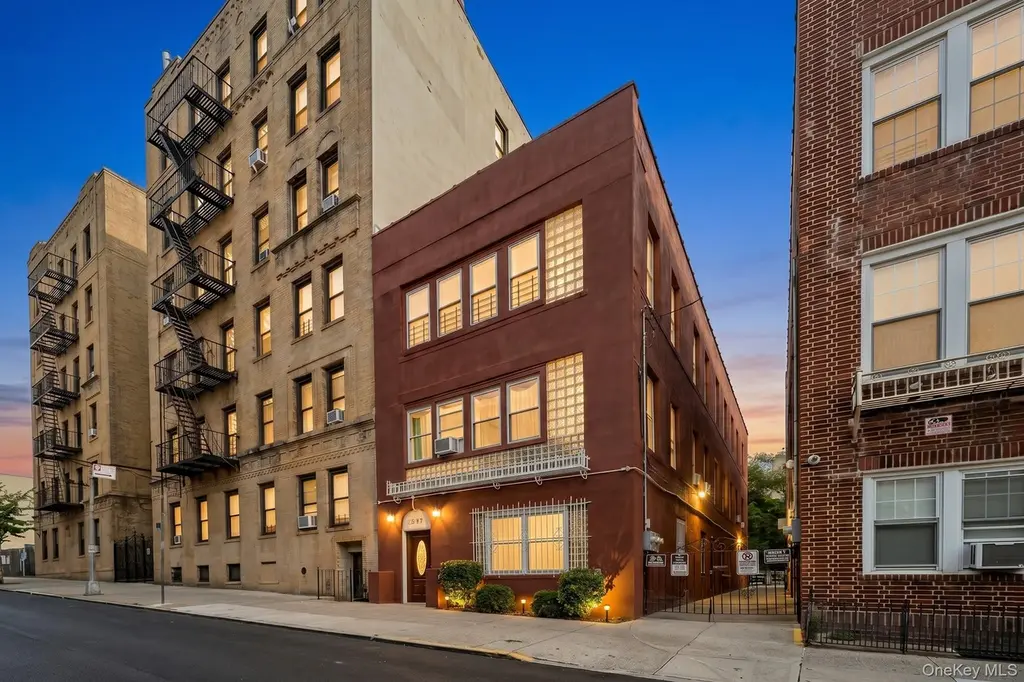
3277 Parkside Pl · New York, NY
Flood risk 1/10 · Minimal
- FEMA flood zone
- X (unshaded)
- Chance of flooding over 30 yrs
- 0.0%
- Est. flood insurance / yr
- $507 – $1,088
Fire risk 1/10 · Minimal
- Est. fire insurance / yr
- $691 – $1,283
Heat risk 6/10 · Moderate
- Hot days now (above 99°F)
- 7 days/yr
- Hot days in 30 yrs
- 14 days/yr
Wind risk 6/10 · Moderate
- Chance of severe wind over 30 yrs
- 27.0%
Air-quality risk 3/10 · Minor
- Unhealthy air days now
- 3 days/yr
- Unhealthy air days in 30 yrs
- 4 days/yr
Risk factors via First Street. Map © Google.
Why this score? — see what drove the D grade
The composite is a weighted blend of 9 inputs, each scored 0–100. Each bar is that input's sub-score; the figure is the points it added to the 100-point composite (weight × sub-score).
- Cash flow +12.9/30.0
- ARV discount +5.2/15.0
- Schools +5.0/10.0
- Rent growth +4.8/5.0
- DSCR +3.9/10.0
- Livability +3.8/5.0
- 1% rule +2.7/10.0
- Condition / age +2.5/5.0
- Appreciation +0.0/10.0
$1,230,000
🖨 Deal sheet 📄 Offer letter ✓ Due diligence
Multi-family units
County records classify this as Multi-Family (2-4 Unit). Listing-text estimate: 3 units. confirmed
Listing remarks
Own a home you'll be proud to call yours. Legal 3-family brick semi-detached home in Norwood, the Bronx, offering approximately 3,872 square feet with an attached 2-car garage and shared driveway — an uncommon parking setup in the Bronx. Move-in-ready with new electrical, new lintel all windows, and a recently redone exterior, R7B zoning. The first floor is a 2-bedroom, 1-bathroom unit. The second and third floors each feature high celling a spacious 5-bedroom unit with 1 full and 1 half bathroom. Solid brick construction throughout, plus a private backyard. Located near the D train and the 2 and 5 subway lines, with a Metro-North station, shopping, grocery stores, restaurants, and pa
Key facts
- Private backyard
- New electrical
- Shared driveway
Tags
Property features AI
Exterior
- Parking: Driveway; 2-car garage
- Security: Video cameras
- Utilities: Electric service by Con-Edison; Public sewer; Electricity available
- Home design: Triplex
- Construction: Brick exterior; Brick/mortar foundation
- Exterior features: Brick construction; Video security cameras; Brick/mortar foundation; Additional foundation details
Interior
- Kitchen: Quartz/Quartzite counters
- Bedrooms: Two 4-bedroom units; One 2-bedroom unit
- Bathrooms: Five full bathrooms
- Heating & cooling: Radiant heating; Other heating system; Wall/window air conditioning units
- Interior features: First-floor bedroom; First-floor full bathroom; High ceilings; Primary bathroom; Master bedroom on main level; Quartz or quartzite countertops; Other interior features
Neighborhood map
What this means for you Summary
Snapshot
- This is a 3 × 4-bed/2.2-bath units multifamily listed at $1.23M.
Deal economics
- At list price, monthly cash flow is $-94 ($-1k/yr) — negative. Per door: $-31/mo.
- To cash-flow at today's rent, offer at most $1.21M (1.4% below list).
- To meet the 1% rule (rent ≥ 1% of price), the offer needs to be $952k (22.6% below list).
- Recommended offer: $952k (22.6% below list) — sets the bar for 1% rule.
- Cap rate 6.2% vs local median 2.6% in New York — top-decile yield for the area; either an underpriced asset or a hidden risk that comps aren't pricing in. Stress-test before assuming the spread holds.
Location & tenants
- Location reads 75/100 on livability (#268 in NY, #4,188 nationally) — a middle-class / working-renter tenant base. Strengths: amenities A+, commute A+, health & safety A; Watch: crime F, cost of living F.
- Market conditions: Rents rising fast (+9.2%/yr); 129 active listings in the ZIP; 6,929 units permitted in Bronx County in 2024 (6,829 in 5+ unit buildings).
- At $9,518/mo this rent would consume 232% of the median local household income ($49k/yr) (locally 10930% of renters already pay >50% of income on rent) — very limited rent-growth headroom before tenants either downsize or default.
Forward outlook
- Local home prices are declining (-3.0%/yr); year-one equity from $9k of loan paydown is wiped out by about $37k of value loss. Plan a longer hold.
- Bronx County population projected at +21% by 2050 — long-run rental-demand tailwind backs the buy-and-hold thesis.
Negotiation context
- Only 4 days on market — expect competitive offers; lowballing is unlikely to land.
- Current owner paid $800k; list at $1.23M implies a 54% gain — meaningful room to come down on a strong offer.
Risks & watch-outs
- Watch-outs: built in 1920 — expect roof / HVAC / electrical / plumbing capex.
- Climate carrying-cost: major wind risk, 27% chance of damaging wind over 30y; extreme-heat days projected 7→14/yr by 2055 (HVAC capex compounding) — expect insurance premiums to compound above CPI over the hold.
Questions for the listing agent
- What do current leases actually rent for vs. the listed asking? Can we see a recent rent roll and the last 12 months of T-12 income?
- Can we see the unit-by-unit rent roll, current vacancy, and any below-market leases? What's the average tenancy length?
- What capital expenditures (roof, boiler, parking lot, exteriors) have been made in the last 5 years, and what's planned in the next 2?
- Built in 1920 — when were the roof, HVAC, electrical panel, plumbing, and water heater last replaced?
- Is there a deadline driving the sale (1031 exchange, divorce, estate, relocation)? That informs how much negotiation room exists.
- Schools are B-rated — typically a magnet for longer-tenancy family renters. What's the average tenant stay here, and is there a school-zone premium baked into asking?
- Crime grade is F in this area — have there been break-ins, vandalism, or insurance claims at this property in the last 3 years? What carrier currently insures it and at what premium?
- The area grade is low — what's the realistic commute time and amenity access for the typical tenant pool here? Any planned neighborhood developments (good or bad) we should know about?
- What's the average days-on-market for RENTAL listings here right now (not sales)? A rising rental-DOM trend means longer vacancies and softer asking-rent achievability than the comps imply.
- What's the recent tenant-quality profile in this submarket — average credit score on applications, eviction rate, late-payment / NSF rate, and stable-employment percentage? A property-management company in the area should have these aggregated.
- How much new apartment / multifamily construction is in the pipeline within 1–3 miles? Heavy new supply (>2% of stock underway) typically softens rents 12–24 months out; light construction supports rent growth.
Investment metrics
- 1% rule
- 0.77% ✗
- Cap rate
- 6.20%
- Cash-on-cash
- -0.33%
- DSCR
- 0.99
- GRM
- 10.8
CMA / ARV
- ARV (on-the-fly)
- $1,169,344
- Comps found
- 1
Show comp detail 1 sale within ~0.75 mi
| Address | Dist | Beds/Ba | Sqft | Sold | Price | $/sf | Match |
|---|---|---|---|---|---|---|---|
| 781 E 211 St | 0.59mi | 11/6.0 (-1) | 3,877 (+0%) | 1mo | $1,170,000 | $302 | 64 |
Match score weights: distance 35% · size 25% · config 20% · recency 20%. Top-matched comps best support the ARV.
Projected returns pro-forma
-3.0% appreciation · 8.0% rent growth · sell at horizon
- IRR
- -12.0%
- Equity multiple
- 0.55×
- Total profit
- $-155,419
- Equity at exit
- $183,397
- IRR
- 2.8%
- Equity multiple
- 1.24×
- Total profit
- $84,238
- Equity at exit
- $106,348
Cash invested: $344,400 (down + closing). Projections, not guarantees.
Landlord ↔ Tenant lean methodology
- Overall (CITY)
- 0 Strongly Tenant-Friendly
- State New York
- 15 Strongly Tenant-Friendly · D+10
- County
- — inherits STATE
- City New York
- 0 Strongly Tenant-Friendly · D+34
ZIP-level market 10467
- Home prices YoY
- -32.8%
- Rents YoY
- 9.2%
- Active inventory
- 129
- Price-to-rent
- 32.3×
Monthly cashflow live
- Estimated rent
- $9,518 medium interval (Pro) →
- Mortgage (P&I)
- −$6,450
- Tax from tax record
- −$651 /mo · $7,809/yr
- Insurance
- −$512
- HOA
- −$0
- Vacancy / Maint / Mgmt
- −$1,999
- Net cashflow
- $-94
Break-even live
3-unit breakdown (identical units grouped — click to expand)
| Units | Beds | Baths | Est. rent |
|---|---|---|---|
| 3× units | 4 | 2.2 | $9,519 |
| #1 | 4 | 2.2 | $3,173 |
| #2 | 4 | 2.2 | $3,173 |
| #3 | 4 | 2.2 | $3,173 |
| Total (3 units) | $9,518 | ||
UW: 25.0% down · 7.5% · 30yr · 1.5% tax · 5.0% vac · 8.0% maint · 8.0% mgmt
Financing live
Cash to close
- Down payment
- $307,500
- Closing costs
- $36,900
- Reserves months
- —
- Total cash needed
- —
Loan-product check · same deal, 3 products live
Conventional
25% down · 7.5% · 30yr
- Down + closing
- —
- Monthly P&I
- —
- Monthly cashflow
- —
- DSCR
- —
- Eligible?
- —
Personal DTI + credit; lowest rate.
DSCR
20% down · 8.5% · 30yr
- Down + closing
- —
- Monthly P&I
- —
- Monthly cashflow
- —
- DSCR
- —
- Eligible?
- —
No personal income docs; deal must DSCR.
Hard money
10% down · 12.0% · 12mo
- Down + closing
- —
- Monthly P&I
- —
- Monthly cashflow
- —
- DSCR
- —
- Eligible?
- —
Short-term bridge; refi at stabilization.
Listing history 6 events
-
2026-06-18days on market $1,230,000 Active 4 DOM
-
2026-06-17days on market $1,230,000 Active 3 DOM
-
2026-06-16days on market $1,230,000 Active 2 DOM
-
2026-06-15status $1,230,000 Active 1 DOM
-
2026-06-13remarks 693-char remark
-
2026-06-13$1,230,000 Coming Soon 1 DOM
ⓘ Source: listings_history table (triggers on properties + properties_extension) + one-shot
backfill from property_details.listing_events for pre-trigger history.
Tax reassessment forecast NY · Partial reset (capped growth)
- Current annual tax
- $7,809 · $651/mo
- Projected year-2 tax
- $14,298 · $1,192/mo
- Expected delta
- +$6,489/yr (+$541/mo · 83.1%)
ⓘ Screening estimate from a state-policy table — verify with the county assessor before closing.
Climate risk First Street
- Flood 1/10 Low FEMA zone X (unshaded) · 0% chance over 30 yrs
- Wildfire 1/10 Low
- Heat 6/10 Major 7 d/yr ≥99°F today · 14 d/yr by 30 yrs out
- Wind 6/10 Major 27% chance of damaging wind over 30 yrs
- Air quality 3/10 Moderate 3 unhealthy d/yr today · 4 by 30 yrs out
Nearby sold comps map
Loading sold comps map…
Walkable amenities ~0.75 mi
Loading nearby amenities…
Taxation est. · year 1
- Rental income
- $114,216
- − Mortgage interest
- −$68,899
- − Property taxes
- −$7,809
- − Insurance
- −$6,150
- − Repairs & maintenance
- −$9,137
- − Management
- −$9,137
- − Depreciation
- −$35,782
- Taxable loss
- −$22,699
- Est. tax savings @ 24.0%
- +$5,448
- After-tax cash flow
- $4,316/yr
For passive investors: Depreciation is non-cash, so a rental often shows a tax loss while cash-flowing — sheltering income. Rental losses are passive: they offset passive income freely, and up to $25,000/yr can offset ordinary (W-2) income if you actively participate and your MAGI is under $100k (phasing out to $0 by $150k); unused losses carry forward. On sale, claimed depreciation is recaptured at up to 25%, and gains may owe capital-gains tax (a 1031 exchange can defer both). Figures are a year-1 estimate at your 24.0% rate — not tax advice; consult a CPA.
Schools (NCES district)
No district data.
Livability — New York
- Score
- 75/100
- State rank
- #268
- US rank
- #4188
Category grades
Schools grade is shown separately in the Schools card above.
Census & demographics
- Census place
- New York, NY
- County
- Bronx County · 1,197,324 people
- City population
- 7,731,280
- Metro
- New York-Newark-Jersey City, NY-NJ-PA
- Population (ZIP)
- 96,421
- Household income
- $49,330
- Rent vs Own
- Severe rent burden
- 10930.0
Population outlook (Bronx County) Hauer SSP2
- Today (2025)
- 1,607,353 people
- By 2030
- 1,681,852 · +4.6%
- By 2040
- 1,824,421 · +13.5%
- By 2050
- 1,945,470 · +21.0%
- By 2075
- 2,187,887 · +36.1%
- By 2100
- 2,244,136 · +39.6%
Race, ethnicity, and origin ACS 2023
- Neighborhood character
- Diverse neighborhood (Simpson 0.62)
- Race & ethnicity
- Hispanic / Latino 53% Black 28% Two or more races 11% White 9% Asian 6% Native American 1%
- Hispanic origin (detail)
- Mexican 7% Puerto Rican 16% Dominican 22%
- Foreign-born
- 39% · Canada, Jamaica
- Languages at home
- 41% English-only · Spanish 45% Other Indo-European 7% French/Haitian/Cajun 1%
Political lean MEDSL · Bronx
- 2024 margin
- Solid D (+45.4) · D 72.7% · R 27.3%
- 2008→2024 swing
- -32.3pp toward R · 2008: 77.8pp · 2024: 45.4pp
- All cycles
- 2024: D+45.4 2020: D+67.6 2016: D+79.1 2012: D+82.9 2008: D+77.8
Not yet ingested
- Civics
- —
Market trends
- HPI YoY
- ▼ -112.76%
- Current HPI
- 231.537
- Rent YoY
- ▲ 9.23%
- Metro
- New York-Newark-Jersey City, NY-NJ-PA
- State GDP YoY
- ▲ 2.60%
- F500 in state
- 92
Industry mix (Fortune 500 HQ in NY)
| Industry | F500 HQs | Revenue |
|---|---|---|
| Financial Services | 10 | $950B |
|
||
| Consumer Goods | 9 | $162B |
|
||
| Insurance | 4 | $225B |
|
||
| Telecommunications | 2 | $144B |
|
||
| Pharmaceuticals | 2 | $112B |
|
||
| Media / Entertainment | 2 | $69B |
|
||
Price history
+1682.6% since first listed3 events — show timeline
- 2026-06-12 Coming Soon $1,230,000 OneKey® MLS as Distributed by MLS Grid
- 2022-02-09 Sold (Public Records) $800,000 Public Records
- 1993-11-16 Sold (Public Records) $69,000 Public Records
Property tax history
+4.9%/yrLatest (2025): $7,809 · +0.0% YoY. Source: county tax records.
Cash-flow waterfall
monthlySold comps — $/sqft
last 12 mo · ≤1 miLoading sold comps…