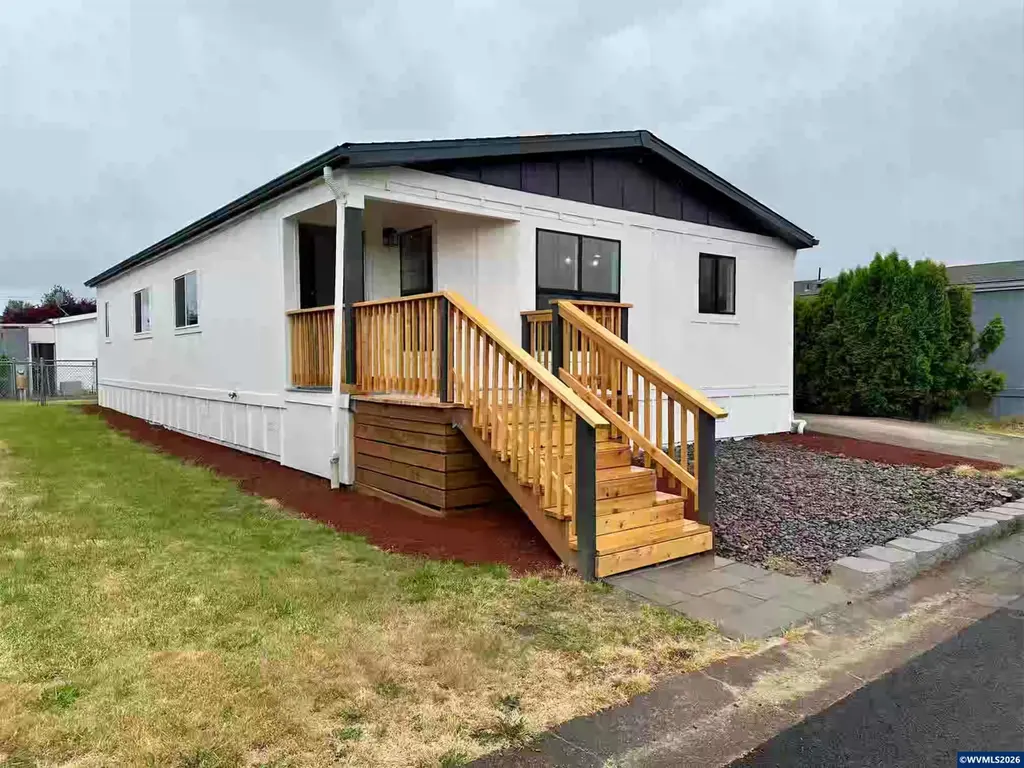
2728 Shellyanne Way NE #107 · Salem, OR
Flood risk 1/10 · Minimal
- FEMA flood zone
- X (unshaded)
- Chance of flooding over 30 yrs
- 0.0%
- Est. flood insurance / yr
- $507 – $1,088
Fire risk 1/10 · Minimal
- Est. fire insurance / yr
- $498 – $926
Heat risk 3/10 · Minor
- Hot days now (above 92°F)
- 7 days/yr
- Hot days in 30 yrs
- 14 days/yr
Wind risk 1/10 · Minimal
- Chance of severe wind over 30 yrs
- —
Air-quality risk 10/10 · Severe
- Unhealthy air days now
- 13 days/yr
- Unhealthy air days in 30 yrs
- 14 days/yr
Risk factors via First Street. Map © Google.
Why this score? — see what drove the B- grade
The composite is a weighted blend of 9 inputs, each scored 0–100. Each bar is that input's sub-score; the figure is the points it added to the 100-point composite (weight × sub-score).
- Cash flow +26.5/30.0
- DSCR +9.0/10.0
- ARV discount +7.3/15.0
- 1% rule +7.1/10.0
- Appreciation +5.0/10.0
- Livability +4.0/5.0
- Condition / age +4.0/5.0
- Schools +3.7/10.0
- Rent growth +2.5/5.0
$149,995
🖨 Deal sheet 📄 Offer letter ✓ Due diligence
Listing remarks
Move-in ready! Fully remodeled 3-bed, 2-bath manufactured home with a modern luxurious feel. Features open-concept living, recessed lighting, new laminated flooring, new subfloor, and NEW ROOF! Upgraded kitchen with white quartz counters, stainless steel appliances, custom cabinetry, and island. Bathrooms feature quartz counters and double sliding shower doors. Spacious yard, covered carport, and washer/dryer hookups. Space rent starts at $1,078 + utilities.
Key facts
- Upgraded kitchen
- Recessed lighting
- New subfloor
Tags
Property features AI
Finance
- Other: No home warranty
- HOA & community: Located in Hollywood Estates (park); Not an adult-only park; Space rent starts at $1,078 plus utilities
Exterior
- Parking: Carport; 1 garage space
- Utilities: City water; City sewer
- Home design: Double wide manufactured home; Built in 1991; White exterior color; T111 siding; Shingle roof
- Construction: T111 siding construction; Shingle roof; 1991 construction
- Exterior features: Deck; Spacious yard; Covered carport
Interior
- Kitchen: Upgraded kitchen with white quartz counters; Custom cabinetry; Kitchen island; Stainless steel appliances; Electric range; Dishwasher
- Bedrooms: 3 bedrooms
- Flooring: Laminate flooring (new); Vinyl flooring
- Bathrooms: 2 bathrooms; Bathrooms with quartz counters and double sliding shower doors
- Heating & cooling: Forced air heating
- Interior features: Open-concept living; Recessed lighting; New subfloor; New laminated flooring; Vinyl flooring
- Laundry & utility: Washer/dryer hookups
Neighborhood map
What this means for you Summary
Snapshot
- This is a 3-bed/2.0-bath manufactured listed at $150k. Condition is rated good.
Deal economics
- At list price, monthly cash flow is $396 ($5k/yr) — positive.
- The deal already cash-flows at list — no discount required.
- Meets the 1% rule at list price ($2k rent vs $150k).
- Recommended offer: $148k (1.5% below list) — sets the bar for market timing.
- Cap rate 9.5% vs local median 2.9% in Salem — top-decile yield for the area; either an underpriced asset or a hidden risk that comps aren't pricing in. Stress-test before assuming the spread holds.
Location & tenants
- Location reads 79/100 on livability (#59 in OR, #2,084 nationally) — a middle-class / working-renter tenant base. Strengths: amenities A+, commute A+, housing A+; Watch: crime F.
- Salem-Keizer SD 24J (urban): math 34% / reading 47% proficiency, ranked #103 of 183 in OR (top 56%) — families likely to look elsewhere, expect single-tenant / working-renter base with shorter leases.
- Zoned schools: Scott Elementary School (517 students, 57% FRL); Mckay High School (2,311 students, 102% FRL) — zoned schools average 80% FRL vs 53% district-wide (27 pts higher); higher-poverty schools than district average — tighter screening recommended.
- Market conditions: 1 active listings in the ZIP; 40 comparable units currently listed for rent nearby; rentals at typical pace (median 24d on market — plan ~3-4 weeks tenant-placement turnaround); 1,591 units permitted in Marion County in 2024 (716 in 5+ unit buildings).
Forward outlook
- In year one you build about $6k of equity ($1k loan paydown + $4k appreciation (3.0% local appreciation)).
- Marion County population projected at +17% by 2050 — long-run rental-demand tailwind backs the buy-and-hold thesis.
- At projected returns (3.0% appreciation + 3.0% rent growth), your $42k cash investment doubles in ~4 years — after that, you're playing with house money.
- By year 7, paydown + projected appreciation supports a ~$35k cash-out refi (75% LTV) — recoverable capital for the next deal without selling this one.
Negotiation context
- It's been on market 24 days — a 2% lower offer ($148k) is reasonable based on typical stale-listing flexibility.
Questions for the listing agent
- Is there a deadline driving the sale (1031 exchange, divorce, estate, relocation)? That informs how much negotiation room exists.
- Schools are D-rated, which usually means shorter tenancies and higher turnover. Who's the typical renter profile here, and what's been the actual vacancy rate?
- Crime grade is F in this area — have there been break-ins, vandalism, or insurance claims at this property in the last 3 years? What carrier currently insures it and at what premium?
- What's the average days-on-market for RENTAL listings here right now (not sales)? A rising rental-DOM trend means longer vacancies and softer asking-rent achievability than the comps imply.
- What's the recent tenant-quality profile in this submarket — average credit score on applications, eviction rate, late-payment / NSF rate, and stable-employment percentage? A property-management company in the area should have these aggregated.
- How much new for-sale + rental construction is in the pipeline within 1–3 miles? Heavy new supply typically softens prices + rents 12–24 months out; constrained supply supports both.
Investment metrics
- 1% rule
- 1.21% ✓
- Cap rate
- 9.46%
- Cash-on-cash
- 11.31%
- DSCR
- 1.50
- GRM
- 6.9
CMA / ARV
- ARV (on-the-fly)
- $149,388
- Comps found
- 12
Show comp detail 12 sales within ~0.75 mi
| Address | Dist | Beds/Ba | Sqft | Sold | Price | $/sf | Match |
|---|---|---|---|---|---|---|---|
| 4500 Angie Marie Way NE #17 | 0.11mi | 2/2.0 (-1) | 1,260 (-0%) | 6mo | $105,000 | $83 | 84 |
| 2935 Surf Ct NE | 0.17mi | 3/2.0 | 1,280 (+1%) | 10mo | $355,000 | $277 | 82 |
| 2560 Brown Rd | 0.27mi | 3/2.0 | 1,296 (+2%) | 5mo | $412,000 | $318 | 80 |
| 3034 Surfwood Dr NE | 0.23mi | 2/2.0 (-1) | 1,344 (+6%) | 3mo | $145,000 | $108 | 71 |
| 4722 Wyoming Cir NE | 0.55mi | 3/2.0 | 1,188 (-6%) | 1mo | $85,000 | $72 | 64 |
| 3460 Hidden Vw NE #10 | 0.71mi | 3/2.0 | 1,296 (+2%) | 3mo | $94,500 | $73 | 61 |
| 3182 Sandal Ct NE | 0.36mi | 3/2.0 | 1,440 (+14%) | 1mo | $170,000 | $118 | 59 |
| 4490 Angie Marie Way | 0.08mi | 2/2.0 (-1) | 1,080 (-15%) | 10mo | $83,500 | $77 | 58 |
| 4490 Angie Marie Way #16 | 0.08mi | 2/2.0 (-1) | 1,080 (-15%) | 10mo | $83,900 | $78 | 58 |
| 4754 El Cedro St | 0.56mi | 3/2.0 | 1,188 (-6%) | 9mo | $250,000 | $210 | 56 |
| 3232 Sandal Ct NE | 0.38mi | 2/2.0 (-1) | 1,152 (-9%) | 9mo | $237,500 | $206 | 54 |
| 4759 Deepwood Loop NE | 0.70mi | 2/2.0 (-1) | 1,440 (+14%) | 5mo | $295,000 | $205 | 35 |
Match score weights: distance 35% · size 25% · config 20% · recency 20%. Top-matched comps best support the ARV.
Projected returns pro-forma
3.0% appreciation · 3.0% rent growth · sell at horizon
- IRR
- 18.1%
- Equity multiple
- 2.03×
- Total profit
- $43,302
- Equity at exit
- $67,444
- IRR
- 19.5%
- Equity multiple
- 3.83×
- Total profit
- $118,887
- Equity at exit
- $103,940
Cash invested: $41,999 (down + closing). Projections, not guarantees.
Landlord ↔ Tenant lean methodology
- Overall (STATE)
- 28 Tenant-Leaning
- State Oregon
- 28 Tenant-Leaning · D+6
- County
- — inherits STATE
- City
- — inherits STATE
ZIP-level market 97305-4000
- Active inventory
- 1
- Price-to-rent
- 6.9×
Monthly cashflow live
- Estimated rent
- $1,813 high interval (Pro) →
- Mortgage (P&I)
- −$787
- Tax est. 1.5%
- −$187 /mo · $2,250/yr
- Insurance
- −$62
- HOA
- −$0
- Vacancy / Maint / Mgmt
- −$381
- Net cashflow
- $396
Break-even live
UW: 25.0% down · 7.5% · 30yr · 1.5% tax · 5.0% vac · 8.0% maint · 8.0% mgmt
Financing live
Cash to close
- Down payment
- $37,499
- Closing costs
- $4,500
- Reserves months
- —
- Total cash needed
- —
Loan-product check · same deal, 3 products live
Conventional
25% down · 7.5% · 30yr
- Down + closing
- —
- Monthly P&I
- —
- Monthly cashflow
- —
- DSCR
- —
- Eligible?
- —
Personal DTI + credit; lowest rate.
DSCR
20% down · 8.5% · 30yr
- Down + closing
- —
- Monthly P&I
- —
- Monthly cashflow
- —
- DSCR
- —
- Eligible?
- —
No personal income docs; deal must DSCR.
Hard money
10% down · 12.0% · 12mo
- Down + closing
- —
- Monthly P&I
- —
- Monthly cashflow
- —
- DSCR
- —
- Eligible?
- —
Short-term bridge; refi at stabilization.
Rent comps 40 comps
| Address | Beds | Baths | Sqft | Rent | $/sqft | DOM | Units | Dist |
|---|---|---|---|---|---|---|---|---|
| 4252 Ash Grove Dr NE Salem, OR | 3.0 | 2.0 | 1357 | $2,100 | $1.55 | 13d | 1 | 0.19mi |
| 4359 Rodeo Dr NE Salem, OR | 3.0 | 2.0 | 1170 | $2,245 | $1.92 | 21d | 1 | 0.19mi |
| 2970 Phipps Ln NE Salem, OR | 4.0 | 2.0 | 1350 | $2,450 | $1.81 | 23d | 1 | 0.34mi |
| 4768 El Cedro Loop NE Salem, OR | 3.0 | 2.0 | 1344 | $1,895 | $1.41 | 43d | 1 | 0.45mi |
| 2500 Lancaster Dr NE Salem, OR | 1.0–2.0 | 1.0 | 771 | $1,350 | $1.75 | 13d | 11 | 0.47mi |
| 2500 Lancaster Dr NE Unit 35 Salem, OR | 2.0 | 1.0 | 890 | $1,295 | $1.46 | 43d | 1 | 0.47mi |
| 4824 Falcon Ct NE Salem, OR | 3.0 | 1.5 | 1246 | $1,995 | $1.60 | 23d | 1 | 0.53mi |
| 4889 Saunter Loop NE Salem, OR | 3.0 | 1.5 | 1186 | $1,925 | $1.62 | 43d | 1 | 0.58mi |
| 3240 Harold Dr NE Salem, OR | 1.0–3.0 | 1.0–2.0 | 972 | $1,850 | $1.90 | 23d | 13 | 0.60mi |
| 3240 Harold Dr NE Unit 3236-311 Salem, OR | 2.0 | 2.0 | 1060 | $1,650 | $1.56 | 43d | 1 | 0.60mi |
| 3240 Harold Dr NE Unit 3255-122 Salem, OR | 3.0 | 2.0 | 1192 | $1,850 | $1.55 | 43d | 1 | 0.60mi |
| 1973 45th Ave NE Salem, OR | 2.0 | 1.0–2.0 | 1043 | $1,360 | $1.30 | 13d | 2 | 0.62mi |
| 4712 Silverton Rd NE Salem, OR | 2.0 | 2.0 | 952 | $1,495 | $1.57 | 13d | 5 | 0.63mi |
| 3454 Chiefs Ct NE Salem, OR | 2.0 | 1.5 | 880 | $1,650 | $1.88 | 23d | 1 | 0.64mi |
| 4470 Conser Way NE Salem, OR | 2.0 | 2.0 | 925 | $1,395 | $1.51 | 13d | 3 | 0.64mi |
| 4200 Sunnyview Rd NE Salem, OR | 2.0 | 1.0–2.0 | 880 | $1,445 | $1.64 | 23d | 1 | 0.68mi |
| 2489 Coral Ave NE Salem, OR | 1.0–2.0 | 1.0 | 817 | $1,301 | $1.59 | 13d | 11 | 0.69mi |
| 4455 Seaton Ln NE Salem, OR | 2.0–3.0 | 2.0 | 1087 | $1,695 | $1.56 | 13d | 5 | 0.69mi |
| 4154 Sunnyview Rd NE Salem, OR | 1.0–2.0 | 1.0 | 806 | $1,375 | $1.71 | 13d | 6 | 0.71mi |
| 3654 47th Ave NE Unit 3654-D Salem, OR | 2.0 | 1.0 | 900 | $1,150 | $1.28 | 43d | 1 | 0.72mi |
| 3211 Autumn Chase Way NE Unit 330-09203 Salem, OR | 2.0 | 1.0 | 916 | $1,300 | $1.42 | 23d | 1 | 0.72mi |
| 3211 Autumn Chase Way NE Unit 330-10204 Salem, OR | 2.0 | 1.0 | 916 | $1,400 | $1.53 | 23d | 1 | 0.72mi |
| 4495 Pacifica Way NE Salem, OR | 2.0 | 2.0 | 900 | $1,445 | $1.61 | 13d | 1 | 0.78mi |
| 3617 Silverstone Dr NE Salem, OR | 3.0 | 2.0 | 1526 | $2,195 | $1.44 | 21d | 1 | 0.78mi |
| 3910-3930 Sunnyview Rd NE Salem, OR | 3.0 | 2.5 | 1300 | $1,845 | $1.42 | 13d | 6 | 0.82mi |
| 3661 Silverstone Ct NE Salem, OR | 3.0 | 2.0 | 1742 | $2,295 | $1.32 | 13d | 1 | 0.84mi |
| 3017 Alameda St NE Salem, OR | 4.0 | 2.0 | 1350 | $2,395 | $1.77 | 43d | 1 | 0.87mi |
| 3420 Monarch Dr NE Unit 3422 Salem, OR | 2.0 | 1.0 | 910 | $1,250 | $1.37 | 13d | 1 | 0.89mi |
| 4098 Market St NE Unit MT21 Salem, OR | 2.0 | 1.0 | 900 | $1,275 | $1.42 | 23d | 1 | 0.89mi |
| 3370 Beacon Ct NE Salem, OR | 3.0 | 1.0 | 936 | $2,100 | $2.24 | 43d | 1 | 0.90mi |
| 3976 Rockwood Park Dr NE Salem, OR | 1.0–2.0 | 1.0–1.5 | 862 | $1,375 | $1.59 | 23d | 11 | 0.90mi |
| 4054 Aden Pl NE Salem, OR | 3.0 | 2.5 | 1558 | $2,100 | $1.35 | 23d | 1 | 0.94mi |
| 4032 Aden Pl NE Salem, OR | 3.0 | 3.0 | 1558 | $2,100 | $1.35 | 43d | 1 | 0.95mi |
| 3440 Hawthorne Ave NE Unit 3444-102 Salem, OR | 3.0 | 2.0 | 1175 | $1,795 | $1.53 | 43d | 1 | 0.99mi |
| 3489 Hawthorne Ave NE Salem, OR | 3.0 | 2.0 | 1250 | $1,950 | $1.56 | 23d | 1 | 1.06mi |
| 3493 Hawthorne Ave NE Salem, OR | 3.0 | 2.0 | 1250 | $1,950 | $1.56 | 23d | 1 | 1.07mi |
| 2015 Debbie Way NE Unit 2045 Salem, OR | 3.0 | 1.0 | 1008 | $1,825 | $1.81 | 13d | 1 | 1.09mi |
| 3655 Hawthorne Ave NE Unit 3655 Salem, OR | 2.0 | 1.0 | 900 | $1,100 | $1.22 | 43d | 1 | 1.13mi |
| 3220 Lansing Ave NE Salem, OR | 2.0–3.0 | 2.0 | 950 | $1,980 | $2.08 | 13d | 12 | 1.16mi |
| 3394 30th Ave NE Unit 3408-108 Salem, OR | 2.0 | 1.0 | 900 | $1,195 | $1.33 | 43d | 1 | 1.20mi |
Listing history 15 events
-
2026-06-18days on market $149,995 Active 24 DOM
-
2026-06-17days on market $149,995 Active 23 DOM
-
2026-06-16days on market $149,995 Active 22 DOM
-
2026-06-15days on market $149,995 Active 21 DOM
-
2026-06-14days on market $149,995 Active 19 DOM
-
2026-06-10days on market $149,995 Active 16 DOM
-
2026-06-09days on market $149,995 Active 15 DOM
-
2026-06-08days on market $149,995 Active 14 DOM
-
2026-06-07days on market $149,995 Active 13 DOM
-
2026-06-03days on market $149,995 Active 9 DOM
-
2026-06-02days on market $149,995 Active 8 DOM
-
2026-06-01days on market $149,995 Active 7 DOM
-
2026-05-31days on market $149,995 Active 6 DOM
-
2026-05-30days on market $149,995 Active 5 DOM
-
2026-05-25$149,995 Active
ⓘ Source: listings_history table (triggers on properties + properties_extension) + one-shot
backfill from property_details.listing_events for pre-trigger history.
Climate risk First Street
- Flood 1/10 Low FEMA zone X (unshaded) · 0% chance over 30 yrs
- Wildfire 1/10 Low
- Heat 3/10 Moderate 7 d/yr ≥92°F today · 14 d/yr by 30 yrs out
- Wind 1/10 Low
- Air quality 10/10 Extreme 13 unhealthy d/yr today · 14 by 30 yrs out
Nearby sold comps map
Loading sold comps map…
Walkable amenities ~0.75 mi
Loading nearby amenities…
Taxation est. · year 1
- Rental income
- $21,757
- − Mortgage interest
- −$8,402
- − Property taxes
- −$2,250
- − Insurance
- −$750
- − Repairs & maintenance
- −$1,741
- − Management
- −$1,741
- − Depreciation
- −$4,363
- Taxable income
- $2,510
- Est. tax owed @ 24.0%
- −$602
- After-tax cash flow
- $4,147/yr
For passive investors: Depreciation is non-cash, so a rental often shows a tax loss while cash-flowing — sheltering income. Rental losses are passive: they offset passive income freely, and up to $25,000/yr can offset ordinary (W-2) income if you actively participate and your MAGI is under $100k (phasing out to $0 by $150k); unused losses carry forward. On sale, claimed depreciation is recaptured at up to 25%, and gains may owe capital-gains tax (a 1031 exchange can defer both). Figures are a year-1 estimate at your 24.0% rate — not tax advice; consult a CPA.
Condition & rehab AI · 16 photos
This move-in ready, fully remodeled 3-bedroom, 2-bath manufactured home features modern upgrades and a luxurious feel, making it an excellent investment for both resale and rental.
Value-add opportunities
- Both Painting exterior and interior walls — Enhances curb appeal and interior aesthetics
- Both Landscaping and adding plants — Improves curb appeal and adds greenery
- Both Adding outdoor lighting — Enhances safety and curb appeal
- Resale Upgrading appliances — Modernizes kitchen and appeals to buyers
- Both Adding smart home features — Enhances convenience and adds value
Renovation cost estimate screening
Value-add ROI direction
- Both Painting exterior and interior walls — Enhances curb appeal and interior aesthetics ↑
- Both Landscaping and adding plants — Improves curb appeal and adds greenery ↑
- Both Adding outdoor lighting — Enhances safety and curb appeal ↑
- Resale Upgrading appliances — Modernizes kitchen and appeals to buyers ↑
- Both Adding smart home features — Enhances convenience and adds value ↑
ⓘ Cost ranges are severity-bucket heuristics (US national rule-of-thumb). Get contractor quotes + a written scope before underwriting a rehab budget.
Schools (NCES district)
- District
- Salem-Keizer SD 24J
- NCES district ID
- 4110820
- Math proficiency
- 34% ▼ -1.00%
- Reading proficiency
- 47% ▼ -2.00%
- Median HH income
- $48,632
- Composite
- 37.16/100
- National rank
- #9017
- State rank
- #103 of 183 in OR
Livability — Salem
- Score
- 79/100
- State rank
- #59
- US rank
- #2084
Category grades
Schools grade is shown separately in the Schools card above.
Census & demographics
- Census place
- Salem, OR
Population outlook (Marion County) Hauer SSP2
- Today (2025)
- 360,940 people
- By 2030
- 375,178 · +3.9%
- By 2040
- 400,914 · +11.1%
- By 2050
- 422,187 · +17.0%
- By 2075
- 460,305 · +27.5%
- By 2100
- 464,025 · +28.6%
Not yet ingested
- Political lean
- —
- Race & ethnicity
- —
- Common origin
- —
- Civics
- —
Market trends
- HPI YoY
- —
- Current HPI
- —
- Rent YoY
- —
- Metro
- —
- State GDP YoY
- ▲ 2.05%
- F500 in state
- 2
Industry mix (Fortune 500 HQ in OR)
| Industry | F500 HQs | Revenue |
|---|---|---|
| Consumer Goods | 1 | $51B |
|
||
Price history
1 event — show timeline
- 2026-05-25 Listed $149,995 WVMLS
Cash-flow waterfall
monthlySold comps — $/sqft
last 12 mo · ≤1 miLoading sold comps…