5089 N Tanglewood Ave · Hernando, FL
Flood risk 1/10 · Minimal
- FEMA flood zone
- X (unshaded)
- Chance of flooding over 30 yrs
- 0.0%
- Est. flood insurance / yr
- $507 – $1,088
Fire risk 4/10 · Minor
- Est. fire insurance / yr
- $947 – $1,759
Heat risk 9/10 · Severe
- Hot days now (above 108°F)
- 7 days/yr
- Hot days in 30 yrs
- 23 days/yr
Wind risk 9/10 · Severe
- Chance of severe wind over 30 yrs
- 99.0%
Air-quality risk 1/10 · Minimal
- Unhealthy air days now
- 0 days/yr
- Unhealthy air days in 30 yrs
- 0 days/yr
Risk factors via First Street. Map © Google.
Why this score? — see what drove the D+ grade
The composite is a weighted blend of 9 inputs, each scored 0–100. Each bar is that input's sub-score; the figure is the points it added to the 100-point composite (weight × sub-score).
- Cash flow +16.3/30.0
- ARV discount +7.5/15.0
- DSCR +5.0/10.0
- 1% rule +4.4/10.0
- Schools +4.1/10.0
- Livability +3.6/5.0
- Rent growth +2.5/5.0
- Condition / age +2.5/5.0
- Appreciation +0.0/10.0
$235,000
🖨 Deal sheet 📄 Offer letter ✓ Due diligence
Listing remarks MLS
Opportunity to own nearly half the block on Tanglewood Ave. ! Property offers six lots all with separate Alt keys, all over one acre, possibility to forgo higher priced septic installation. Zoned for mobile homes as well as site built. Land is high and dry not in flood zone, no H. O. A. s. Central location north to Ocala and south to Inverness via State Road 200. Lots 81-84 on east side front Carl G. Rose Hwy. (SR 200).
Key facts
- Close to schools
- Surrounded by nature
- Spacious lot
Tags
Property features AI
Finance
- Other: Lot size about 1.17 acres (1 to less than 2 acres)
- HOA & community: No HOA / association
Exterior
- Parking: No parking details provided
- Utilities: Well water; Septic tank; Electricity connected
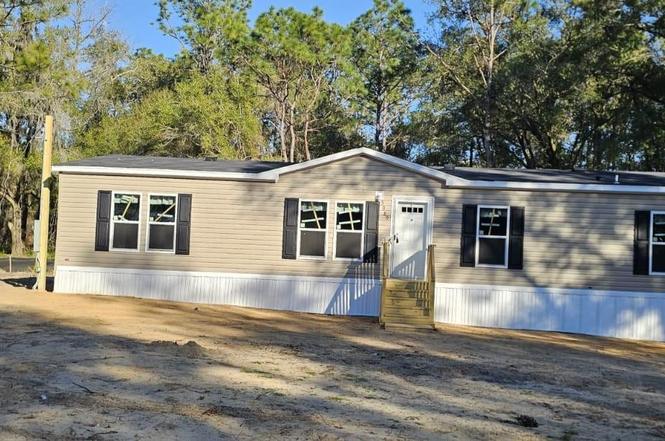
- Home design: Manufactured home (double wide); One story; Faces west; New construction; Completed condition; Residential property
- Construction: Vinyl siding exterior; Shingle roof; Crawlspace foundation; Built by JT Mobile Installation LLC (model: Spark)
- Exterior features: Paved road access; Lot dimensions approximately 166 x 307
Interior
- Kitchen: Dishwasher; Range; Refrigerator
- Bedrooms: 4 bedrooms
- Flooring: Vinyl flooring
- Bathrooms: 2 full bathrooms
- Heating & cooling: Central heating; Central air conditioning
- Interior features: Open floorplan
- Laundry & utility: Laundry inside
Neighborhood map
What this means for you Summary
Snapshot
- This is a 4-bed/2.0-bath land listed at $235k.
Deal economics
- At list price, monthly cash flow is $128 ($2k/yr) — positive.
- The deal already cash-flows at list — no discount required.
- To meet the 1% rule (rent ≥ 1% of price), the offer needs to be $222k (5.6% below list).
- Recommended offer: $207k (12.0% below list) — sets the bar for market timing.
- Cap rate 6.9% vs local median 5.6% in Hernando — meaningfully above typical; check what's discounted (condition, days-on-market, listing class) to confirm the premium yield is real.
Location & tenants
- Location reads 71/100 on livability (#402 in FL) — a middle-class / working-renter tenant base. Strengths: cost of living A+, housing A+, health & safety A+; Watch: amenities F, commute F, employment D-.
- Citrus (rural): math 49% / reading 50% proficiency, ranked #44 of 73 in FL (top 60%) — families likely to look elsewhere, expect single-tenant / working-renter base with shorter leases.
- Market conditions: 444 active listings in the ZIP; 1 comparable units currently listed for rent nearby; 2,443 units permitted in Citrus County in 2024 (0 in 5+ unit buildings).
- At $2,218/mo this rent would consume 46% of the median local household income ($57k/yr) (locally 314% of renters already pay >50% of income on rent) — very limited rent-growth headroom before tenants either downsize or default.
Forward outlook
- Local home prices are declining (-3.0%/yr); year-one equity from $2k of loan paydown is wiped out by about $7k of value loss. Plan a longer hold.
- Citrus County population projected to shrink 10% by 2050 — rents likely to lag national; underwrite the cash flow, not the appreciation.
Negotiation context
- It's been on market 132 days — a 12% lower offer ($207k) is reasonable based on typical stale-listing flexibility.
- 3 sale attempts with the ask held roughly flat each time — persistent listings suggest the price (not the market) is what's stuck; bring a comps-based counter.
- Current owner paid $150k; list at $235k implies a 57% gain — meaningful room to come down on a strong offer.
Risks & watch-outs
- Climate carrying-cost: severe wind risk, 99% chance of damaging wind over 30y; extreme-heat days projected 7→23/yr by 2055 (HVAC capex compounding) — expect insurance premiums to compound above CPI over the hold.
Questions for the listing agent
- It's been on market 132 days. Have you received any prior offers? Is the seller open to a 12% concession, seller financing, or rate buy-down credit?
- Why hasn't it sold? Are there any deal-killer items the seller is aware of (foundation, flood, title, zoning, code violations)?
- Is there a deadline driving the sale (1031 exchange, divorce, estate, relocation)? That informs how much negotiation room exists.
- The area grade is low — what's the realistic commute time and amenity access for the typical tenant pool here? Any planned neighborhood developments (good or bad) we should know about?
- What's the average days-on-market for RENTAL listings here right now (not sales)? A rising rental-DOM trend means longer vacancies and softer asking-rent achievability than the comps imply.
- What's the recent tenant-quality profile in this submarket — average credit score on applications, eviction rate, late-payment / NSF rate, and stable-employment percentage? A property-management company in the area should have these aggregated.
- How much new for-sale + rental construction is in the pipeline within 1–3 miles? Heavy new supply typically softens prices + rents 12–24 months out; constrained supply supports both.
Investment metrics
- 1% rule
- 0.94% ✗
- Cap rate
- 6.95%
- Cash-on-cash
- 2.33%
- DSCR
- 1.10
- GRM
- 8.8
CMA / ARV
No comps found within radius.
Projected returns pro-forma
-3.0% appreciation · 3.0% rent growth · sell at horizon
- IRR
- -12.6%
- Equity multiple
- 0.55×
- Total profit
- $-29,898
- Equity at exit
- $35,039
- IRR
- -3.5%
- Equity multiple
- 0.77×
- Total profit
- $-15,407
- Equity at exit
- $20,319
Cash invested: $65,800 (down + closing). Projections, not guarantees.
Landlord ↔ Tenant lean methodology
- Overall (STATE)
- 87 Strongly Landlord-Friendly
- State Florida
- 87 Strongly Landlord-Friendly · R+3
- County
- — inherits STATE
- City
- — inherits STATE
ZIP-level market 34442
- Home prices YoY
- -21.9%
- Active inventory
- 444
- Price-to-rent
- 8.8×
Monthly cashflow live
- Estimated rent
- $2,218 medium interval (Pro) →
- Mortgage (P&I)
- −$1,232
- Tax est. 1.5%
- −$294 /mo · $3,525/yr
- Insurance
- −$98
- HOA
- −$0
- Vacancy / Maint / Mgmt
- −$466
- Net cashflow
- $128
Break-even live
UW: 25.0% down · 7.5% · 30yr · 1.5% tax · 5.0% vac · 8.0% maint · 8.0% mgmt
Financing live
Cash to close
- Down payment
- $58,750
- Closing costs
- $7,050
- Reserves months
- —
- Total cash needed
- —
Loan-product check · same deal, 3 products live
Conventional
25% down · 7.5% · 30yr
- Down + closing
- —
- Monthly P&I
- —
- Monthly cashflow
- —
- DSCR
- —
- Eligible?
- —
Personal DTI + credit; lowest rate.
DSCR
20% down · 8.5% · 30yr
- Down + closing
- —
- Monthly P&I
- —
- Monthly cashflow
- —
- DSCR
- —
- Eligible?
- —
No personal income docs; deal must DSCR.
Hard money
10% down · 12.0% · 12mo
- Down + closing
- —
- Monthly P&I
- —
- Monthly cashflow
- —
- DSCR
- —
- Eligible?
- —
Short-term bridge; refi at stabilization.
Rent comps 1 comps
| Address | Beds | Baths | Sqft | Rent | $/sqft | DOM | Units | Dist |
|---|---|---|---|---|---|---|---|---|
| 6128 N Bayfront Dr Hernando, FL | 3.0 | 2.0 | 1771 | $2,250 | $1.27 | 21d | 1 | 1.34mi |
Listing history 19 events
-
2026-06-13remarks 699-char remark
-
2026-06-13statusdays on market $235,000 Pending 132 DOM
-
2026-06-09days on market $235,000 Active 130 DOM
-
2026-06-08days on market $235,000 Active 129 DOM
-
2026-06-03days on market $235,000 Active 124 DOM
-
2026-06-02days on market $235,000 Active 123 DOM
-
2026-06-01days on market $235,000 Active 122 DOM
-
2026-05-31days on market $235,000 Active 121 DOM
-
2026-05-30days on market $235,000 Active 120 DOM
-
2026-01-30$235,000 Active
-
2025-07-08soldstatus $150,000 Closed 423-char remark
Show marketing remark (427 chars)
Opportunity to own nearly half the block on Tanglewood Ave. ! Property offers six lots all with separate Alt keys, all over one acre, possibility to forgo higher priced septic installation. Zoned for mobile homes as well as site built. Land is high and dry not in a flood zone, no H. O. A. s. Central location north to Ocala and South to Inverness via State Road 200. Lots 81-84 on east side front Carl G. Rose Hwy. (S. R. 200)
-
2025-07-08soldstatus $150,000 Closed 427-char remark
Show marketing remark (427 chars)
Opportunity to own nearly half the block on Tanglewood Ave. ! Property offers six lots all with separate Alt keys, all over one acre, possibility to forgo higher priced septic installation. Zoned for mobile homes as well as site built. Land is high and dry not in a flood zone, no H. O. A. s. Central location north to Ocala and South to Inverness via State Road 200. Lots 81-84 on east side front Carl G. Rose Hwy. (S. R. 200)
-
2025-07-08soldstatus $150,000
Show marketing remark (427 chars)
Opportunity to own nearly half the block on Tanglewood Ave. ! Property offers six lots all with separate Alt keys, all over one acre, possibility to forgo higher priced septic installation. Zoned for mobile homes as well as site built. Land is high and dry not in a flood zone, no H. O. A. s. Central location north to Ocala and South to Inverness via State Road 200. Lots 81-84 on east side front Carl G. Rose Hwy. (S. R. 200)
-
2025-06-24status Pending 427-char remark
Show marketing remark (423 chars)
Opportunity to own nearly half the block on Tanglewood Ave. ! Property offers six lots all with separate Alt keys, all over one acre, possibility to forgo higher priced septic installation. Zoned for mobile homes as well as site built. Land is high and dry not in flood zone, no H. O. A. s. Central location north to Ocala and south to Inverness via State Road 200. Lots 81-84 on east side front Carl G. Rose Hwy. (SR 200).
-
2025-06-24status Pending 423-char remark
Show marketing remark (423 chars)
Opportunity to own nearly half the block on Tanglewood Ave. ! Property offers six lots all with separate Alt keys, all over one acre, possibility to forgo higher priced septic installation. Zoned for mobile homes as well as site built. Land is high and dry not in flood zone, no H. O. A. s. Central location north to Ocala and south to Inverness via State Road 200. Lots 81-84 on east side front Carl G. Rose Hwy. (SR 200).
-
2025-05-10$199,000 Active 423-char remark
Show marketing remark (427 chars)
Opportunity to own nearly half the block on Tanglewood Ave. ! Property offers six lots all with separate Alt keys, all over one acre, possibility to forgo higher priced septic installation. Zoned for mobile homes as well as site built. Land is high and dry not in a flood zone, no H. O. A. s. Central location north to Ocala and South to Inverness via State Road 200. Lots 81-84 on east side front Carl G. Rose Hwy. (S. R. 200)
-
2025-05-10$199,000 Active 427-char remark
Show marketing remark (427 chars)
Opportunity to own nearly half the block on Tanglewood Ave. ! Property offers six lots all with separate Alt keys, all over one acre, possibility to forgo higher priced septic installation. Zoned for mobile homes as well as site built. Land is high and dry not in a flood zone, no H. O. A. s. Central location north to Ocala and South to Inverness via State Road 200. Lots 81-84 on east side front Carl G. Rose Hwy. (S. R. 200)
-
2017-08-29soldstatus $24,900
-
1981-09-01soldstatus $2,889
ⓘ Source: listings_history table (triggers on properties + properties_extension) + one-shot
backfill from property_details.listing_events for pre-trigger history.
Climate risk First Street
- Flood 1/10 Low FEMA zone X (unshaded) · 0% chance over 30 yrs
- Wildfire 4/10 Moderate
- Heat 9/10 Extreme 7 d/yr ≥108°F today · 23 d/yr by 30 yrs out
- Wind 9/10 Extreme 99% chance of damaging wind over 30 yrs
- Air quality 1/10 Low 0 unhealthy d/yr today · 0 by 30 yrs out
Nearby sold comps map
Loading sold comps map…
Walkable amenities ~0.75 mi
Loading nearby amenities…
Taxation est. · year 1
- Rental income
- $26,612
- − Mortgage interest
- −$13,164
- − Property taxes
- −$3,525
- − Insurance
- −$1,175
- − Repairs & maintenance
- −$2,129
- − Management
- −$2,129
- − Depreciation
- −$6,836
- Taxable loss
- −$2,346
- Est. tax savings @ 24.0%
- +$563
- After-tax cash flow
- $2,098/yr
For passive investors: Depreciation is non-cash, so a rental often shows a tax loss while cash-flowing — sheltering income. Rental losses are passive: they offset passive income freely, and up to $25,000/yr can offset ordinary (W-2) income if you actively participate and your MAGI is under $100k (phasing out to $0 by $150k); unused losses carry forward. On sale, claimed depreciation is recaptured at up to 25%, and gains may owe capital-gains tax (a 1031 exchange can defer both). Figures are a year-1 estimate at your 24.0% rate — not tax advice; consult a CPA.
Schools (NCES district)
- District
- Citrus
- NCES district ID
- 1200270
- Math proficiency
- 49% ▼ -10.00%
- Reading proficiency
- 50% ▼ -6.00%
- Median HH income
- $38,618
- Composite
- 41.28/100
- National rank
- #3519
- State rank
- #44 of 73 in FL
Livability — Hernando
- Score
- 71/100
- State rank
- #402
- US rank
- #7137
Category grades
Schools grade is shown separately in the Schools card above.
Census & demographics
- Census place
- Hernando, FL
- County
- Citrus County · 111,314 people
- City population
- 17,281
- Metro
- Homosassa Springs, FL
- Population (ZIP)
- 17,281
- Household income
- $57,259
- Rent vs Own
- Severe rent burden
- 314.0
Population outlook (Citrus County) Hauer SSP2
- Today (2025)
- 138,622 people
- By 2030
- 136,886 · -1.3%
- By 2040
- 132,009 · -4.8%
- By 2050
- 125,196 · -9.7%
- By 2075
- 108,570 · -21.7%
- By 2100
- 84,454 · -39.1%
Race, ethnicity, and origin ACS 2023
- Neighborhood character
- Predominantly White (90%)
- Race & ethnicity
- White 90% Hispanic / Latino 4% Two or more races 3% Asian 2% Black 2%
- Common ancestry
- Romanian 4% Slovak 4% Lithuanian 3%
- Foreign-born
- 8% · Canada, China, South Korea
- Languages at home
- 93% English-only · Spanish 3% German/W. Germanic 2% Tagalog/Filipino 1%
Political lean MEDSL · Citrus
- 2024 margin
- Solid R (+45.9) · D 26.8% · R 72.6%
- 2008→2024 swing
- -29.8pp toward R · 2008: -16.1pp · 2024: -45.9pp
- All cycles
- 2024: R+45.9 2020: R+41.0 2016: R+39.7 2012: R+21.9 2008: R+16.1
Not yet ingested
- Civics
- —
Market trends
- HPI YoY
- ▼ -76.70%
- Current HPI
- 273.3262
- Rent YoY
- —
- Metro
- Homosassa Springs, FL
- State GDP YoY
- ▲ 3.28%
- F500 in state
- 36
Industry mix (Fortune 500 HQ in FL)
| Industry | F500 HQs | Revenue |
|---|---|---|
| Industrial Technology | 2 | $29B |
|
||
| Insurance | 2 | $17B |
|
||
| Retail | 1 | $60B |
|
||
| Technology Distribution | 1 | $58B |
|
||
| Homebuilding | 1 | $35B |
|
||
| Technology Manufacturing | 1 | $35B |
|
||
Price history
+8034.3% since first listed10 events — show timeline
- 2026-01-30 Listed $235,000 Stellar MLS as Distributed by MLS Grid
- 2025-07-08 Sold (Public Records) $150,000 Public Records
- 2025-07-08 Sold (MLS) $150,000 Stellar MLS as Distributed by MLS Grid
- 2025-07-08 Sold (MLS) $150,000 RACC
- 2025-06-24 Pending — Stellar MLS as Distributed by MLS Grid
- 2025-06-24 Pending — RACC
- 2025-05-10 Listed $199,000 Stellar MLS as Distributed by MLS Grid
- 2025-05-10 Listed $199,000 RACC
- 2017-08-29 Sold (Public Records) $24,900 Public Records
- 1981-09-01 Sold (Public Records) $2,889 Public Records
Property tax history
+2.8%/yrLatest (2025): $286 · +13.4% YoY. Source: county tax records.
Cash-flow waterfall
monthlySold comps — $/sqft
last 12 mo · ≤1 miLoading sold comps…