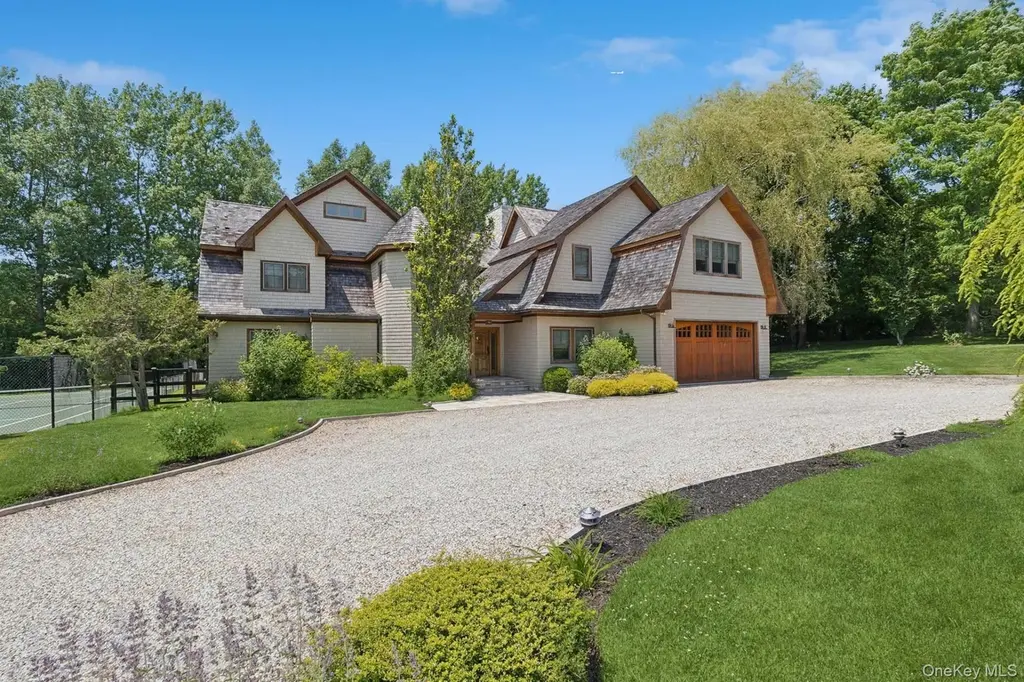
1366 Scuttle Hole Rd · Bridgehampton, NY
Flood risk 1/10 · Minimal
- FEMA flood zone
- X (unshaded)
- Chance of flooding over 30 yrs
- 0.0%
- Est. flood insurance / yr
- $473 – $860
Fire risk 3/10 · Minor
- Est. fire insurance / yr
- $691 – $1,283
Heat risk 5/10 · Moderate
- Hot days now (above 90°F)
- 7 days/yr
- Hot days in 30 yrs
- 19 days/yr
Wind risk 8/10 · Major
- Chance of severe wind over 30 yrs
- 80.0%
Air-quality risk 3/10 · Minor
- Unhealthy air days now
- 2 days/yr
- Unhealthy air days in 30 yrs
- 3 days/yr
Risk factors via First Street. Map © Google.
Why this score? — see what drove the B- grade
The composite is a weighted blend of 9 inputs, each scored 0–100. Each bar is that input's sub-score; the figure is the points it added to the 100-point composite (weight × sub-score).
- Cash flow +26.0/30.0
- Appreciation +9.3/10.0
- DSCR +8.8/10.0
- 1% rule +5.6/10.0
- Rent growth +5.0/5.0
- ARV discount +4.4/15.0
- Schools +4.3/10.0
- Livability +3.1/5.0
- Condition / age +2.5/5.0
$5,495,000
🖨 Deal sheet (PDF) 📄 Offer letter ✓ Due diligence
Listing remarks MLS
Bridgehampton Gambrel with Private Pickel & Padel Court The Ultimate Hamptons Lifestyle. This beautifully landscaped Gambrel sits on a private 1+/- acre lot, offering 5,000+/- sq. ft. of luxury living space and a brand-new private Piakcel/Padel court. The home features a dramatic double-height living room, a gourmet chef's kitchen, and five spacious bedrooms, including a grand upstairs master suite and two convenient first-floor guest rooms. Outdoor Paradise. Designed for resort-style living, the grounds feature a pristine pool, an expansive entertaining deck, and professional-grade Padel facilities-all framed by lush, mature landscaping for ultimate privacy. Unbeatable Location. Ideally situated just minutes from the vibrant villages of Bridgehampton, Southampton, and Sag Harbor, and within easy reach of world-renowned ocean beaches.
Key facts
- Pristine pool
- Unbeatable location
- 100 acre lot
Tags
Neighborhood map
What this means for you Summary
Snapshot
- This is a 5-bed/2.0-bath single-family listed at $5.50M.
Deal economics
- At list price, monthly cash flow is $14k ($165k/yr) — positive.
- The deal already cash-flows at list — no discount required.
- Meets the 1% rule at list price ($58k rent vs $5.50M).
- Recommended offer: $4.84M (12.0% below list) — sets the bar for market timing.
Location & tenants
- Location reads 62/100 on livability (#874 in NY) — a middle-class / working-renter tenant base. Strengths: crime A+, employment A+, schools B; Watch: amenities F, commute F, cost of living F.
- Bridgehampton Union Free School District (rural): math 50% / reading 40% proficiency, ranked #511 of 755 in NY (top 68%) — families likely to look elsewhere, expect single-tenant / working-renter base with shorter leases.
- Market conditions: Rents rising fast (+30.1%/yr); 52 active listings in the ZIP; 2 comparable units currently listed for rent nearby; high-income renter base; 1,366 units permitted in Suffolk County in 2024 (216 in 5+ unit buildings).
- At $58,128/mo this rent would consume 387% of the median local household income ($180k/yr) — very limited rent-growth headroom before tenants either downsize or default.
Forward outlook
- In year one you build about $512k of equity ($38k loan paydown + $474k appreciation (8.6% local appreciation)).
- Suffolk County population projected to shrink 5% by 2050 — rents likely to lag national; underwrite the cash flow, not the appreciation.
- At projected returns (8.6% appreciation + 8.0% rent growth), your $1.54M cash investment doubles in ~3 years — after that, you're playing with house money.
- By year 2, paydown + projected appreciation supports a ~$821k cash-out refi (75% LTV) — recoverable capital for the next deal without selling this one.
Negotiation context
- It's been on market 129 days — a 12% lower offer ($4.84M) is reasonable based on typical stale-listing flexibility.
- 5 sale attempts since 14y ago with the ask held roughly flat each time — persistent listings suggest the price (not the market) is what's stuck; bring a comps-based counter.
- Current owner paid $450k; list at $5.50M implies a 1121% gain — meaningful room to come down on a strong offer.
Risks & watch-outs
- Climate carrying-cost: severe wind risk, 80% chance of damaging wind over 30y; extreme-heat days projected 7→19/yr by 2055 (HVAC capex compounding) — expect insurance premiums to compound above CPI over the hold.
Questions for the listing agent
- It's been on market 129 days. Have you received any prior offers? Is the seller open to a 12% concession, seller financing, or rate buy-down credit?
- Why hasn't it sold? Are there any deal-killer items the seller is aware of (foundation, flood, title, zoning, code violations)?
- Is there a deadline driving the sale (1031 exchange, divorce, estate, relocation)? That informs how much negotiation room exists.
- Schools are B-rated — typically a magnet for longer-tenancy family renters. What's the average tenant stay here, and is there a school-zone premium baked into asking?
- What's the average days-on-market for RENTAL listings here right now (not sales)? A rising rental-DOM trend means longer vacancies and softer asking-rent achievability than the comps imply.
- What's the recent tenant-quality profile in this submarket — average credit score on applications, eviction rate, late-payment / NSF rate, and stable-employment percentage? A property-management company in the area should have these aggregated.
- How much new for-sale + rental construction is in the pipeline within 1–3 miles? Heavy new supply typically softens prices + rents 12–24 months out; constrained supply supports both.
Investment metrics
- 1% rule
- 1.06% ✓
- Cap rate
- 9.29%
- Cash-on-cash
- 10.70%
- DSCR
- 1.48
- GRM
- 7.9
CMA / ARV
- ARV (median comp)
- $5,137,955
- List price
- $5,495,000
- Delta
- 6.95%
- Verdict
- FAIR
- Comps
- 7 within 2.0 mi
Projected returns pro-forma
8.63% appreciation · 8.0% rent growth · sell at horizon
- IRR
- 31.6%
- Equity multiple
- 3.38×
- Total profit
- $3,665,464
- Equity at exit
- $4,412,791
- IRR
- 29.6%
- Equity multiple
- 8.00×
- Total profit
- $10,772,870
- Equity at exit
- $8,996,731
Cash invested: $1,538,600 (down + closing). Projections, not guarantees.
Landlord ↔ Tenant lean methodology
- Overall (STATE)
- 15 Strongly Tenant-Friendly
- State New York
- 15 Strongly Tenant-Friendly · D+10
- County
- — inherits STATE
- City
- — inherits STATE
ZIP-level market 11976
- Home prices YoY
- 1.6%
- Rents YoY
- 30.1%
- Active inventory
- 52
- Price-to-rent
- 7.9×
Monthly cashflow live
- Estimated rent
- $58,128 medium interval (Pro) →
- Mortgage (P&I)
- −$28,816
- Tax from tax record
- −$1,100 /mo · $13,205/yr
- Insurance
- −$2,290
- HOA
- −$0
- Vacancy / Maint / Mgmt
- −$12,207
- Net cashflow
- $13,715
Break-even live
Sensitivity live
| Price | -10% $16,825 | -5% $15,270 | +0% $13,715 | +5% $12,160 | +10% $10,604 |
|---|---|---|---|---|---|
| Rent | -10% $9,123 | -5% $11,419 | +0% $13,715 | +5% $16,011 | +10% $18,307 |
| Rate | -1.0pp $16,482 | -0.5pp $15,112 | base $13,715 | +0.5pp $12,291 | +1.0pp $10,842 |
UW: 25.0% down · 7.5% · 30yr · 1.5% tax · 5.0% vac · 8.0% maint · 8.0% mgmt
Financing live
Cash to close
- Down payment
- $1,373,750
- Closing costs
- $164,850
- Reserves months
- —
- Total cash needed
- —
Loan-product check · same deal, 3 products live
Conventional
25% down · 7.5% · 30yr
- Down + closing
- —
- Monthly P&I
- —
- Monthly cashflow
- —
- DSCR
- —
- Eligible?
- —
Personal DTI + credit; lowest rate.
DSCR
20% down · 8.5% · 30yr
- Down + closing
- —
- Monthly P&I
- —
- Monthly cashflow
- —
- DSCR
- —
- Eligible?
- —
No personal income docs; deal must DSCR.
Hard money
10% down · 12.0% · 12mo
- Down + closing
- —
- Monthly P&I
- —
- Monthly cashflow
- —
- DSCR
- —
- Eligible?
- —
Short-term bridge; refi at stabilization.
Rent comps 2 comps
| Address | Beds | Baths | Sqft | Rent | $/sqft | DOM | Units | Dist |
|---|---|---|---|---|---|---|---|---|
| 491 Butter Ln Bridgehampton, NY | 5.0 | 5.0 | 4800 | $30,000 | $6.25 | 45d | 1 | 0.81mi |
| 189 Lumber Ln Bridgehampton, NY | 5.0 | 3.5 | 3200 | $50,000 | $15.62 | 26d | 1 | 1.47mi |
Listing history 31 events
-
2026-06-21days on market $5,495,000 Active 129 DOM
-
2026-06-18days on market $5,495,000 Active 126 DOM
-
2026-06-17days on market $5,495,000 Active 125 DOM
-
2026-06-16days on market $5,495,000 Active 124 DOM
-
2026-06-15days on market $5,495,000 Active 123 DOM
-
2026-06-13days on market $5,495,000 Active 121 DOM
-
2026-06-09days on market $5,495,000 Active 117 DOM
-
2026-06-08days on market $5,495,000 Active 116 DOM
-
2026-06-07days on market $5,495,000 Active 115 DOM
-
2026-06-04days on market $5,495,000 Active 112 DOM
-
2026-06-03days on market $5,495,000 Active 111 DOM
-
2026-06-02days on market $5,495,000 Active 110 DOM
-
2026-06-01days on market $5,495,000 Active 109 DOM
-
2026-05-31days on market $5,495,000 Active 108 DOM
-
2026-02-12$5,495,000 Active 850-char remark
Show marketing remark (850 chars)
Bridgehampton Gambrel with Private Pickel & Padel Court The Ultimate Hamptons Lifestyle. This beautifully landscaped Gambrel sits on a private 1+/- acre lot, offering 5,000+/- sq. ft. of luxury living space and a brand-new private Piakcel/Padel court. The home features a dramatic double-height living room, a gourmet chef's kitchen, and five spacious bedrooms, including a grand upstairs master suite and two convenient first-floor guest rooms. Outdoor Paradise. Designed for resort-style living, the grounds feature a pristine pool, an expansive entertaining deck, and professional-grade Padel facilities-all framed by lush, mature landscaping for ultimate privacy. Unbeatable Location. Ideally situated just minutes from the vibrant villages of Bridgehampton, Southampton, and Sag Harbor, and within easy reach of world-renowned ocean beaches.
-
2024-12-22historical
-
2024-12-07status Active
-
2024-12-06historical
-
2024-09-10price $4,999,950
-
2024-09-05status Active
-
2024-09-01historical
-
2024-08-23price $5,195,000
-
2024-07-09price $5,295,000
-
2024-06-19$5,495,000 Active
-
2012-11-15historical
-
2012-03-15$1,595,000
-
2002-05-08soldstatus $450,000
-
2002-05-08soldstatus $450,000
-
1997-01-24soldstatus $237,000
-
1988-05-31soldstatus $255,000
-
1986-12-31soldstatus $70,000
ⓘ Source: listings_history table (triggers on properties + properties_extension) + one-shot
backfill from property_details.listing_events for pre-trigger history.
Tax reassessment forecast NY · Partial reset (capped growth)
- Current annual tax
- $13,205 · $1,100/mo
- Projected year-2 tax
- $53,035 · $4,420/mo
- Expected delta
- +$39,830/yr (+$3,319/mo · 301.6%)
ⓘ Screening estimate from a state-policy table — verify with the county assessor before closing.
Climate risk First Street
- Flood 1/10 Low FEMA zone X (unshaded) · 0% chance over 30 yrs
- Wildfire 3/10 Moderate
- Heat 5/10 Major 7 d/yr ≥90°F today · 19 d/yr by 30 yrs out
- Wind 8/10 Severe 80% chance of damaging wind over 30 yrs
- Air quality 3/10 Moderate 2 unhealthy d/yr today · 3 by 30 yrs out
Nearby sold comps map
Loading sold comps map…
Walkable amenities ~0.75 mi
Loading nearby amenities…
Taxation est. · year 1
- Rental income
- $697,537
- − Mortgage interest
- −$307,805
- − Property taxes
- −$13,205
- − Insurance
- −$27,475
- − Repairs & maintenance
- −$55,803
- − Management
- −$55,803
- − Depreciation
- −$159,855
- Taxable income
- $77,591
- Est. tax owed @ 24.0%
- −$18,622
- After-tax cash flow
- $145,956/yr
For passive investors: Depreciation is non-cash, so a rental often shows a tax loss while cash-flowing — sheltering income. Rental losses are passive: they offset passive income freely, and up to $25,000/yr can offset ordinary (W-2) income if you actively participate and your MAGI is under $100k (phasing out to $0 by $150k); unused losses carry forward. On sale, claimed depreciation is recaptured at up to 25%, and gains may owe capital-gains tax (a 1031 exchange can defer both). Figures are a year-1 estimate at your 24.0% rate — not tax advice; consult a CPA.
Schools (NCES district)
- District
- Bridgehampton Union Free School District
- NCES district ID
- 3605370
- Math proficiency
- 50% ▼ -10.00%
- Reading proficiency
- 40% ▼ -10.00%
- Median HH income
- $69,915
- Composite
- 42.79/100
- National rank
- #6761
- State rank
- #511 of 755 in NY
Livability — Bridgehampton
- Score
- 62/100
- State rank
- #874
- US rank
- #16891
Category grades
Schools grade is shown separately in the Schools card above.
Census & demographics
- Census place
- Bridgehampton, NY
- County
- Suffolk County · 679,920 people
- City population
- 725
- Metro
- New York-Newark-Jersey City, NY-NJ-PA
- Population (ZIP)
- 2,952
- Household income
- $180,250
- Rent vs Own
Population outlook (Suffolk County) Hauer SSP2
- Today (2025)
- 1,505,262 people
- By 2030
- 1,498,318 · -0.5%
- By 2040
- 1,471,101 · -2.3%
- By 2050
- 1,424,848 · -5.3%
- By 2075
- 1,337,157 · -11.2%
- By 2100
- 1,217,720 · -19.1%
Race, ethnicity, and origin ACS 2023
- Neighborhood character
- Predominantly White (87%)
- Race & ethnicity
- White 87% Hispanic / Latino 9% Two or more races 9% Asian 2%
- Hispanic origin (detail)
- Mexican 1% Salvadoran 2%
- Common ancestry
- Romanian 16% Scotch-Irish 7% Italian 3%
- Foreign-born
- 11% · Canada, China
- Languages at home
- 86% English-only · Spanish 7% Other Indo-European 4% German/W. Germanic 1%
Political lean MEDSL · Suffolk
- 2024 margin
- Lean R (+10.0) · D 45.0% · R 55.0%
- 2008→2024 swing
- -16.0pp toward R · 2008: 6.0pp · 2024: -10.0pp
- All cycles
- 2024: R+10.0 2020: R+0.0 2016: R+8.2 2012: D+2.9 2008: D+6.0
Not yet ingested
- Civics
- —
Market trends
- HPI YoY
- ▲ 8.63%
- Current HPI
- 540.0967
- Rent YoY
- ▲ 30.05%
- Metro
- New York-Newark-Jersey City, NY-NJ-PA
- State GDP YoY
- ▲ 2.60%
- F500 in state
- 92
Industry mix (Fortune 500 HQ in NY)
| Industry | F500 HQs | Revenue |
|---|---|---|
| Financial Services | 10 | $950B |
|
||
| Consumer Goods | 9 | $162B |
|
||
| Insurance | 4 | $225B |
|
||
| Telecommunications | 2 | $144B |
|
||
| Pharmaceuticals | 2 | $112B |
|
||
| Media / Entertainment | 2 | $69B |
|
||
Price history
+7750.0% since first listed17 events — show timeline
- 2026-02-12 Listed $5,495,000 OneKey® MLS as Distributed by MLS Grid
- 2024-12-22 Listing Removed — OneKey® MLS as Distributed by MLS Grid
- 2024-12-07 Relisted — OneKey® MLS as Distributed by MLS Grid
- 2024-12-06 Listing Removed — OneKey® MLS as Distributed by MLS Grid
- 2024-09-10 Price Changed $4,999,950 OneKey® MLS as Distributed by MLS Grid
- 2024-09-05 Relisted — OneKey® MLS as Distributed by MLS Grid
- 2024-09-01 Listing Removed — OneKey® MLS as Distributed by MLS Grid
- 2024-08-23 Price Changed $5,195,000 OneKey® MLS as Distributed by MLS Grid
- 2024-07-09 Price Changed $5,295,000 OneKey® MLS as Distributed by MLS Grid
- 2024-06-19 Listed $5,495,000 OneKey® MLS as Distributed by MLS Grid
- 2012-11-15 Listing Removed — OneKey® MLS as Distributed by MLS Grid
- 2012-03-15 Listed $1,595,000 OneKey® MLS as Distributed by MLS Grid
- 2002-05-08 Sold (Public Records) $450,000 Public Records
- 2002-05-08 Sold (Public Records) $450,000 Public Records
- 1997-01-24 Sold (Public Records) $237,000 Public Records
- 1988-05-31 Sold (Public Records) $255,000 Public Records
- 1986-12-31 Sold (Public Records) $70,000 Public Records
Property tax history
+8.1%/yrLatest (2024): $13,205 · +0.0% YoY. Source: county tax records.
Cash-flow waterfall
monthlySold comps — $/sqft
last 12 mo · ≤1 miLoading sold comps…