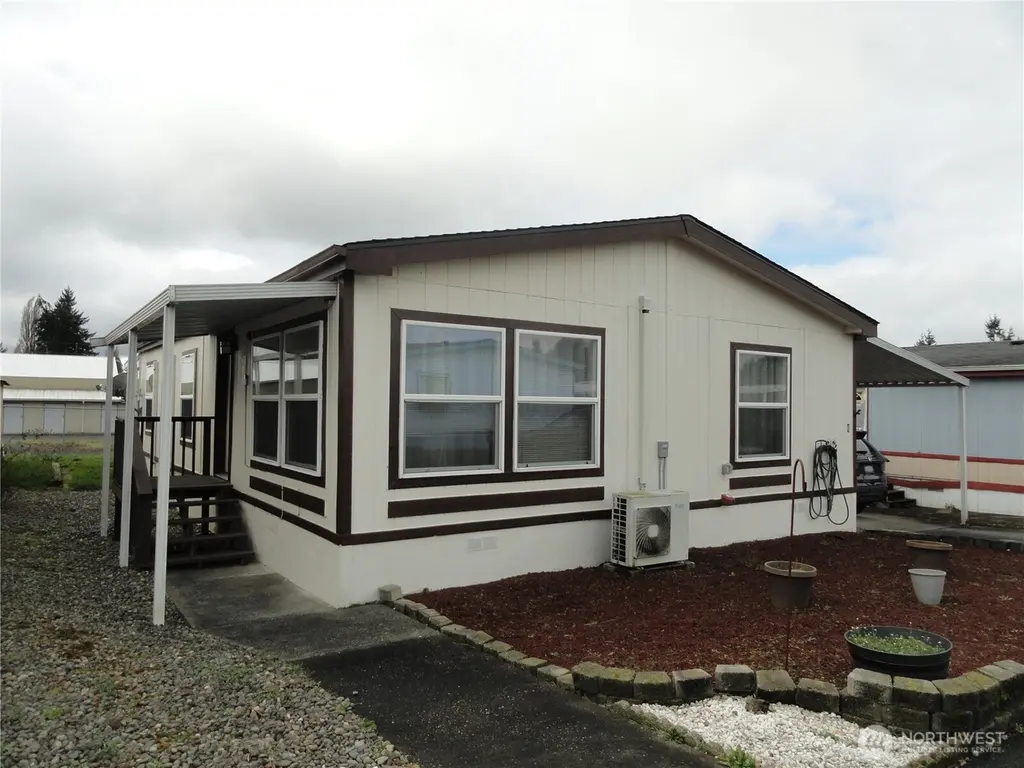
222 Maple Ave NW Unit 6 · Napavine, WA
Flood risk No data
- FEMA flood zone
- —
- Chance of flooding over 30 yrs
- —
- Est. flood insurance / yr
- —
Fire risk No data
- Est. fire insurance / yr
- —
Heat risk No data
- Hot days now (above threshold)
- —
- Hot days in 30 yrs
- —
Wind risk No data
- Chance of severe wind over 30 yrs
- —
Air-quality risk No data
- Unhealthy air days now
- —
- Unhealthy air days in 30 yrs
- —
Risk factors via First Street. Map © Google.
Why this score? — see what drove the A- grade
The composite is a weighted blend of 9 inputs, each scored 0–100. Each bar is that input's sub-score; the figure is the points it added to the 100-point composite (weight × sub-score).
- Cash flow +30.0/30.0
- ARV discount +15.0/15.0
- DSCR +10.0/10.0
- 1% rule +9.0/10.0
- Schools +5.1/10.0
- Appreciation +5.0/10.0
- Livability +3.2/5.0
- Rent growth +2.5/5.0
- Condition / age +2.5/5.0
$141,500
🖨 Deal sheet (PDF) 📄 Offer letter ✓ Due diligence
Listing remarks
A charming 2-bedroom, 1.5 bath home located in Napavine. This lovely home has been updated inside and out with fresh paint, new roof, new appliances, new window screens, new mini-ductless system with room to add another head. The kitchen has new countertops and a large ranch style sink. If that isn't enough maybe you would love to relax after an exhausting day in your large jetted bathtub! The park has a large playground area and small basketball court! Also, there is a bonus room off of the primary bedroom. A large covered carport to protect your cars from the heat and rain! This has super affordable space rent at $465 in Highland Park and no age restrictions. Schools are close, I-5 is co
Key facts
- New window screens
- New appliances
- New countertops
Tags
Neighborhood map
What this means for you Summary
Snapshot
- This is a 2-bed/2.0-bath other listed at $142k.
Deal economics
- At list price, monthly cash flow is $722 ($9k/yr) — positive.
- The deal already cash-flows at list — no discount required.
- Meets the 1% rule at list price ($2k rent vs $142k).
- Recommended offer: $129k (9.0% below list) — sets the bar for market timing.
- Cap rate 12.4% vs local median 1.9% in Napavine — top-decile yield for the area; either an underpriced asset or a hidden risk that comps aren't pricing in. Stress-test before assuming the spread holds.
Location & tenants
- Location reads 63/100 on livability (#384 in WA) — a middle-class / working-renter tenant base. Strengths: housing A+, cost of living B+; Watch: health & safety C-, amenities F, commute F.
- Napavine School District (rural): math 52% / reading 63% proficiency, ranked #82 of 291 in WA (top 28%) — acceptable for families but not a draw, mixed tenant base, ~2y average lease.
- Market conditions: 10 active listings in the ZIP; 3 comparable units currently listed for rent nearby; rentals at typical pace (median 22d on market — plan ~3-4 weeks tenant-placement turnaround); 265 units permitted in Lewis County in 2024 (44 in 5+ unit buildings).
Forward outlook
- In year one you build about $5k of equity ($978 loan paydown + $4k appreciation (3.0% local appreciation)).
- Lewis County population projected at -11% by 2050 — secular population decline; favor cash flow + early exit over multi-decade hold.
- At projected returns (3.0% appreciation + 3.0% rent growth), your $40k cash investment doubles in ~3 years — after that, you're playing with house money.
- By year 7, paydown + projected appreciation supports a ~$33k cash-out refi (75% LTV) — recoverable capital for the next deal without selling this one.
Negotiation context
- It's been on market 120 days — a 9% lower offer ($129k) is reasonable based on typical stale-listing flexibility.
- 3 sale attempts since 3y ago; this cycle's ask has dropped $8k (6%) from the opening price — seller is motivated, your offer sets the floor, not the list.
- Current owner paid $87k; list at $142k implies a 63% gain — meaningful room to come down on a strong offer.
Questions for the listing agent
- It's been on market 120 days. Have you received any prior offers? Is the seller open to a 9% concession, seller financing, or rate buy-down credit?
- Why hasn't it sold? Are there any deal-killer items the seller is aware of (foundation, flood, title, zoning, code violations)?
- Is there a deadline driving the sale (1031 exchange, divorce, estate, relocation)? That informs how much negotiation room exists.
- What's the average days-on-market for RENTAL listings here right now (not sales)? A rising rental-DOM trend means longer vacancies and softer asking-rent achievability than the comps imply.
- What's the recent tenant-quality profile in this submarket — average credit score on applications, eviction rate, late-payment / NSF rate, and stable-employment percentage? A property-management company in the area should have these aggregated.
- How much new for-sale + rental construction is in the pipeline within 1–3 miles? Heavy new supply typically softens prices + rents 12–24 months out; constrained supply supports both.
Investment metrics
- 1% rule
- 1.40% ✓
- Cap rate
- 12.42%
- Cash-on-cash
- 21.87%
- DSCR
- 1.97
- GRM
- 6.0
CMA / ARV
- ARV (median comp)
- $226,557
- List price
- $141,500
- Delta
- -37.54%
- Verdict
- UNDERPRICED
- Comps
- 2 within 1.0 mi
Projected returns pro-forma
3.0% appreciation · 3.0% rent growth · sell at horizon
- IRR
- 28.1%
- Equity multiple
- 2.59×
- Total profit
- $62,984
- Equity at exit
- $63,625
- IRR
- 28.6%
- Equity multiple
- 5.03×
- Total profit
- $159,707
- Equity at exit
- $98,053
Cash invested: $39,620 (down + closing). Projections, not guarantees.
Landlord ↔ Tenant lean methodology
- Overall (STATE)
- 28 Tenant-Leaning
- State Washington
- 28 Tenant-Leaning · D+8
- County
- — inherits STATE
- City
- — inherits STATE
ZIP-level market 98565
- Active inventory
- 10
- Price-to-rent
- 6.0×
Monthly cashflow live
- Estimated rent
- $1,978 medium interval (Pro) →
- Mortgage (P&I)
- −$742
- Tax from tax record
- −$40 /mo · $477/yr
- Insurance
- −$59
- HOA
- −$0
- Vacancy / Maint / Mgmt
- −$415
- Net cashflow
- $722
Break-even live
Sensitivity live
| Price | -10% $802 | -5% $762 | +0% $722 | +5% $682 | +10% $642 |
|---|---|---|---|---|---|
| Rent | -10% $566 | -5% $644 | +0% $722 | +5% $800 | +10% $878 |
| Rate | -1.0pp $793 | -0.5pp $758 | base $722 | +0.5pp $685 | +1.0pp $648 |
UW: 25.0% down · 7.5% · 30yr · 1.5% tax · 5.0% vac · 8.0% maint · 8.0% mgmt
Financing live
Cash to close
- Down payment
- $35,375
- Closing costs
- $4,245
- Reserves months
- —
- Total cash needed
- —
Loan-product check · same deal, 3 products live
Conventional
25% down · 7.5% · 30yr
- Down + closing
- —
- Monthly P&I
- —
- Monthly cashflow
- —
- DSCR
- —
- Eligible?
- —
Personal DTI + credit; lowest rate.
DSCR
20% down · 8.5% · 30yr
- Down + closing
- —
- Monthly P&I
- —
- Monthly cashflow
- —
- DSCR
- —
- Eligible?
- —
No personal income docs; deal must DSCR.
Hard money
10% down · 12.0% · 12mo
- Down + closing
- —
- Monthly P&I
- —
- Monthly cashflow
- —
- DSCR
- —
- Eligible?
- —
Short-term bridge; refi at stabilization.
Rent comps 3 comps
| Address | Beds | Baths | Sqft | Rent | $/sqft | DOM | Units | Dist |
|---|---|---|---|---|---|---|---|---|
| 805 3rd Ave E Napavine, WA | 3.0 | 2.0 | 1300 | $2,095 | $1.61 | 22d | 1 | 0.20mi |
| 208 E Stella St #19 Napavine, WA | 3.0 | 2.5 | 1500 | $1,995 | $1.33 | 44d | 1 | 0.28mi |
| 208 E Stella St Unit 208-14 Napavine, WA | 2.0 | 1.5 | 1200 | $1,795 | $1.50 | 22d | 1 | 0.29mi |
Listing history 26 events
-
2026-06-21days on market $141,500 Active 120 DOM
-
2026-06-18days on market $141,500 Active 118 DOM
-
2026-06-17days on market $141,500 Active 117 DOM
-
2026-06-16days on market $141,500 Active 116 DOM
-
2026-06-15days on market $141,500 Active 115 DOM
-
2026-06-15days on market $141,500 Active 114 DOM
-
2026-06-13days on market $141,500 Active 113 DOM
-
2026-06-12days on market $141,500 Active 112 DOM
-
2026-06-09days on market $141,500 Active 109 DOM
-
2026-06-08days on market $141,500 Active 108 DOM
-
2026-06-08days on market $141,500 Active 107 DOM
-
2026-06-05days on market $141,500 Active 105 DOM
-
2026-06-03statusdays on market $141,500 Active 103 DOM
-
2026-06-02status $141,500 Pending 102 DOM
-
2026-06-01days on market $141,500 Active 102 DOM
-
2026-05-31days on market $141,500 Active 101 DOM
-
2026-05-10price $141,500
-
2026-04-11price $140,000
-
2026-03-10price $145,000
-
2026-02-19$149,900 Active
-
2023-07-21soldstatus $87,000 Closed
-
2023-07-13status Pending
-
2023-07-08$89,500 Active
-
2023-04-13soldstatus $80,000 Closed
-
2023-03-21status Pending
-
2023-01-25$84,900 Active
ⓘ Source: listings_history table (triggers on properties + properties_extension) + one-shot
backfill from property_details.listing_events for pre-trigger history.
Tax reassessment forecast WA · Resets to sale price
- Current annual tax
- $477 · $40/mo
- Projected year-2 tax
- $1,387 · $116/mo
- Expected delta
- +$909/yr (+$76/mo · 190.5%)
ⓘ Screening estimate from a state-policy table — verify with the county assessor before closing.
Nearby sold comps map
Loading sold comps map…
Walkable amenities ~0.75 mi
Loading nearby amenities…
Taxation est. · year 1
- Rental income
- $23,740
- − Mortgage interest
- −$7,926
- − Property taxes
- −$477
- − Insurance
- −$708
- − Repairs & maintenance
- −$1,899
- − Management
- −$1,899
- − Depreciation
- −$4,116
- Taxable income
- $6,714
- Est. tax owed @ 24.0%
- −$1,611
- After-tax cash flow
- $7,054/yr
For passive investors: Depreciation is non-cash, so a rental often shows a tax loss while cash-flowing — sheltering income. Rental losses are passive: they offset passive income freely, and up to $25,000/yr can offset ordinary (W-2) income if you actively participate and your MAGI is under $100k (phasing out to $0 by $150k); unused losses carry forward. On sale, claimed depreciation is recaptured at up to 25%, and gains may owe capital-gains tax (a 1031 exchange can defer both). Figures are a year-1 estimate at your 24.0% rate — not tax advice; consult a CPA.
Schools (NCES district)
- District
- Napavine School District
- NCES district ID
- 5305490
- Math proficiency
- 52% ▼ -1.00%
- Reading proficiency
- 63% ▼ -4.00%
- Median HH income
- $51,433
- Composite
- 50.83/100
- National rank
- #3887
- State rank
- #82 of 291 in WA
Livability — Napavine
- Score
- 63/100
- State rank
- #384
- US rank
- #15158
Category grades
Schools grade is shown separately in the Schools card above.
Census & demographics
- Census place
- Napavine, WA
- City population
- 484
- Population (ZIP)
- 484
Population outlook (Lewis County) Hauer SSP2
- Today (2025)
- 75,749 people
- By 2030
- 74,647 · -1.5%
- By 2040
- 71,310 · -5.9%
- By 2050
- 67,748 · -10.6%
- By 2075
- 59,829 · -21.0%
- By 2100
- 52,293 · -31.0%
Race, ethnicity, and origin ACS 2023
- Neighborhood character
- Predominantly White (83%)
- Race & ethnicity
- White 83% Asian 14% Two or more races 2% Hispanic / Latino 2%
- Common ancestry
- Slovak 5% Russian 4% Italian 2%
- Foreign-born
- 3% · South Korea
- Languages at home
- 85% English-only · Korean 13% Spanish 2%
Political lean MEDSL · Lewis
- 2024 margin
- Solid R (+33.0) · D 32.0% · R 65.0% · Other 3.0%
- 2008→2024 swing
- -13.8pp toward R · 2008: -19.2pp · 2024: -33.0pp
- All cycles
- 2024: R+33.0 2020: R+32.8 2016: R+36.2 2012: R+23.5 2008: R+19.2
Not yet ingested
- Civics
- —
Market trends
- HPI YoY
- —
- Current HPI
- —
- Rent YoY
- —
- Metro
- —
- State GDP YoY
- ▲ 4.65%
- F500 in state
- 22
Industry mix (Fortune 500 HQ in WA)
| Industry | F500 HQs | Revenue |
|---|---|---|
| Retail | 2 | $269B |
|
||
| Technology / Retail | 1 | $638B |
|
||
| Technology | 1 | $245B |
|
||
| Telecommunications | 1 | $38B |
|
||
| Food / Beverage | 1 | $36B |
|
||
| Automotive / Trucks | 1 | $34B |
|
||
Price history
+66.7% since first listed10 events — show timeline
- 2026-05-10 Price Changed $141,500 NWMLS as Distributed by MLS Grid
- 2026-04-11 Price Changed $140,000 NWMLS as Distributed by MLS Grid
- 2026-03-10 Price Changed $145,000 NWMLS as Distributed by MLS Grid
- 2026-02-19 Listed $149,900 NWMLS as Distributed by MLS Grid
- 2023-07-21 Sold (MLS) $87,000 NWMLS as Distributed by MLS Grid
- 2023-07-13 Pending — NWMLS as Distributed by MLS Grid
- 2023-07-08 Listed $89,500 NWMLS as Distributed by MLS Grid
- 2023-04-13 Sold (MLS) $80,000 NWMLS as Distributed by MLS Grid
- 2023-03-21 Pending — NWMLS as Distributed by MLS Grid
- 2023-01-25 Listed $84,900 NWMLS as Distributed by MLS Grid
Property tax history
+5.3%/yrLatest (2026): $477 · -0.9% YoY. Source: county tax records.
Cash-flow waterfall
monthlySold comps — $/sqft
last 12 mo · ≤1 miLoading sold comps…