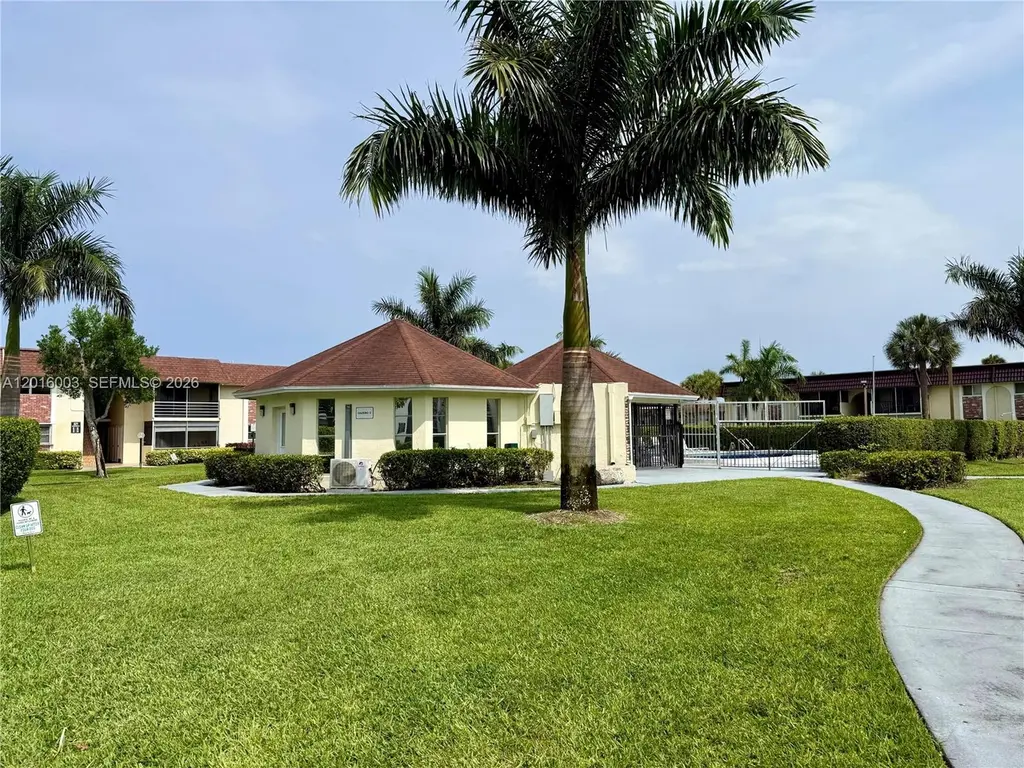
22805 SW 66th Ave #208 · Watergate, FL
Flood risk 1/10 · Minimal
- FEMA flood zone
- AO
- Chance of flooding over 30 yrs
- 0.0%
- Est. flood insurance / yr
- $848 – $2,087
Fire risk 1/10 · Minimal
- Est. fire insurance / yr
- $947 – $1,759
Heat risk 10/10 · Severe
- Hot days now (above 107°F)
- 7 days/yr
- Hot days in 30 yrs
- 28 days/yr
Wind risk 10/10 · Severe
- Chance of severe wind over 30 yrs
- 99.0%
Air-quality risk 3/10 · Minor
- Unhealthy air days now
- 2 days/yr
- Unhealthy air days in 30 yrs
- 3 days/yr
Risk factors via First Street. Map © Google.
Why this score? — see what drove the C grade
The composite is a weighted blend of 9 inputs, each scored 0–100. Each bar is that input's sub-score; the figure is the points it added to the 100-point composite (weight × sub-score).
- Cash flow +21.2/30.0
- 1% rule +9.1/10.0
- ARV discount +7.5/15.0
- DSCR +6.7/10.0
- Schools +4.3/10.0
- Rent growth +3.4/5.0
- Livability +3.4/5.0
- Condition / age +2.5/5.0
- Appreciation +0.0/10.0
$164,997
🖨 Deal sheet 📄 Offer letter ✓ Due diligence
Listing remarks
Second-floor apartment for sale in a desirable 55+ community! This unit offers great potential and is ready for your personal updates and finishing touches. Enjoy peaceful garden and pool views from your living space, creating a relaxing atmosphere year-round. The community allows rentals for a minimum of 4 months per year, making it ideal for seasonal residents or part-time investors. Additional features include extra storage space and convenient washer/dryer facilities located on the first floor of the building. Perfectly situated close to restaurants, supermarkets, shopping centers, and major highways, this location provides easy access to everything you need while still offering a quiet
Key facts
- Extra storage space
- Close to restaurants
- Pool views
Tags
Property features AI
Finance
- Other: Heated pool
- HOA & community: Monthly HOA fee; HOA covers common areas, cable TV, insurance, internet, structure maintenance, pool(s), recreation facilities, roof, sewer, trash, and water; Community amenities include clubhouse, laundry, barbecue, picnic area, pool, and storage; Senior community
Exterior
- Parking: Assigned parking with two or more spaces
- Utilities: Has heating
- Home design: 2-story property; Entry on second level; Attached property
- Construction: Block construction; Resale property
- Exterior features: Balcony; Courtyard; Screened balcony
Interior
- Kitchen: Dishwasher; Electric range; Garbage disposal; Refrigerator
- Bedrooms: Bedroom on main level
- Flooring: Hardwood; Tile; Wood
- Bathrooms: 2 full bathrooms
- Heating & cooling: Central heating; Ceiling fans for cooling
- Interior features: Bedroom on main level; Second floor entry; Hardwood, tile, and wood flooring
- Laundry & utility: Common area laundry
Neighborhood map
What this means for you Summary
Snapshot
- This is a 2-bed/2.0-bath condo listed at $165k.
Deal economics
- At list price, monthly cash flow is $115 ($1k/yr) — positive.
- The deal already cash-flows at list — no discount required.
- Meets the 1% rule at list price ($2k rent vs $165k).
- Recommended offer: $160k (3.0% below list) — sets the bar for market timing.
Location & tenants
- Location reads 67/100 on livability (#585 in FL) — a middle-class / working-renter tenant base. Strengths: cost of living A+, housing A+, crime A; Watch: schools F, amenities F, commute F.
- Palm Beach (suburban): math 46% / reading 53% proficiency, ranked #34 of 73 in FL (top 47%) — families likely to look elsewhere, expect single-tenant / working-renter base with shorter leases.
- Market conditions: Rents rising (+3.7%/yr); 267 active listings in the ZIP; 40 comparable units currently listed for rent nearby; rentals at typical pace (median 15d on market — plan ~3-4 weeks tenant-placement turnaround); solid renter incomes; 3,974 units permitted in Palm Beach County in 2024 (1,012 in 5+ unit buildings).
- This rent runs 32% of the median local income ($89k/yr) — at the standard rent-burdened threshold; future hikes will face affordability resistance.
Forward outlook
- Local home prices are declining (-3.0%/yr); year-one equity from $1k of loan paydown is wiped out by about $5k of value loss. Plan a longer hold.
- Palm Beach County population projected at +30% by 2050 — long-run rental-demand tailwind backs the buy-and-hold thesis.
Negotiation context
- It's been on market 40 days — a 3% lower offer ($160k) is reasonable based on typical stale-listing flexibility.
- 9 sale attempts since 28y ago with the ask held roughly flat each time — persistent listings suggest the price (not the market) is what's stuck; bring a comps-based counter.
- Current owner paid $75k; list at $165k implies a 120% gain — meaningful room to come down on a strong offer.
Risks & watch-outs
- Watch-outs: flood insurance adds $122/mo.
- Climate carrying-cost: in FEMA flood zone AO (mandatory federal flood insurance); severe wind risk, 99% chance of damaging wind over 30y; extreme-heat days projected 7→28/yr by 2055 (HVAC capex compounding) — expect insurance premiums to compound above CPI over the hold.
Questions for the listing agent
- It's been on market 40 days. Have you received any prior offers? Is the seller open to a 3% concession, seller financing, or rate buy-down credit?
- Built in 1979 — when were the roof, HVAC, electrical panel, plumbing, and water heater last replaced?
- What's the actual annual flood-insurance premium (NFIP or private), and is the property in a SFHA with mandatory coverage?
- What does the HOA fee cover, when was the last increase, and are there any pending special assessments or reserve-fund shortfalls?
- Any open or pending special assessments — roof, HVAC, plumbing, elevator, façade? What's the per-unit balance and payoff schedule, and is the seller paying it off at close or rolling it to the buyer?
- Is there a deadline driving the sale (1031 exchange, divorce, estate, relocation)? That informs how much negotiation room exists.
- Schools are F-rated, which usually means shorter tenancies and higher turnover. Who's the typical renter profile here, and what's been the actual vacancy rate?
- What's the average days-on-market for RENTAL listings here right now (not sales)? A rising rental-DOM trend means longer vacancies and softer asking-rent achievability than the comps imply.
- What's the recent tenant-quality profile in this submarket — average credit score on applications, eviction rate, late-payment / NSF rate, and stable-employment percentage? A property-management company in the area should have these aggregated.
- How much new apartment / multifamily construction is in the pipeline within 1–3 miles? Heavy new supply (>2% of stock underway) typically softens rents 12–24 months out; light construction supports rent growth.
Investment metrics
- 1% rule
- 1.41% ✓
- Cap rate
- 8.02%
- Cash-on-cash
- 6.16%
- DSCR
- 1.27
- GRM
- 5.9
CMA / ARV
No comps found within radius.
Projected returns pro-forma
-3.0% appreciation · 3.72% rent growth · sell at horizon
- IRR
- -10.1%
- Equity multiple
- 0.63×
- Total profit
- $-17,324
- Equity at exit
- $24,602
- IRR
- 0.9%
- Equity multiple
- 1.07×
- Total profit
- $3,006
- Equity at exit
- $14,266
Cash invested: $46,199 (down + closing). Projections, not guarantees.
Landlord ↔ Tenant lean methodology
- Overall (STATE)
- 87 Strongly Landlord-Friendly
- State Florida
- 87 Strongly Landlord-Friendly · R+3
- County
- — inherits STATE
- City
- — inherits STATE
ZIP-level market 33428
- Rents YoY
- 3.7%
- Active inventory
- 267
- Price-to-rent
- 5.9×
Monthly cashflow live
- Estimated rent
- $2,326 high interval (Pro) →
- Mortgage (P&I)
- −$865
- Tax from tax record
- −$236 /mo · $2,835/yr
- Insurance
- −$69
- Flood insurance flood zone
- −$122 /mo · $1,468/yr
- HOA
- −$430
- Vacancy / Maint / Mgmt
- −$488
- Net cashflow
- $115
Break-even live
UW: 25.0% down · 7.5% · 30yr · 1.5% tax · 5.0% vac · 8.0% maint · 8.0% mgmt
Financing live
Cash to close
- Down payment
- $41,249
- Closing costs
- $4,950
- Reserves months
- —
- Total cash needed
- —
Loan-product check · same deal, 3 products live
Conventional
25% down · 7.5% · 30yr
- Down + closing
- —
- Monthly P&I
- —
- Monthly cashflow
- —
- DSCR
- —
- Eligible?
- —
Personal DTI + credit; lowest rate.
DSCR
20% down · 8.5% · 30yr
- Down + closing
- —
- Monthly P&I
- —
- Monthly cashflow
- —
- DSCR
- —
- Eligible?
- —
No personal income docs; deal must DSCR.
Hard money
10% down · 12.0% · 12mo
- Down + closing
- —
- Monthly P&I
- —
- Monthly cashflow
- —
- DSCR
- —
- Eligible?
- —
Short-term bridge; refi at stabilization.
Rent comps 40 comps
| Address | Beds | Baths | Sqft | Rent | $/sqft | DOM | Units | Dist |
|---|---|---|---|---|---|---|---|---|
| 9949 Sandalfoot Blvd Boca Raton, FL | 2.0 | 1.5–2.0 | 818 | $2,000 | $2.44 | 12d | 2 | 0.03mi |
| 9949 Sandalfoot Blvd #531 Boca Raton, FL | 2.0 | 2.0 | 820 | $2,200 | $2.68 | 24d | 1 | 0.03mi |
| 9915 Sandalfoot Blvd Boca Raton, FL | 2.0 | 1.0 | 777 | $2,000 | $2.57 | 10d | 2 | 0.04mi |
| 9921 Three Lakes Cir Unit 9921 Boca Raton, FL | 3.0 | 2.0 | 967 | $2,700 | $2.79 | 24d | 1 | 0.14mi |
| 9973 Three Lakes Cir Boca Raton, FL | 2.0 | 2.0 | 1026 | $2,500 | $2.44 | 24d | 1 | 0.15mi |
| 9993 Three Lakes Cir Boca Raton, FL | 3.0 | 2.0 | 972 | $2,600 | $2.67 | 14d | 1 | 0.16mi |
| 10166 Marlin Cir Unit 2 Boca Raton, FL | 2.0 | 1.0 | 789 | $1,450 | $1.84 | 16d | 1 | 0.23mi |
| 22605 SW 66th Ave #403 Boca Raton, FL | 2.0 | 2.0 | 1030 | $2,100 | $2.04 | 24d | 1 | 0.24mi |
| 22605 SW 66th Ave #206 Boca Raton, FL | 1.0 | 1.5 | 960 | $1,650 | $1.72 | 5d | 1 | 0.24mi |
| 10267 Boca Bnd W Unit G4 Boca Raton, FL | 2.0 | 2.0 | 1068 | $2,850 | $2.67 | 24d | 1 | 0.32mi |
| 10323 Boca Bnd W Unit K4 Boca Raton, FL | 2.0 | 2.0 | 1068 | $2,600 | $2.43 | 24d | 1 | 0.38mi |
| 1620 SW 64th Way Unit H Boca Raton, FL | 2.0 | 2.0 | 1008 | $2,250 | $2.23 | 24d | 1 | 0.40mi |
| 9780 Marina Blvd #415 Boca Raton, FL | 2.0 | 2.0 | 955 | $2,000 | $2.09 | 24d | 1 | 0.46mi |
| 10457 S 228th Ln Boca Raton, FL | 2.0 | 2.0 | 1104 | $1,900 | $1.72 | 7d | 1 | 0.48mi |
| 9355 SW 8th St Boca Raton, FL | 1.0–2.0 | 1.5–2.0 | 780 | $1,975 | $2.53 | 1d | 4 | 0.54mi |
| 9860 SW 3rd St Boca Raton, FL | 1.0–3.0 | 1.5–2.5 | 1222 | $2,631 | $2.15 | 2d | 36 | 0.57mi |
| 9826 Marina Blvd #1027 Boca Raton, FL | 2.0 | 2.0 | 955 | $2,500 | $2.62 | 24d | 1 | 0.59mi |
| 9273 SW 8th St Boca Raton, FL | 1.0–2.0 | 1.5–2.0 | 878 | $2,200 | $2.51 | 3d | 3 | 0.63mi |
| 10669 Boca Entrada Blvd Boca Raton, FL | 3.0 | 2.0 | 1083 | $3,450 | $3.19 | 24d | 1 | 0.64mi |
| 22974 Seaspray Pl Boca Raton, FL | 3.0 | 2.0 | 1080 | $2,200 | $2.04 | 12d | 1 | 0.69mi |
| 9370 SW 8th St #107 Boca Raton, FL | 2.0 | 2.0 | 900 | $2,150 | $2.39 | 15d | 1 | 0.71mi |
| 9370 SW 8th St #107 Boca Raton, FL | 2.0 | 2.0 | 900 | $2,100 | $2.33 | 5d | 1 | 0.71mi |
| 9503 Boca Cove Cir #603 Boca Raton, FL | 2.0 | 2.0 | 912 | $2,200 | $2.41 | 22d | 1 | 0.71mi |
| 9233 SW 8th St #110 Boca Raton, FL | 2.0 | 2.0 | 979 | $1,800 | $1.84 | 7d | 1 | 0.72mi |
| 9466 Boca Cove Cir #310 Boca Raton, FL | 2.0 | 2.0 | 770 | $2,000 | $2.60 | 24d | 1 | 0.74mi |
| 9374 SW 3rd St #708 Boca Raton, FL | 2.0 | 2.0 | 961 | $2,100 | $2.19 | 7d | 1 | 0.79mi |
| 9440 SW 8th St Boca Raton, FL | 1.0–2.0 | 1.5–2.0 | 878 | $1,950 | $2.22 | 2d | 2 | 0.80mi |
| 9260 Boca Vue Dr Boca Raton, FL | 1.0–3.0 | 1.0–2.0 | 1052 | $3,304 | $3.14 | 1d | 33 | 0.81mi |
| 9235 SW 8th St Boca Raton, FL | 2.0 | 2.0 | 1045 | $2,175 | $2.08 | 10d | 4 | 0.81mi |
| 9235 SW 8th St Boca Raton, FL | 2.0 | 2.0 | 900 | $2,150 | $2.39 | 2d | 2 | 0.81mi |
| 9338 SW 3rd St #508 Boca Raton, FL | 2.0 | 2.0 | 961 | $2,300 | $2.39 | 14d | 1 | 0.83mi |
| 9338 SW 3rd St #508 Boca Raton, FL | 2.0 | 2.0 | 961 | $2,300 | $2.39 | 12d | 1 | 0.83mi |
| 9162 SW 5th St Unit A Boca Raton, FL | 2.0 | 2.0 | 1039 | $2,400 | $2.31 | 24d | 1 | 0.84mi |
| 9210 SW 3rd St #216 Boca Raton, FL | 2.0 | 2.0 | 961 | $2,350 | $2.45 | 24d | 1 | 0.88mi |
| 9200 SW 3rd St #109 Boca Raton, FL | 2.0 | 2.0 | 961 | $2,250 | $2.34 | 24d | 1 | 0.89mi |
| 11887 Anchorage Way Boca Raton, FL | 2.0 | 2.0 | 960 | $1,900 | $1.98 | 24d | 1 | 0.95mi |
| 5800 NW 74th Pl Coconut Creek, FL | 1.0–2.0 | 1.0–2.0 | 1115 | $2,407 | $2.16 | 2d | 17 | 0.98mi |
| 11942 N Branch Rd Boca Raton, FL | 2.0 | 2.0 | 900 | $1,950 | $2.17 | 24d | 1 | 0.99mi |
| 11992 Coral Pl Boca Raton, FL | 2.0 | 1.5 | 720 | $2,000 | $2.78 | 24d | 1 | 1.05mi |
| 23398 SW 57th Ave Boca Raton, FL | 2.0 | 2.0 | 988 | $2,150 | $2.18 | 5d | 2 | 1.11mi |
HOA detail condo
- Monthly dues
- $430 · $5,160/yr
- Likely covers
- pool
- Assessments
- None detected in remarks — confirm with the listing agent.
Listing history 37 events
-
2026-06-18days on market $164,997 Active 40 DOM
-
2026-06-17days on market $164,997 Active 39 DOM
-
2026-06-16days on market $164,997 Active 38 DOM
-
2026-06-15days on market $164,997 Active 37 DOM
-
2026-06-13days on market $164,997 Active 35 DOM
-
2026-06-09days on market $164,997 Active 31 DOM
-
2026-06-08days on market $164,997 Active 30 DOM
-
2026-06-07days on market $164,997 Active 29 DOM
-
2026-06-04days on market $164,997 Active 26 DOM
-
2026-06-03days on market $164,997 Active 25 DOM
-
2026-06-02days on market $164,997 Active 24 DOM
-
2026-06-01days on market $164,997 Active 23 DOM
-
2026-05-31days on market $164,997 Active 22 DOM
-
2026-05-10$164,997 Active
-
2026-04-26historical
-
2026-02-13price $170,000
-
2025-10-27$175,000 Active
-
2020-06-01historical
-
2019-12-01$125,000 Active
-
2019-10-29historical
-
2019-10-26status Active
-
2019-09-27historical
-
2019-09-13$125,000 Active
-
2016-01-15soldstatus $75,000 Closed
-
2015-03-11soldstatus $75,000
-
2014-12-22historical Contingent
-
2014-10-09price $79,999
-
2014-09-12price $80,999
-
2014-08-14$85,000 Active
-
2013-11-12historical
-
2013-09-22historical
-
2006-01-26$179,900
-
1999-06-18$54,888
-
1999-03-11soldstatus $46,000
-
1999-02-26soldstatus $46,000
-
1999-01-18historical
-
1998-04-21$48,500
ⓘ Source: listings_history table (triggers on properties + properties_extension) + one-shot
backfill from property_details.listing_events for pre-trigger history.
Tax reassessment forecast FL · Resets to sale price
- Current annual tax
- $2,835 · $236/mo
- Projected year-2 tax
- $2,835 · $236/mo
- Expected delta
- $0/yr ($0/mo · 0.0%)
ⓘ Screening estimate from a state-policy table — verify with the county assessor before closing.
Climate risk First Street
- Flood 1/10 Low FEMA zone AO · 0% chance over 30 yrs
- Wildfire 1/10 Low
- Heat 10/10 Extreme 7 d/yr ≥107°F today · 28 d/yr by 30 yrs out
- Wind 10/10 Extreme 99% chance of damaging wind over 30 yrs
- Air quality 3/10 Moderate 2 unhealthy d/yr today · 3 by 30 yrs out
Nearby sold comps map
Loading sold comps map…
Walkable amenities ~0.75 mi
Loading nearby amenities…
Taxation est. · year 1
- Rental income
- $27,912
- − Mortgage interest
- −$9,242
- − Property taxes
- −$2,835
- − Insurance
- −$2,292
- − Repairs & maintenance
- −$2,233
- − Management
- −$2,233
- − HOA
- −$5,160
- − Depreciation
- −$4,800
- Taxable loss
- −$884
- Est. tax savings @ 24.0%
- +$212
- After-tax cash flow
- $1,592/yr
For passive investors: Depreciation is non-cash, so a rental often shows a tax loss while cash-flowing — sheltering income. Rental losses are passive: they offset passive income freely, and up to $25,000/yr can offset ordinary (W-2) income if you actively participate and your MAGI is under $100k (phasing out to $0 by $150k); unused losses carry forward. On sale, claimed depreciation is recaptured at up to 25%, and gains may owe capital-gains tax (a 1031 exchange can defer both). Figures are a year-1 estimate at your 24.0% rate — not tax advice; consult a CPA.
Schools (NCES district)
- District
- Palm Beach
- NCES district ID
- 1201500
- Math proficiency
- 46% ▼ -16.00%
- Reading proficiency
- 53% ▼ -4.00%
- Median HH income
- $53,943
- Composite
- 42.72/100
- National rank
- #3160
- State rank
- #34 of 73 in FL
Livability — Watergate
- Score
- 67/100
- State rank
- #585
- US rank
- #11201
Category grades
Schools grade is shown separately in the Schools card above.
Census & demographics
- County
- Palm Beach County · 1,438,312 people
- Metro
- Miami-Fort Lauderdale-Pompano Beach, FL
- Population (ZIP)
- 47,588
- Household income
- $88,543
- Rent vs Own
- Severe rent burden
- 1990.0
Population outlook (Palm Beach County) Hauer SSP2
- Today (2025)
- 1,637,487 people
- By 2030
- 1,743,255 · +6.5%
- By 2040
- 1,948,712 · +19.0%
- By 2050
- 2,132,979 · +30.3%
- By 2075
- 2,530,027 · +54.5%
- By 2100
- 2,706,979 · +65.3%
Race, ethnicity, and origin ACS 2023
- Neighborhood character
- Diverse neighborhood (Simpson 0.69)
- Race & ethnicity
- White 50% Two or more races 23% Hispanic / Latino 22% Black 7% Asian 5%
- Hispanic origin (detail)
- Mexican 3% Puerto Rican 3% Cuban 2% Dominican 1%
- Common ancestry
- Estonian 12% Romanian 3% Scotch-Irish 3%
- Foreign-born
- 37% · Canada, Jamaica, Vietnam
- Languages at home
- 55% English-only · Spanish 19% Other Indo-European 17% French/Haitian/Cajun 2%
Political lean MEDSL · Palm Beach
- 2024 margin
- Toss-up / Even · D 50.0% · R 49.2%
- 2008→2024 swing
- -22.1pp toward R · 2008: 22.9pp · 2024: 0.8pp
- All cycles
- 2024: D+0.8 2020: D+12.8 2016: D+15.3 2012: D+17.0 2008: D+22.9
Not yet ingested
- Civics
- —
Market trends
- HPI YoY
- ▼ -299.00%
- Current HPI
- 373.2649
- Rent YoY
- ▲ 3.72%
- Metro
- Miami-Fort Lauderdale-Pompano Beach, FL
- State GDP YoY
- ▲ 3.28%
- F500 in state
- 36
Industry mix (Fortune 500 HQ in FL)
| Industry | F500 HQs | Revenue |
|---|---|---|
| Industrial Technology | 2 | $29B |
|
||
| Insurance | 2 | $17B |
|
||
| Retail | 1 | $60B |
|
||
| Technology Distribution | 1 | $58B |
|
||
| Homebuilding | 1 | $35B |
|
||
| Technology Manufacturing | 1 | $35B |
|
||
Price history
+240.2% since first listed24 events — show timeline
- 2026-05-10 Listed $164,997 MARMLS
- 2026-04-26 Listing Removed — MARMLS
- 2026-02-13 Price Changed $170,000 MARMLS
- 2025-10-27 Listed $175,000 MARMLS
- 2020-06-01 Listing Removed — MARMLS
- 2019-12-01 Listed $125,000 MARMLS
- 2019-10-29 Listing Removed — MARMLS
- 2019-10-26 Relisted — MARMLS
- 2019-09-27 Listing Removed — MARMLS
- 2019-09-13 Listed $125,000 MARMLS
- 2016-01-15 Sold (MLS) $75,000 Beaches MLS
- 2015-03-11 Sold (Public Records) $75,000 Public Records
- 2014-12-22 Contingent — Beaches MLS
- 2014-10-09 Price Changed $79,999 Beaches MLS
- 2014-09-12 Price Changed $80,999 Beaches MLS
- 2014-08-14 Listed $85,000 Beaches MLS
- 2013-11-12 Listing Removed — Beaches MLS
- 2013-09-22 Listing Removed — Beaches MLS
- 2006-01-26 Listed $179,900 Beaches MLS
- 1999-06-18 Listed $54,888 Beaches MLS
- 1999-03-11 Sold (Public Records) $46,000 Public Records
- 1999-02-26 Sold (MLS) $46,000 Beaches MLS
- 1999-01-18 Listing Removed — Beaches MLS
- 1998-04-21 Listed $48,500 Beaches MLS
Property tax history
+17.0%/yrLatest (2025): $2,835 · +247.3% YoY. Source: county tax records.
Cash-flow waterfall
monthlySold comps — $/sqft
last 12 mo · ≤1 miLoading sold comps…