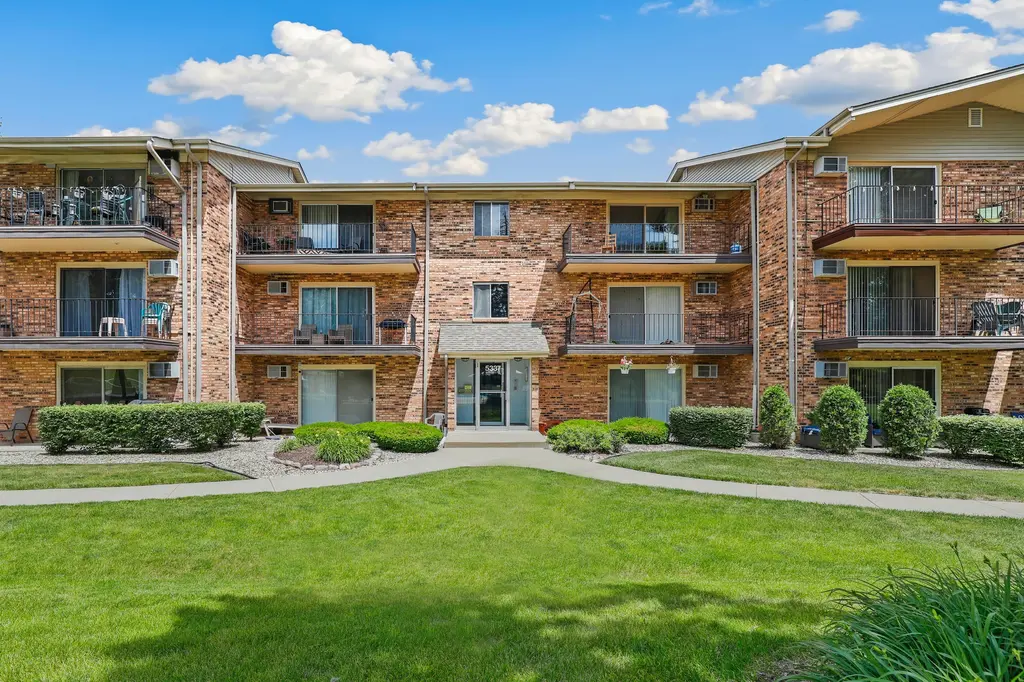
5337 Waterbury Ct #2505 · Crestwood, IL
Flood risk 1/10 · Minimal
- FEMA flood zone
- X (unshaded)
- Chance of flooding over 30 yrs
- 0.0%
- Est. flood insurance / yr
- $507 – $1,088
Fire risk 1/10 · Minimal
- Est. fire insurance / yr
- $804 – $1,492
Heat risk 3/10 · Minor
- Hot days now (above 102°F)
- 7 days/yr
- Hot days in 30 yrs
- 15 days/yr
Wind risk 2/10 · Minimal
- Chance of severe wind over 30 yrs
- —
Air-quality risk 4/10 · Minor
- Unhealthy air days now
- 4 days/yr
- Unhealthy air days in 30 yrs
- 5 days/yr
Risk factors via First Street. Map © Google.
Why this score? — see what drove the D grade
The composite is a weighted blend of 9 inputs, each scored 0–100. Each bar is that input's sub-score; the figure is the points it added to the 100-point composite (weight × sub-score).
- Cash flow +13.0/30.0
- ARV discount +7.5/15.0
- 1% rule +6.7/10.0
- Livability +4.1/5.0
- DSCR +3.9/10.0
- Rent growth +2.5/5.0
- Condition / age +2.5/5.0
- Schools +1.5/10.0
- Appreciation +0.0/10.0
$157,900
🖨 Deal sheet (PDF) 📄 Offer letter ✓ Due diligence
Listing remarks MLS
***BEST BUY IN WATERBURY***BLOW OUT PRICE!!! UNIT COMPLETELY UPDATED INCLUDING ALL NEW KITCHEN W/CUSTOM CABINETS, UPDATED BATHROOM, NEW FLOORING INCLUDING PERGO, NEW ELEC. WIRING THROUGHOUT UNIT, HUGE LIV ROOM-DIN ROOM COMBINATION, OVERSIZED BALCONY OVERLOOKING BEAUTIFUL INGROUND POOL & PARK-LIKE TREE LINED COURTYARD, GREAT VIEW! MONTHLY MAINT. INCLUDES ALL HEAT & COOKING GAS, WATER & GARBAGE, POOL & EXTERIOR MAINT.
Key facts
- Oak cabinetry
- Outdoor grilling
- Private balcony
Tags
Property features AI
Finance
- Other: Directions: From 135th St, head north on Waterbury Dr. Turn left onto Waterbury Ct; destination is on the right.
- Financial info: Special service area: No
- HOA & community: Monthly association fee of $364; Association fee includes heat, water, gas, parking, insurance, pool, exterior maintenance, lawn care, scavenger, and snow removal; Pets not allowed
Exterior
- Parking: Two parking spaces
- Utilities: Water source: Lake Michigan; Sewer: Other
- Home design: Attached single condo; Entry level: 2; Located in a 6-unit building; Estimated living area; Built approximately 41–50 years ago; Built before 1978
- Construction: Brick construction
- Exterior features: Balcony; Common lot/grounds
Interior
- Kitchen: Range; Dishwasher; Refrigerator
- Bedrooms: Master bedroom on the main level (15 x 11) with wood laminate flooring; Second bedroom on the main level (11 x 11) with wood laminate flooring; Two additional bedrooms noted (bedroom 3 and bedroom 4)
- Flooring: Laminate flooring throughout main bedroom, second bedroom, and kitchen; Carpet in living room and dining room
- Bathrooms: One full bathroom
- Heating & cooling: Baseboard heating; Wall unit(s) for cooling
- Interior features: Five total rooms; Ceiling fan(s)
- Laundry & utility: Laundry room
Neighborhood map
What this means for you Summary
Snapshot
- This is a 2-bed/1.0-bath condo listed at $158k.
Deal economics
- At list price, monthly cash flow is $-10 ($-115/yr) — negative.
- To cash-flow at today's rent, offer at most $156k (1.1% below list).
- Meets the 1% rule at list price ($2k rent vs $158k).
- Recommended offer: $156k (1.5% below list) — sets the bar for market timing.
- Cap rate 6.2% vs local median 4.9% in Crestwood — meaningfully above typical; check what's discounted (condition, days-on-market, listing class) to confirm the premium yield is real.
Location & tenants
- Location reads 82/100 on livability (#75 in IL, #1,220 nationally) — a professional / high-income tenant draw. Strengths: commute A+, cost of living A+, housing A+.
- Bremen Chsd 228 (suburban): math 15% / reading 17% proficiency, ranked #468 of 620 in IL (top 76%) — low school quality limits family demand, transient renter base, plan for 1-2y turnover.
- Zoned schools: Lee R Foster Elem School (math 27% / reading 27%, grade F, #749 of 2,056 statewide, top 40%, 395 students, 0% FRL); Jack Hille Middle School (math 20% / reading 28%, grade F, #364 of 665 statewide, top 56%, 528 students, 0% FRL); Oak Forest High School (math 26% / reading 26%, grade F, #244 of 693 statewide, top 35%, 1,370 students, 0% FRL).
- Market conditions: 30 active listings in the ZIP; 6 comparable units currently listed for rent nearby; rentals leasing fast (median 10d on market — plan ~1-2 weeks tenant-placement turnaround); 6,272 units permitted in Cook County in 2024 (4,658 in 5+ unit buildings).
Forward outlook
- Local home prices are declining (-3.0%/yr); year-one equity from $1k of loan paydown is wiped out by about $5k of value loss. Plan a longer hold.
Negotiation context
- It's been on market 17 days — a 2% lower offer ($156k) is reasonable based on typical stale-listing flexibility.
- 2 sale attempts since 19y ago with the ask held roughly flat each time — persistent listings suggest the price (not the market) is what's stuck; bring a comps-based counter.
- Current owner paid $117k; 35% above their basis — modest negotiation headroom, anchor on the comps not their cost.
Questions for the listing agent
- What do current leases actually rent for vs. the listed asking? Can we see a recent rent roll and the last 12 months of T-12 income?
- Built in 1976 — when were the roof, HVAC, electrical panel, plumbing, and water heater last replaced?
- What does the HOA fee cover, when was the last increase, and are there any pending special assessments or reserve-fund shortfalls?
- Any open or pending special assessments — roof, HVAC, plumbing, elevator, façade? What's the per-unit balance and payoff schedule, and is the seller paying it off at close or rolling it to the buyer?
- Is there a deadline driving the sale (1031 exchange, divorce, estate, relocation)? That informs how much negotiation room exists.
- Schools are D-rated, which usually means shorter tenancies and higher turnover. Who's the typical renter profile here, and what's been the actual vacancy rate?
- The area grade is low — what's the realistic commute time and amenity access for the typical tenant pool here? Any planned neighborhood developments (good or bad) we should know about?
- What's the average days-on-market for RENTAL listings here right now (not sales)? A rising rental-DOM trend means longer vacancies and softer asking-rent achievability than the comps imply.
- What's the recent tenant-quality profile in this submarket — average credit score on applications, eviction rate, late-payment / NSF rate, and stable-employment percentage? A property-management company in the area should have these aggregated.
- How much new apartment / multifamily construction is in the pipeline within 1–3 miles? Heavy new supply (>2% of stock underway) typically softens rents 12–24 months out; light construction supports rent growth.
Investment metrics
- 1% rule
- 1.17% ✓
- Cap rate
- 6.22%
- Cash-on-cash
- -0.26%
- DSCR
- 0.99
- GRM
- 7.1
CMA / ARV
No comps found within radius.
Projected returns pro-forma
-3.0% appreciation · 3.0% rent growth · sell at horizon
- IRR
- -16.5%
- Equity multiple
- 0.41×
- Total profit
- $-25,940
- Equity at exit
- $23,543
- IRR
- -8.0%
- Equity multiple
- 0.50×
- Total profit
- $-22,327
- Equity at exit
- $13,652
Cash invested: $44,212 (down + closing). Projections, not guarantees.
Landlord ↔ Tenant lean methodology
- Overall (STATE)
- 43 Moderately Tenant-Leaning
- State Illinois
- 43 Moderately Tenant-Leaning · D+7
- County
- — inherits STATE
- City
- — inherits STATE
ZIP-level market 60418
- Active inventory
- 30
- Price-to-rent
- 7.1×
Monthly cashflow live
- Estimated rent
- $1,844 high interval (Pro) →
- Mortgage (P&I)
- −$828
- Tax from tax record
- −$208 /mo · $2,501/yr
- Insurance
- −$66
- HOA
- −$364
- Vacancy / Maint / Mgmt
- −$387
- Net cashflow
- $-10
Break-even live
Sensitivity live
| Price | -10% $80 | -5% $35 | +0% $-10 | +5% $-54 | +10% $-99 |
|---|---|---|---|---|---|
| Rent | -10% $-155 | -5% $-82 | +0% $-10 | +5% $63 | +10% $136 |
| Rate | -1.0pp $70 | -0.5pp $31 | base $-10 | +0.5pp $-51 | +1.0pp $-92 |
UW: 25.0% down · 7.5% · 30yr · 1.5% tax · 5.0% vac · 8.0% maint · 8.0% mgmt
Financing live
Cash to close
- Down payment
- $39,475
- Closing costs
- $4,737
- Reserves months
- —
- Total cash needed
- —
Loan-product check · same deal, 3 products live
Conventional
25% down · 7.5% · 30yr
- Down + closing
- —
- Monthly P&I
- —
- Monthly cashflow
- —
- DSCR
- —
- Eligible?
- —
Personal DTI + credit; lowest rate.
DSCR
20% down · 8.5% · 30yr
- Down + closing
- —
- Monthly P&I
- —
- Monthly cashflow
- —
- DSCR
- —
- Eligible?
- —
No personal income docs; deal must DSCR.
Hard money
10% down · 12.0% · 12mo
- Down + closing
- —
- Monthly P&I
- —
- Monthly cashflow
- —
- DSCR
- —
- Eligible?
- —
Short-term bridge; refi at stabilization.
Rent comps 6 comps
| Address | Beds | Baths | Sqft | Rent | $/sqft | DOM | Units | Dist |
|---|---|---|---|---|---|---|---|---|
| 14033 Laramie Ave #408 Crestwood, IL | 2.0 | 2.0 | 1100 | $2,100 | $1.91 | 9d | 1 | 0.26mi |
| 13615 Royal Ct #309 Crestwood, IL | 2.0 | 2.0 | 1000 | $1,850 | $1.85 | 5d | 1 | 0.78mi |
| 14700 Central Ave Oak Forest, IL | 1.0–2.0 | 1.0 | 775 | $1,605 | $2.07 | 26d | 6 | 0.97mi |
| 14643 Lamon Ave Unit 2B Midlothian, IL | 2.0 | 1.5 | 990 | $1,525 | $1.54 | 26d | 1 | 1.06mi |
| 15800 S Ridgeland Ave Unit 301 Oak Forest, IL | 2.0 | 1.0 | 1000 | $1,500 | $1.50 | 7d | 1 | 1.40mi |
| 5723 129th St Crestwood, IL | 2.0 | 1.0 | 950 | $1,600 | $1.68 | 0d | 1 | 1.40mi |
HOA detail condo
- Monthly dues
- $364 · $4,368/yr
- Likely covers
- watertrashgaspool
- Assessments
- None detected in remarks — confirm with the listing agent.
Listing history 11 events
-
2026-06-21days on market $157,900 Active 17 DOM
-
2026-06-18days on market $157,900 Active 14 DOM
-
2026-06-17days on market $157,900 Active 13 DOM
-
2026-06-16days on market $157,900 Active 12 DOM
-
2026-06-15days on market $157,900 Active 11 DOM
-
2026-06-13days on market $157,900 Active 9 DOM
-
2026-06-09days on market $157,900 Active 5 DOM
-
2026-06-08statusdays on market $157,900 Active 4 DOM
-
2026-06-08status $157,900 Contingent - Continue to Show 3 DOM
-
2026-06-07remarks 699-char remark
-
2026-06-07$157,900 Active 3 DOM
ⓘ Source: listings_history table (triggers on properties + properties_extension) + one-shot
backfill from property_details.listing_events for pre-trigger history.
Tax reassessment forecast IL · Partial reset (capped growth)
- Current annual tax
- $2,501 · $208/mo
- Projected year-2 tax
- $3,042 · $254/mo
- Expected delta
- +$542/yr (+$45/mo · 21.7%)
ⓘ Screening estimate from a state-policy table — verify with the county assessor before closing.
Climate risk First Street
- Flood 1/10 Low FEMA zone X (unshaded) · 0% chance over 30 yrs
- Wildfire 1/10 Low
- Heat 3/10 Moderate 7 d/yr ≥102°F today · 15 d/yr by 30 yrs out
- Wind 2/10 Low
- Air quality 4/10 Moderate 4 unhealthy d/yr today · 5 by 30 yrs out
Nearby sold comps map
Loading sold comps map…
Walkable amenities ~0.75 mi
Loading nearby amenities…
Taxation est. · year 1
- Rental income
- $22,126
- − Mortgage interest
- −$8,845
- − Property taxes
- −$2,501
- − Insurance
- −$790
- − Repairs & maintenance
- −$1,770
- − Management
- −$1,770
- − HOA
- −$4,368
- − Depreciation
- −$4,593
- Taxable loss
- −$2,511
- Est. tax savings @ 24.0%
- +$603
- After-tax cash flow
- $487/yr
For passive investors: Depreciation is non-cash, so a rental often shows a tax loss while cash-flowing — sheltering income. Rental losses are passive: they offset passive income freely, and up to $25,000/yr can offset ordinary (W-2) income if you actively participate and your MAGI is under $100k (phasing out to $0 by $150k); unused losses carry forward. On sale, claimed depreciation is recaptured at up to 25%, and gains may owe capital-gains tax (a 1031 exchange can defer both). Figures are a year-1 estimate at your 24.0% rate — not tax advice; consult a CPA.
Schools (NCES district)
- District
- Bremen Chsd 228
- NCES district ID
- 1707050
- Math proficiency
- 15% ▼ -4.00%
- Reading proficiency
- 17% ▼ -5.00%
- Median HH income
- $57,625
- Composite
- 15.32/100
- National rank
- #9327
- State rank
- #468 of 620 in IL
Livability — Crestwood
- Score
- 82/100
- State rank
- #75
- US rank
- #1220
Category grades
Schools grade is shown separately in the Schools card above.
Census & demographics
- Census place
- Crestwood, IL
- City population
- 10,631
- Population (ZIP)
- 10,631
Population outlook (Cook County) Hauer SSP2
- Today (2025)
- 5,347,519 people
- By 2030
- 5,357,703 · +0.2%
- By 2040
- 5,324,924 · -0.4%
- By 2050
- 5,230,762 · -2.2%
- By 2075
- 4,785,735 · -10.5%
- By 2100
- 4,188,836 · -21.7%
Race, ethnicity, and origin ACS 2023
- Neighborhood character
- Predominantly White (69%)
- Race & ethnicity
- White 69% Hispanic / Latino 15% Black 12% Two or more races 7% Asian 2%
- Hispanic origin (detail)
- Mexican 13% Puerto Rican 1%
- Common ancestry
- Romanian 13% Iranian 1% Armenian 1%
- Foreign-born
- 12% · Canada
- Languages at home
- 82% English-only · Spanish 11% Arabic 2% Russian/Polish/Slavic 2%
Political lean MEDSL · Cook
- 2024 margin
- Solid D (+42.0) · D 70.4% · R 28.4% · Other 1.2%
- 2008→2024 swing
- -11.4pp toward R · 2008: 53.4pp · 2024: 42.0pp
- All cycles
- 2024: D+42.0 2020: D+50.3 2016: D+53.0 2012: D+49.4 2008: D+53.4
Not yet ingested
- Civics
- —
Market trends
- HPI YoY
- ▼ -205.44%
- Current HPI
- 105.796
- Rent YoY
- —
- Metro
- —
- State GDP YoY
- ▲ 1.59%
- F500 in state
- 60
Industry mix (Fortune 500 HQ in IL)
| Industry | F500 HQs | Revenue |
|---|---|---|
| Insurance | 4 | $201B |
|
||
| Consumer Goods | 4 | $87B |
|
||
| Industrial Machinery | 3 | $64B |
|
||
| Healthcare | 2 | $55B |
|
||
| Retail / Pharmacy | 1 | $148B |
|
||
| Agriculture / Food | 1 | $86B |
|
||
Price history
+254.8% since first listed7 events — show timeline
- 2026-06-04 Listed $157,900 MRED as Distributed by MLS Grid
- 2008-04-10 Sold (Public Records) $117,000 Public Records
- 2008-04-04 Sold (MLS) $117,000 MRED as Distributed by MLS Grid
- 2008-02-22 Listing Removed — MRED as Distributed by MLS Grid
- 2007-08-15 Listed $119,900 MRED as Distributed by MLS Grid
- 1993-01-14 Sold (Public Records) $57,000 Public Records
- 1983-12-21 Sold (Public Records) $44,500 Public Records
Property tax history
+3.4%/yrLatest (2023): $2,501 · +19.5% YoY. Source: county tax records.
Cash-flow waterfall
monthlySold comps — $/sqft
last 12 mo · ≤1 miLoading sold comps…