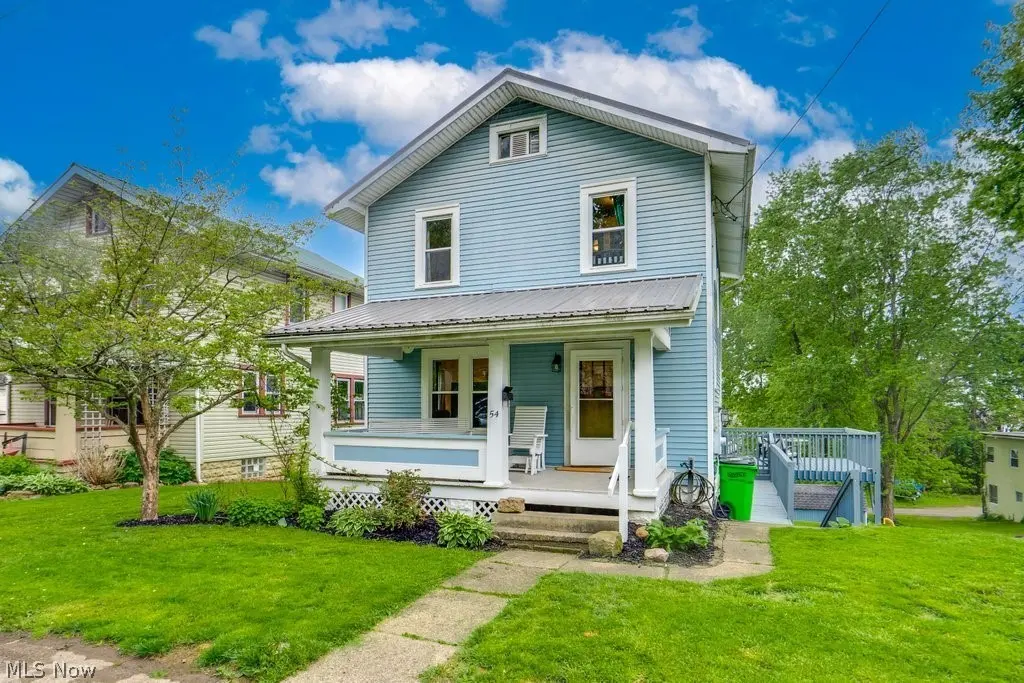
54 S School St · Millersburg, OH
Flood risk 1/10 · Minimal
- FEMA flood zone
- X (unshaded)
- Chance of flooding over 30 yrs
- 0.0%
- Est. flood insurance / yr
- $473 – $860
Fire risk 2/10 · Minimal
- Est. fire insurance / yr
- $713 – $1,323
Heat risk 3/10 · Minor
- Hot days now (above 98°F)
- 7 days/yr
- Hot days in 30 yrs
- 18 days/yr
Wind risk 2/10 · Minimal
- Chance of severe wind over 30 yrs
- 0.0%
Air-quality risk 2/10 · Minimal
- Unhealthy air days now
- 0 days/yr
- Unhealthy air days in 30 yrs
- 1 days/yr
Risk factors via First Street. Map © Google.
Why this score? — see what drove the F grade
The composite is a weighted blend of 9 inputs, each scored 0–100. Each bar is that input's sub-score; the figure is the points it added to the 100-point composite (weight × sub-score).
- Appreciation +10.0/10.0
- Cash flow +6.3/30.0
- Schools +5.2/10.0
- Livability +3.6/5.0
- Rent growth +2.5/5.0
- Condition / age +2.5/5.0
- ARV discount +0.8/15.0
- 1% rule +0.6/10.0
- DSCR +0.6/10.0
$215,000
🖨 Deal sheet 📄 Offer letter ✓ Due diligence
Listing remarks
Fall in love with the perfect blend of historic character and modern convenience. This 4-bedroom, 2-bath gem welcomes you with beautifully restored hardwood floors that shine throughout the main level. The formal dining room has elegant French doors that open to a sun-drenched bonus living space. The updated kitchen is ready for the home chef, featuring contemporary finishes. The upstairs has three spacious bedrooms and a full bath, or head to the versatile lower level. This walk-out basement includes a cozy recreation room, a fourth bedroom with natural light, and a second full bath—ideal for a guest suite or private office. Outside, the expansive backyard and large deck offers plent
Key facts
- Large deck
- French doors
- Walk-out basement
Tags
Property features AI
Exterior
- Parking: On-street parking
- Utilities: Public water; Public sewer
- Home design: 2-story property
- Construction: Vinyl siding; Asphalt fiberglass roof
- Exterior features: Front porch; Lot approximately 0.29 acres
Interior
- Kitchen: Dishwasher; Range; Refrigerator
- Bathrooms: 2 full bathrooms
- Heating & cooling: Forced air gas heating; Central air conditioning
- Interior features: Finished basement with walk-out access
- Laundry & utility: Laundry in basement
Neighborhood map
What this means for you Summary
Snapshot
- This is a 3-bed/2.0-bath single-family listed at $215k.
Deal economics
- At list price, monthly cash flow is $-385 ($-5k/yr) — negative.
- To cash-flow at today's rent, offer at most $147k (31.6% below list).
- To meet the 1% rule (rent ≥ 1% of price), the offer needs to be $120k (44.4% below list).
- Recommended offer: $120k (44.4% below list) — sets the bar for 1% rule.
Location & tenants
- Location reads 71/100 on livability (#445 in OH) — a middle-class / working-renter tenant base. Strengths: cost of living A+, housing A+, crime A; Watch: employment D+, amenities F, commute F.
- West Holmes Local (rural): math 60% / reading 62% proficiency, ranked #283 of 656 in OH (top 43%) — acceptable for families but not a draw, mixed tenant base, ~2y average lease.
- Market conditions: 61 active listings in the ZIP; solid renter incomes; 8 units permitted in Holmes County in 2024 (0 in 5+ unit buildings).
Forward outlook
- In year one you build about $23k of equity ($1k loan paydown + $22k appreciation (10.0% local appreciation)).
- Holmes County population projected to shrink 4% by 2050 — rents likely to lag national; underwrite the cash flow, not the appreciation.
- By year 2, paydown + projected appreciation supports a ~$37k cash-out refi (75% LTV) — recoverable capital for the next deal without selling this one.
Negotiation context
- Only 2 days on market — expect competitive offers; lowballing is unlikely to land.
- Current owner paid $150k; 43% above their basis — modest negotiation headroom, anchor on the comps not their cost.
Risks & watch-outs
- Watch-outs: built in 1935 — expect roof / HVAC / electrical / plumbing capex.
Questions for the listing agent
- What do current leases actually rent for vs. the listed asking? Can we see a recent rent roll and the last 12 months of T-12 income?
- Built in 1935 — when were the roof, HVAC, electrical panel, plumbing, and water heater last replaced?
- Is there a deadline driving the sale (1031 exchange, divorce, estate, relocation)? That informs how much negotiation room exists.
- Schools are B-rated — typically a magnet for longer-tenancy family renters. What's the average tenant stay here, and is there a school-zone premium baked into asking?
- The area grade is low — what's the realistic commute time and amenity access for the typical tenant pool here? Any planned neighborhood developments (good or bad) we should know about?
- What's the average days-on-market for RENTAL listings here right now (not sales)? A rising rental-DOM trend means longer vacancies and softer asking-rent achievability than the comps imply.
- What's the recent tenant-quality profile in this submarket — average credit score on applications, eviction rate, late-payment / NSF rate, and stable-employment percentage? A property-management company in the area should have these aggregated.
- How much new for-sale + rental construction is in the pipeline within 1–3 miles? Heavy new supply typically softens prices + rents 12–24 months out; constrained supply supports both.
Investment metrics
- 1% rule
- 0.56% ✗
- Cap rate
- 4.15%
- Cash-on-cash
- -7.67%
- DSCR
- 0.66
- GRM
- 15.0
CMA / ARV
- ARV (on-the-fly)
- $187,176
- Comps found
- 11
Show comp detail 11 sales within ~0.75 mi
| Address | Dist | Beds/Ba | Sqft | Sold | Price | $/sf | Match |
|---|---|---|---|---|---|---|---|
| 910 Fairview Ave | 0.06mi | 3/1.0 | 1,344 (-5%) | 2mo | $140,000 | $104 | 83 |
| 284 S Alexander St | 0.13mi | 3/1.5 | 1,344 (-5%) | 10mo | $236,000 | $176 | 75 |
| 733 Critchfield St | 0.53mi | 3/2.0 | 1,434 (+1%) | 4mo | $130,000 | $91 | 71 |
| 46 S Crawford St | 0.13mi | 4/1.0 (+1) | 1,624 (+14%) | 2mo | $165,000 | $102 | 59 |
| 17 Cliff Ln | 0.38mi | 3/2.5 | 1,322 (-7%) | 14mo | $282,500 | $214 | 57 |
| 120 Miller Dr | 0.34mi | 2/2.0 (-1) | 1,350 (-5%) | 18mo | $200,000 | $148 | 56 |
| 622 Elm St | 0.60mi | 3/2.0 | 1,288 (-9%) | 4mo | $255,000 | $198 | 54 |
| 898 E Jackson St | 0.49mi | 3/1.0 | 1,328 (-6%) | 12mo | $95,000 | $72 | 53 |
| 102 Brambly Hedge Dr | 0.27mi | 2/2.0 (-1) | 1,214 (-14%) | 13mo | $160,000 | $132 | 47 |
| 609 S Washington St | 0.42mi | 3/1.5 | 1,292 (-9%) | 22mo | $155,000 | $120 | 45 |
| 208 Northern Dr | 0.70mi | 3/2.5 | 1,236 (-13%) | 2mo | $306,000 | $248 | 42 |
Match score weights: distance 35% · size 25% · config 20% · recency 20%. Top-matched comps best support the ARV.
Projected returns pro-forma
10.0% appreciation · 3.0% rent growth · sell at horizon
- IRR
- 18.9%
- Equity multiple
- 2.54×
- Total profit
- $92,515
- Equity at exit
- $193,689
- IRR
- 17.5%
- Equity multiple
- 5.84×
- Total profit
- $291,554
- Equity at exit
- $417,698
Cash invested: $60,200 (down + closing). Projections, not guarantees.
Landlord ↔ Tenant lean methodology
- Overall (STATE)
- 73 Landlord-Friendly
- State Ohio
- 73 Landlord-Friendly · R+6
- County
- — inherits STATE
- City
- — inherits STATE
ZIP-level market 44654
- Home prices YoY
- 4.3%
- Active inventory
- 61
- Price-to-rent
- 15.0×
Monthly cashflow live
- Estimated rent
- $1,196 medium interval (Pro) →
- Mortgage (P&I)
- −$1,127
- Tax from tax record
- −$112 /mo · $1,346/yr
- Insurance
- −$90
- HOA
- −$0
- Vacancy / Maint / Mgmt
- −$251
- Net cashflow
- $-385
Break-even live
UW: 25.0% down · 7.5% · 30yr · 1.5% tax · 5.0% vac · 8.0% maint · 8.0% mgmt
Financing live
Cash to close
- Down payment
- $53,750
- Closing costs
- $6,450
- Reserves months
- —
- Total cash needed
- —
Loan-product check · same deal, 3 products live
Conventional
25% down · 7.5% · 30yr
- Down + closing
- —
- Monthly P&I
- —
- Monthly cashflow
- —
- DSCR
- —
- Eligible?
- —
Personal DTI + credit; lowest rate.
DSCR
20% down · 8.5% · 30yr
- Down + closing
- —
- Monthly P&I
- —
- Monthly cashflow
- —
- DSCR
- —
- Eligible?
- —
No personal income docs; deal must DSCR.
Hard money
10% down · 12.0% · 12mo
- Down + closing
- —
- Monthly P&I
- —
- Monthly cashflow
- —
- DSCR
- —
- Eligible?
- —
Short-term bridge; refi at stabilization.
Listing history 5 events
-
2026-05-06status Pending
-
2026-05-03$215,000 Active
-
2023-09-11soldstatus $150,000
-
2001-07-31soldstatus $78,500
-
2000-10-04soldstatus $78,000
ⓘ Source: listings_history table (triggers on properties + properties_extension) + one-shot
backfill from property_details.listing_events for pre-trigger history.
Tax reassessment forecast OH · Partial reset (capped growth)
- Current annual tax
- $1,346 · $112/mo
- Projected year-2 tax
- $2,350 · $196/mo
- Expected delta
- +$1,004/yr (+$84/mo · 74.6%)
ⓘ Screening estimate from a state-policy table — verify with the county assessor before closing.
Climate risk First Street
- Flood 1/10 Low FEMA zone X (unshaded) · 0% chance over 30 yrs
- Wildfire 2/10 Low
- Heat 3/10 Moderate 7 d/yr ≥98°F today · 18 d/yr by 30 yrs out
- Wind 2/10 Low 0% chance of damaging wind over 30 yrs
- Air quality 2/10 Low 0 unhealthy d/yr today · 1 by 30 yrs out
Nearby sold comps map
Loading sold comps map…
Walkable amenities ~0.75 mi
Loading nearby amenities…
Taxation est. · year 1
- Rental income
- $14,347
- − Mortgage interest
- −$12,043
- − Property taxes
- −$1,346
- − Insurance
- −$1,075
- − Repairs & maintenance
- −$1,148
- − Management
- −$1,148
- − Depreciation
- −$6,255
- Taxable loss
- −$8,667
- Est. tax savings @ 24.0%
- +$2,080
- After-tax cash flow
- $-2,536/yr
For passive investors: Depreciation is non-cash, so a rental often shows a tax loss while cash-flowing — sheltering income. Rental losses are passive: they offset passive income freely, and up to $25,000/yr can offset ordinary (W-2) income if you actively participate and your MAGI is under $100k (phasing out to $0 by $150k); unused losses carry forward. On sale, claimed depreciation is recaptured at up to 25%, and gains may owe capital-gains tax (a 1031 exchange can defer both). Figures are a year-1 estimate at your 24.0% rate — not tax advice; consult a CPA.
Schools (NCES district)
- District
- West Holmes Local
- NCES district ID
- 3904769
- Math proficiency
- 60% ▼ -12.00%
- Reading proficiency
- 62% ▼ -7.00%
- Median HH income
- $46,531
- Composite
- 51.57/100
- National rank
- #1711
- State rank
- #283 of 656 in OH
Livability — Millersburg
- Score
- 71/100
- State rank
- #445
- US rank
- #7306
Category grades
Schools grade is shown separately in the Schools card above.
Census & demographics
- Census place
- Millersburg, OH
- County
- Holmes · 38,872 people
- Population (ZIP)
- 20,329
- Household income
- $75,195
- Rent vs Own
- Severe rent burden
- 4.3
Population outlook (Holmes County) Hauer SSP2
- Today (2025)
- 44,801 people
- By 2030
- 45,021 · +0.5%
- By 2040
- 44,857 · +0.1%
- By 2050
- 43,040 · -3.9%
- By 2075
- 33,122 · -26.1%
- By 2100
- 17,241 · -61.5%
Race, ethnicity, and origin ACS 2023
- Neighborhood character
- Predominantly White (97%)
- Race & ethnicity
- White 97% Hispanic / Latino 1%
- Common ancestry
- Polish 9% Italian 3% Lithuanian 2%
- Foreign-born
- 1%
- Languages at home
- 54% English-only · German/W. Germanic 45%
Political lean MEDSL · Holmes
- 2024 margin
- Solid R (+69.2) · D 15.0% · R 84.2%
- 2008→2024 swing
- -27.9pp toward R · 2008: -41.2pp · 2024: -69.2pp
- All cycles
- 2024: R+69.2 2020: R+68.0 2016: R+62.9 2012: R+52.8 2008: R+41.2
Not yet ingested
- Civics
- —
Market trends
- HPI YoY
- ▲ 11.03%
- Current HPI
- 268.0336
- Rent YoY
- —
- Metro
- —
- State GDP YoY
- ▲ 1.98%
- F500 in state
- 48
Industry mix (Fortune 500 HQ in OH)
| Industry | F500 HQs | Revenue |
|---|---|---|
| Insurance | 3 | $145B |
|
||
| Industrial Machinery | 3 | $49B |
|
||
| Financial Services | 3 | $24B |
|
||
| Consumer Goods | 2 | $93B |
|
||
| Aerospace / Defense | 2 | $47B |
|
||
| Utilities | 2 | $33B |
|
||
Price history
+175.6% since first listed5 events — show timeline
- 2026-05-06 Pending — MLSNOW
- 2026-05-03 Listed $215,000 MLSNOW
- 2023-09-11 Sold (Public Records) $150,000 Public Records
- 2001-07-31 Sold (Public Records) $78,500 Public Records
- 2000-10-04 Sold (Public Records) $78,000 Public Records
Property tax history
+2.3%/yrLatest (2025): $1,346 · +0.0% YoY. Source: county tax records.
Cash-flow waterfall
monthlySold comps — $/sqft
last 12 mo · ≤1 miLoading sold comps…