 🔨 Auction
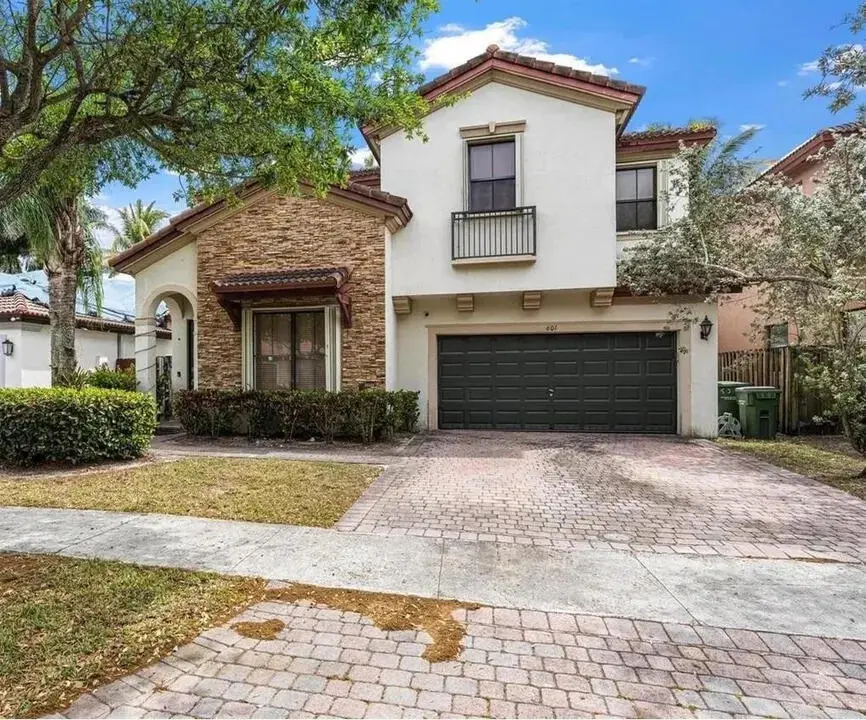
601 SE 37th Pl · Homestead, FL
Flood risk 6/10 · Moderate
- FEMA flood zone
- AH
- Chance of flooding over 30 yrs
- 0.7%
- Est. flood insurance / yr
- $1,142 – $2,507
Fire risk 1/10 · Minimal
- Est. fire insurance / yr
- $947 – $1,759
Heat risk 10/10 · Severe
- Hot days now (above 105°F)
- 7 days/yr
- Hot days in 30 yrs
- 32 days/yr
Wind risk 10/10 · Severe
- Chance of severe wind over 30 yrs
- 99.0%
Air-quality risk 2/10 · Minimal
- Unhealthy air days now
- 1 days/yr
- Unhealthy air days in 30 yrs
- 1 days/yr
Risk factors via First Street. Map © Google.
Why this score? — see what drove the F grade
The composite is a weighted blend of 9 inputs, each scored 0–100. Each bar is that input's sub-score; the figure is the points it added to the 100-point composite (weight × sub-score).
- ARV discount +7.5/15.0
- Cash flow +5.6/30.0
- Schools +4.2/10.0
- Livability +3.9/5.0
- Condition / age +2.5/5.0
- Rent growth +1.8/5.0
- 1% rule +1.1/10.0
- DSCR +0.0/10.0
- Appreciation +0.0/10.0
$5,000
🖨 Deal sheet 📄 Offer letter ✓ Due diligence
Listing remarks
Foreclosure Auction Ends June 3, 2026 at 9:00 AM EST. Explore this charming 4-bedroom, 2-bath residence set in a peaceful and well-located Homestead community. The list price is the opening bid for the online auction. Sold As-is. Explore more details and submit your bid through Federa Home App.
Key facts
- 5,000 sq ft lot
- Built 2007
- Listed 8 days
Property features AI
Finance
- Other: Land size: Less than 1/4 acre; Subdivision: Other (999.9); Location side: Bay/Gulf
- Financial info: Property listed for auction
- HOA & community: No association fee; Association fee covers: Other; No first right of refusal; Pets: see remarks; Rentals not allowed; No deed restrictions
Exterior
- Utilities: Utilities: Other — see remarks
- Home design: Other property type/zoning; Built in 2007; Above flood: No
- Construction: Other construction
- Exterior features: No waterfront; No waterview; Dockage: other dockage
Interior
- Bedrooms: 4 bedrooms
- Bathrooms: 2 full bathrooms
- Interior features: Other appliances (see remarks)
Neighborhood map
What this means for you Summary
Snapshot
- This is a 4-bed/2.0-bath single-family listed at $5k.
Deal economics
- At list price, monthly cash flow is $-1k ($-17k/yr) — negative.
- The deal already cash-flows at list — no discount required.
- Meets the 1% rule at list price ($4k rent vs $5k).
Location & tenants
- Location reads 78/100 on livability (#158 in FL, #2,408 nationally) — a middle-class / working-renter tenant base. Strengths: commute A+, housing A+, health & safety A+; Watch: employment C-.
- Miami-Dade (suburban): math 45% / reading 54% proficiency, ranked #40 of 73 in FL (top 55%) — families likely to look elsewhere, expect single-tenant / working-renter base with shorter leases; 64% free/reduced lunch — lower-income household profile, screen leases tightly.
- Market conditions: Rents soft (-2.9%/yr); 612 active listings in the ZIP; 40 comparable units currently listed for rent nearby; rentals at typical pace (median 25d on market — plan ~3-4 weeks tenant-placement turnaround); 10,051 units permitted in Miami-Dade County in 2024 (7,758 in 5+ unit buildings).
- At $3,541/mo this rent would consume 90% of the median local household income ($47k/yr) (locally 1516% of renters already pay >50% of income on rent) — very limited rent-growth headroom before tenants either downsize or default.
Forward outlook
- Local home prices are declining (-3.0%/yr); year-one equity from $4k of loan paydown is wiped out by about $17k of value loss. Plan a longer hold.
- Miami-Dade County population projected at +28% by 2050 — long-run rental-demand tailwind backs the buy-and-hold thesis.
Negotiation context
- Only 9 days on market — expect competitive offers; lowballing is unlikely to land.
- 2 sale attempts with the ask held roughly flat each time — persistent listings suggest the price (not the market) is what's stuck; bring a comps-based counter.
Risks & watch-outs
- Watch-outs: property tax is 174.8% of price; flood insurance adds $152/mo.
- Climate carrying-cost: in FEMA flood zone AH (mandatory federal flood insurance); severe wind risk, 99% chance of damaging wind over 30y; extreme-heat days projected 7→32/yr by 2055 (HVAC capex compounding) — expect insurance premiums to compound above CPI over the hold.
Questions for the listing agent
- What do current leases actually rent for vs. the listed asking? Can we see a recent rent roll and the last 12 months of T-12 income?
- Property tax is high relative to price — has the assessment been appealed recently, and will the sale trigger a re-assessment?
- What's the actual annual flood-insurance premium (NFIP or private), and is the property in a SFHA with mandatory coverage?
- Is there a deadline driving the sale (1031 exchange, divorce, estate, relocation)? That informs how much negotiation room exists.
- Schools are B-rated — typically a magnet for longer-tenancy family renters. What's the average tenant stay here, and is there a school-zone premium baked into asking?
- The area grade is low — what's the realistic commute time and amenity access for the typical tenant pool here? Any planned neighborhood developments (good or bad) we should know about?
- What's the average days-on-market for RENTAL listings here right now (not sales)? A rising rental-DOM trend means longer vacancies and softer asking-rent achievability than the comps imply.
- What's the recent tenant-quality profile in this submarket — average credit score on applications, eviction rate, late-payment / NSF rate, and stable-employment percentage? A property-management company in the area should have these aggregated.
- How much new for-sale + rental construction is in the pipeline within 1–3 miles? Heavy new supply typically softens prices + rents 12–24 months out; constrained supply supports both.
Investment metrics
- 1% rule
- 0.61% ✗
- Cap rate
- 3.76%
- Cash-on-cash
- -9.04%
- DSCR
- 0.60
- GRM
- 13.7
CMA / ARV
- ARV (on-the-fly)
- $582,660
- Comps found
- 2
Show comp detail 2 sales within ~0.75 mi
| Address | Dist | Beds/Ba | Sqft | Sold | Price | $/sf | Match |
|---|---|---|---|---|---|---|---|
| 3517 SE 4th St | 0.18mi | 4/3.0 | 2,267 (-3%) | 15mo | $565,000 | $249 | 70 |
| 706 SE 34th Ave | 0.31mi | 5/2.5 (+1) | 2,492 (+6%) | 22mo | $565,000 | $227 | 49 |
Match score weights: distance 35% · size 25% · config 20% · recency 20%. Top-matched comps best support the ARV.
Projected returns pro-forma
-3.0% appreciation · 0.0% rent growth · sell at horizon
- IRR
- -38.1%
- Equity multiple
- -0.18×
- Total profit
- $-192,623
- Equity at exit
- $86,877
- IRR
- -80.6%
- Equity multiple
- -0.96×
- Total profit
- $-320,524
- Equity at exit
- $50,378
Cash invested: $163,145 (down + closing). Projections, not guarantees.
Landlord ↔ Tenant lean methodology
- Overall (STATE)
- 87 Strongly Landlord-Friendly
- State Florida
- 87 Strongly Landlord-Friendly · R+3
- County
- — inherits STATE
- City
- — inherits STATE
ZIP-level market 33034
- Home prices YoY
- -5.9%
- Rents YoY
- -2.9%
- Active inventory
- 612
- Price-to-rent
- 0.1×
Monthly cashflow live
- Estimated rent
- $3,541 high interval (Pro) →
- Mortgage (P&I)
- −$3,056
- Tax est. 1.5%
- −$728 /mo · $8,740/yr
- Insurance
- −$243
- Flood insurance flood zone
- −$152 /mo · $1,824/yr
- HOA
- −$0
- Vacancy / Maint / Mgmt
- −$744
- Net cashflow
- $-1,381
Break-even live
UW: 25.0% down · 7.5% · 30yr · 1.5% tax · 5.0% vac · 8.0% maint · 8.0% mgmt
Financing live
Cash to close
- Down payment
- $145,665
- Closing costs
- $17,480
- Reserves months
- —
- Total cash needed
- —
Loan-product check · same deal, 3 products live
Conventional
25% down · 7.5% · 30yr
- Down + closing
- —
- Monthly P&I
- —
- Monthly cashflow
- —
- DSCR
- —
- Eligible?
- —
Personal DTI + credit; lowest rate.
DSCR
20% down · 8.5% · 30yr
- Down + closing
- —
- Monthly P&I
- —
- Monthly cashflow
- —
- DSCR
- —
- Eligible?
- —
No personal income docs; deal must DSCR.
Hard money
10% down · 12.0% · 12mo
- Down + closing
- —
- Monthly P&I
- —
- Monthly cashflow
- —
- DSCR
- —
- Eligible?
- —
Short-term bridge; refi at stabilization.
Rent comps 40 comps
| Address | Beds | Baths | Sqft | Rent | $/sqft | DOM | Units | Dist |
|---|---|---|---|---|---|---|---|---|
| 516 SE 35 Ave Homestead, FL | 4.0 | 3.5 | 3022 | $3,900 | $1.29 | 24d | 1 | 0.18mi |
| 3616 SE 2nd Dr Homestead, FL | 5.0 | 4.0 | 2742 | $4,500 | $1.64 | 24d | 1 | 0.19mi |
| 3616 SE 2nd Dr Homestead, FL | 4.0 | 3.0 | 2267 | $3,500 | $1.54 | 8d | 1 | 0.19mi |
| 709 SE 35 Ave Unit 709 Homestead, FL | 4.0 | 3.5 | 2954 | $3,800 | $1.29 | 19d | 1 | 0.21mi |
| 581 SE 34th Ter Homestead, FL | 3.0 | 2.5 | 2031 | $2,950 | $1.45 | 21d | 1 | 0.24mi |
| 581 SE 34th Ter Homestead, FL | 3.0 | 2.5 | 2031 | $2,950 | $1.45 | 8d | 1 | 0.24mi |
| 191 SE 35 Ave Homestead, FL | 5.0 | 3.0 | 3196 | $4,230 | $1.32 | 15d | 1 | 0.28mi |
| 191 SE 35th Ave Homestead, FL | 5.0 | 3.5 | 3196 | $4,230 | $1.32 | 15d | 1 | 0.28mi |
| 3763 SE 2nd St Homestead, FL | 3.0 | 2.5 | 1650 | $2,600 | $1.58 | 24d | 1 | 0.29mi |
| 422 SE 34th Ter Unit 422 Homestead, FL | 5.0 | 3.0 | 2916 | $4,500 | $1.54 | 24d | 1 | 0.30mi |
| 141 SE 34th Ter Homestead, FL | 3.0 | 2.5 | 1642 | $2,600 | $1.58 | 24d | 1 | 0.38mi |
| 101 NE 37th Pl Homestead, FL | 3.0 | 2.5 | 1632 | $2,800 | $1.72 | 14d | 1 | 0.40mi |
| 3488 NE 1st St Unit 3488 Homestead, FL | 3.0 | 2.5 | 1876 | $3,100 | $1.65 | 24d | 1 | 0.42mi |
| 220 SE 32nd Ter Homestead, FL | 4.0 | 2.0 | 1762 | $3,900 | $2.21 | 24d | 1 | 0.51mi |
| 216 SE 32nd Ter Homestead, FL | 3.0 | 2.0 | 1581 | $3,286 | $2.08 | 16d | 1 | 0.51mi |
| 215 SE 32nd Ave Homestead, FL | 4.0 | 3.0 | 3058 | $3,300 | $1.08 | 24d | 1 | 0.53mi |
| 343 NE 36th Ter Homestead, FL | 3.0 | 2.5 | 2346 | $3,300 | $1.41 | 24d | 1 | 0.55mi |
| 343 NE 36th Ter Homestead, FL | 3.0 | 2.5 | 2346 | $3,600 | $1.53 | 8d | 1 | 0.55mi |
| 657 SE 31st Ave Unit 657 Homestead, FL | 4.0 | 3.0 | 2058 | $5,000 | $2.43 | 15d | 1 | 0.55mi |
| 349 NE 36th Ter Homestead, FL | 4.0 | 2.0 | 2322 | $3,300 | $1.42 | 24d | 1 | 0.56mi |
| 3072 SE 5th Dr Homestead, FL | 5.0 | 2.5 | 2380 | $3,650 | $1.53 | 24d | 1 | 0.58mi |
| 363 NE 35th Ter Homestead, FL | 5.0 | 3.0 | 2170 | $4,100 | $1.89 | 8d | 1 | 0.59mi |
| 354 NE 35th Ave Homestead, FL | 4.0 | 2.5 | 1762 | $4,700 | $2.67 | 24d | 1 | 0.61mi |
| 165 NE 32nd Ter Homestead, FL | 3.0 | 3.0 | 2336 | $3,100 | $1.33 | 24d | 1 | 0.63mi |
| 3641 NE 4th St Homestead, FL | 5.0 | 2.5 | 2693 | $3,600 | $1.34 | 24d | 1 | 0.64mi |
| 174 NE 32nd Ter #174 Homestead, FL | 4.0 | 2.0 | 2818 | $3,150 | $1.12 | 24d | 1 | 0.65mi |
| 379 NE 34th Ave Homestead, FL | 5.0 | 3.0 | 2170 | $3,300 | $1.52 | 22d | 1 | 0.65mi |
| 181 NE 30th Pl Homestead, FL | 3.0 | 2.0 | 2437 | $2,406 | $0.99 | 4d | 1 | 0.76mi |
| 607 NE 35th Ave #607 Homestead, FL | 4.0 | 3.0 | 2306 | $3,000 | $1.30 | 24d | 1 | 0.79mi |
| 575 SE 29th Dr Homestead, FL | 4.0 | 2.0 | 1765 | $2,975 | $1.69 | 24d | 1 | 0.79mi |
| 3143 NE 4th St Homestead, FL | 4.0 | 2.0 | 1906 | $2,686 | $1.41 | 24d | 1 | 0.81mi |
| 608 NE 33rd Ter Unit 608 Homestead, FL | 4.0 | 3.0 | 2306 | $2,800 | $1.21 | 24d | 1 | 0.82mi |
| 649 NE 33rd Ter #649 Homestead, FL | 3.0 | 2.5 | 1907 | $2,800 | $1.47 | 24d | 1 | 0.83mi |
| 709 NE 35th Ave Homestead, FL | 4.0 | 4.0 | 2954 | $4,000 | $1.35 | 22d | 1 | 0.83mi |
| 709 NE 35th Ave Homestead, FL | 5.0 | 3.0 | 2954 | $4,000 | $1.35 | 24d | 1 | 0.83mi |
| 635 SE 28th Ln Homestead, FL | 4.0 | 3.0 | 2060 | $3,000 | $1.46 | 22d | 1 | 0.84mi |
| 758 NE 34th Ave #758 Homestead, FL | 4.0 | 3.0 | 1907 | $3,000 | $1.57 | 19d | 1 | 0.87mi |
| 2849 NE 1st Dr Homestead, FL | 5.0 | 3.0 | 2058 | $3,500 | $1.70 | 24d | 1 | 0.93mi |
| 3760 NE 9th Ct Homestead, FL | 5.0 | 3.0 | 2070 | $2,895 | $1.40 | 24d | 1 | 0.94mi |
| 18835 SW 315th St Unit 18835 Homestead, FL | 4.0 | 3.0 | 2072 | $3,200 | $1.54 | 14d | 1 | 0.95mi |
Listing history 9 events
-
2026-06-03days on market $5,000 Active 9 DOM
-
2026-06-02days on market $5,000 Active 8 DOM
-
2026-06-01days on market $5,000 Active 7 DOM
-
2026-05-31days on market $5,000 Active 6 DOM
-
2026-05-25$5,000 Active
-
2026-02-04historical
-
2025-07-10price $474,000
-
2025-03-21price $475,000
-
2025-03-18$485,000 Active
ⓘ Source: listings_history table (triggers on properties + properties_extension) + one-shot
backfill from property_details.listing_events for pre-trigger history.
Climate risk First Street
- Flood 6/10 Major FEMA zone AH · 70% chance over 30 yrs
- Wildfire 1/10 Low
- Heat 10/10 Extreme 7 d/yr ≥105°F today · 32 d/yr by 30 yrs out
- Wind 10/10 Extreme 99% chance of damaging wind over 30 yrs
- Air quality 2/10 Low 1 unhealthy d/yr today · 1 by 30 yrs out
Nearby sold comps map
Loading sold comps map…
Walkable amenities ~0.75 mi
Loading nearby amenities…
Taxation est. · year 1
- Rental income
- $42,492
- − Mortgage interest
- −$32,638
- − Property taxes
- −$8,740
- − Insurance
- −$4,738
- − Repairs & maintenance
- −$3,399
- − Management
- −$3,399
- − Depreciation
- −$16,950
- Taxable loss
- −$27,373
- Est. tax savings @ 24.0%
- +$6,570
- After-tax cash flow
- $-10,006/yr
For passive investors: Depreciation is non-cash, so a rental often shows a tax loss while cash-flowing — sheltering income. Rental losses are passive: they offset passive income freely, and up to $25,000/yr can offset ordinary (W-2) income if you actively participate and your MAGI is under $100k (phasing out to $0 by $150k); unused losses carry forward. On sale, claimed depreciation is recaptured at up to 25%, and gains may owe capital-gains tax (a 1031 exchange can defer both). Figures are a year-1 estimate at your 24.0% rate — not tax advice; consult a CPA.
Schools (NCES district)
- District
- Miami-Dade
- NCES district ID
- 1200390
- Math proficiency
- 45% ▼ -16.00%
- Reading proficiency
- 54% ▼ -5.00%
- Median HH income
- $43,928
- Composite
- 41.76/100
- National rank
- #3397
- State rank
- #40 of 73 in FL
Livability — Homestead
- Score
- 78/100
- State rank
- #158
- US rank
- #2408
Category grades
Schools grade is shown separately in the Schools card above.
Census & demographics
- Census place
- Homestead, FL
- County
- Miami-Dade County · 2,697,751 people
- City population
- 191,470
- Metro
- Miami-Fort Lauderdale-Pompano Beach, FL
- Population (ZIP)
- 23,823
- Household income
- $47,170
- Rent vs Own
- Severe rent burden
- 1516.0
Population outlook (Miami-Dade County) Hauer SSP2
- Today (2025)
- 3,126,439 people
- By 2030
- 3,325,765 · +6.4%
- By 2040
- 3,697,561 · +18.3%
- By 2050
- 4,012,134 · +28.3%
- By 2075
- 4,605,612 · +47.3%
- By 2100
- 4,866,598 · +55.7%
Race, ethnicity, and origin ACS 2023
- Neighborhood character
- Majority Hispanic (62%)
- Race & ethnicity
- Hispanic / Latino 62% Black 28% Two or more races 24% White 8%
- Hispanic origin (detail)
- Mexican 20% Puerto Rican 5% Cuban 13% Dominican 2%
- Common ancestry
- Hispanic 4%
- Foreign-born
- 34% · Canada, Dominican Republic, Guatemala
- Languages at home
- 38% English-only · Spanish 56% French/Haitian/Cajun 5%
Political lean MEDSL · Miami-Dade
- 2024 margin
- R (+11.4) · D 43.9% · R 55.4%
- 2008→2024 swing
- -27.6pp toward R · 2008: 16.1pp · 2024: -11.4pp
- All cycles
- 2024: R+11.4 2020: D+7.3 2016: D+29.6 2012: D+23.7 2008: D+16.1
Not yet ingested
- Civics
- —
Market trends
- HPI YoY
- ▼ -32.64%
- Current HPI
- 521.6856
- Rent YoY
- ▼ -2.85%
- Metro
- Miami-Fort Lauderdale-Pompano Beach, FL
- State GDP YoY
- ▲ 3.28%
- F500 in state
- 36
Industry mix (Fortune 500 HQ in FL)
| Industry | F500 HQs | Revenue |
|---|---|---|
| Industrial Technology | 2 | $29B |
|
||
| Insurance | 2 | $17B |
|
||
| Retail | 1 | $60B |
|
||
| Technology Distribution | 1 | $58B |
|
||
| Homebuilding | 1 | $35B |
|
||
| Technology Manufacturing | 1 | $35B |
|
||
Price history
-99.0% since first listed5 events — show timeline
- 2026-05-25 Listed $5,000 FLKMLS
- 2026-02-04 Listing Removed — MARMLS
- 2025-07-10 Price Changed $474,000 MARMLS
- 2025-03-21 Price Changed $475,000 MARMLS
- 2025-03-18 Listed $485,000 MARMLS
Property tax history
+9.3%/yrLatest (2025): $10,778 · +2.6% YoY. Source: county tax records.
Cash-flow waterfall
monthlySold comps — $/sqft
last 12 mo · ≤1 miLoading sold comps…