 Fourplex
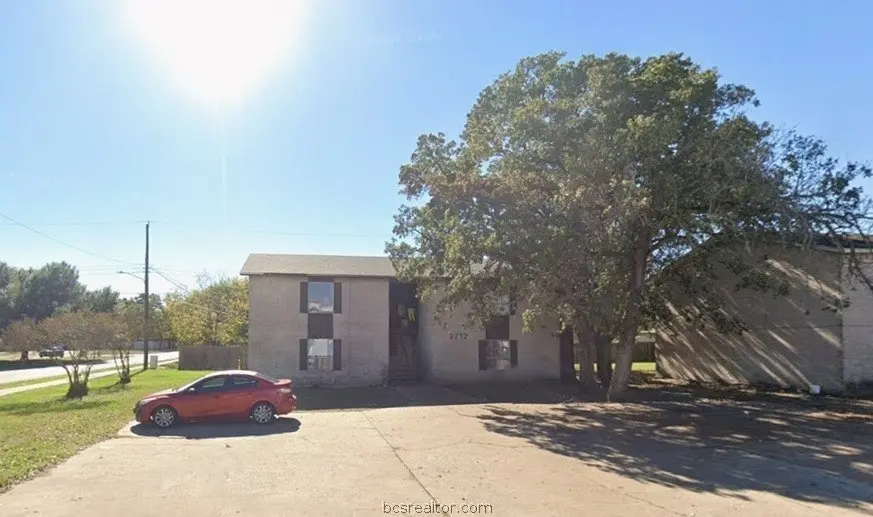
2712 Evergreen Cir · Bryan, TX
Flood risk 1/10 · Minimal
- FEMA flood zone
- X (unshaded)
- Chance of flooding over 30 yrs
- 0.0%
- Est. flood insurance / yr
- $507 – $1,088
Fire risk 4/10 · Minor
- Est. fire insurance / yr
- $1,222 – $2,270
Heat risk 8/10 · Major
- Hot days now (above 110°F)
- 7 days/yr
- Hot days in 30 yrs
- 24 days/yr
Wind risk 8/10 · Major
- Chance of severe wind over 30 yrs
- 80.0%
Air-quality risk 1/10 · Minimal
- Unhealthy air days now
- 0 days/yr
- Unhealthy air days in 30 yrs
- 0 days/yr
Risk factors via First Street. Map © Google.
Why this score? — see what drove the B grade
The composite is a weighted blend of 9 inputs, each scored 0–100. Each bar is that input's sub-score; the figure is the points it added to the 100-point composite (weight × sub-score).
- Cash flow +29.2/30.0
- ARV discount +13.4/15.0
- DSCR +10.0/10.0
- 1% rule +8.7/10.0
- Livability +3.8/5.0
- Rent growth +2.7/5.0
- Schools +2.6/10.0
- Condition / age +2.5/5.0
- Appreciation +0.0/10.0
$299,900
🖨 Deal sheet 📄 Offer letter ✓ Due diligence
Multi-family units
County records classify this as Multi-Family (2-4 Unit). Listing-text estimate: 4 units. confirmed
Listing remarks MLS
Fully leased 4-plex with income of $3475/month. Each unit has a 2-bedroom 1-bathroom layout with washer and dryer connections. Owner pays water and tenants pay electricity. No gas appliances. Roof installed in 2021. Additional units available as package deal. Message for info!
Key facts
- Roof installed
- 0.26 acre lot
- 8 parking spots
Tags
Neighborhood map
What this means for you Summary
Snapshot
- This is a 4 × 2-bed/1-bath units multifamily listed at $300k.
Deal economics
- At list price, monthly cash flow is $1k ($13k/yr) — positive. Per door: $261/mo.
- The deal already cash-flows at list — no discount required.
- Meets the 1% rule at list price ($4k rent vs $300k).
- Recommended offer: $295k (1.5% below list) — sets the bar for market timing.
- Cap rate 10.5% vs local median 4.0% in Bryan — top-decile yield for the area; either an underpriced asset or a hidden risk that comps aren't pricing in. Stress-test before assuming the spread holds.
Location & tenants
- Location reads 76/100 on livability (#99 in TX, #3,341 nationally) — a middle-class / working-renter tenant base. Strengths: cost of living A+, housing A+, health & safety A+; Watch: schools C-, crime C-, amenities C-.
- Bryan ISD (urban): math 30% / reading 32% proficiency, ranked #608 of 826 in TX (top 74%) — families likely to look elsewhere, expect single-tenant / working-renter base with shorter leases; 68% free/reduced lunch — lower-income household profile, screen leases tightly.
- Market conditions: Rents flat; 122 active listings in the ZIP; lower-income renter base — watch delinquency; 2,211 units permitted in Brazos County in 2024 (768 in 5+ unit buildings).
- At $4,102/mo this rent would consume 124% of the median local household income ($40k/yr) (locally 1465% of renters already pay >50% of income on rent) — very limited rent-growth headroom before tenants either downsize or default.
Forward outlook
- Local home prices are declining (-3.0%/yr); year-one equity from $2k of loan paydown is wiped out by about $9k of value loss. Plan a longer hold.
- Brazos County population projected at +55% by 2050 — long-run rental-demand tailwind backs the buy-and-hold thesis.
- At projected returns (-3.0% appreciation + 1.0% rent growth), your $84k cash investment doubles in ~10 years — after that, you're playing with house money.
Negotiation context
- It's been on market 30 days — a 2% lower offer ($295k) is reasonable based on typical stale-listing flexibility.
- 13 sale attempts with the ask held roughly flat each time — persistent listings suggest the price (not the market) is what's stuck; bring a comps-based counter.
Risks & watch-outs
- Climate carrying-cost: severe wind risk, 80% chance of damaging wind over 30y; extreme-heat days projected 7→24/yr by 2055 (HVAC capex compounding) — expect insurance premiums to compound above CPI over the hold.
Questions for the listing agent
- Can we see the unit-by-unit rent roll, current vacancy, and any below-market leases? What's the average tenancy length?
- What capital expenditures (roof, boiler, parking lot, exteriors) have been made in the last 5 years, and what's planned in the next 2?
- Built in 1979 — when were the roof, HVAC, electrical panel, plumbing, and water heater last replaced?
- Is there a deadline driving the sale (1031 exchange, divorce, estate, relocation)? That informs how much negotiation room exists.
- What's the average days-on-market for RENTAL listings here right now (not sales)? A rising rental-DOM trend means longer vacancies and softer asking-rent achievability than the comps imply.
- What's the recent tenant-quality profile in this submarket — average credit score on applications, eviction rate, late-payment / NSF rate, and stable-employment percentage? A property-management company in the area should have these aggregated.
- How much new apartment / multifamily construction is in the pipeline within 1–3 miles? Heavy new supply (>2% of stock underway) typically softens rents 12–24 months out; light construction supports rent growth.
Investment metrics
- 1% rule
- 1.37% ✓
- Cap rate
- 10.47%
- Cash-on-cash
- 14.91%
- DSCR
- 1.66
- GRM
- 6.1
CMA / ARV
- ARV (median comp)
- $344,777
- List price
- $299,900
- Delta
- -10.12%
- Verdict
- UNDERPRICED
- Comps
- 4 within 1.0 mi
Show comp detail 2 sales within ~0.75 mi
| Address | Dist | Beds/Ba | Sqft | Sold | Price | $/sf | Match |
|---|---|---|---|---|---|---|---|
| 2702 Evergreen Cir | 0.08mi | 8/4.0 | 3,156 (0%) | 2mo | $310,000 | $98 | 94 |
| 2705 Evergreen Cir | 0.06mi | 8/1.0 | 3,156 (0%) | 20mo | $338,500 | $107 | 69 |
Match score weights: distance 35% · size 25% · config 20% · recency 20%. Top-matched comps best support the ARV.
Projected returns pro-forma
-3.0% appreciation · 0.99% rent growth · sell at horizon
- IRR
- 3.1%
- Equity multiple
- 1.12×
- Total profit
- $9,874
- Equity at exit
- $44,716
- IRR
- 10.6%
- Equity multiple
- 1.75×
- Total profit
- $62,692
- Equity at exit
- $25,930
Cash invested: $83,972 (down + closing). Projections, not guarantees.
Landlord ↔ Tenant lean methodology
- Overall (STATE)
- 87 Strongly Landlord-Friendly
- State Texas
- 87 Strongly Landlord-Friendly · R+5
- County
- — inherits STATE
- City
- — inherits STATE
ZIP-level market 77801
- Home prices YoY
- -16.8%
- Rents YoY
- 1.0%
- Active inventory
- 122
- Price-to-rent
- 24.4×
Monthly cashflow live
- Estimated rent
- $4,102 high interval (Pro) →
- Mortgage (P&I)
- −$1,573
- Tax from tax record
- −$499 /mo · $5,992/yr
- Insurance
- −$125
- HOA
- −$0
- Vacancy / Maint / Mgmt
- −$861
- Net cashflow
- $1,044
Break-even live
4-unit breakdown (identical units grouped — click to expand)
| Units | Beds | Baths | Est. rent |
|---|---|---|---|
| 4× units | 2 | 1 | $4,104 |
| #1 | 2 | 1 | $1,026 |
| #2 | 2 | 1 | $1,026 |
| #3 | 2 | 1 | $1,026 |
| #4 | 2 | 1 | $1,026 |
| Total (4 units) | $4,102 | ||
UW: 25.0% down · 7.5% · 30yr · 1.5% tax · 5.0% vac · 8.0% maint · 8.0% mgmt
Financing live
Cash to close
- Down payment
- $74,975
- Closing costs
- $8,997
- Reserves months
- —
- Total cash needed
- —
Loan-product check · same deal, 3 products live
Conventional
25% down · 7.5% · 30yr
- Down + closing
- —
- Monthly P&I
- —
- Monthly cashflow
- —
- DSCR
- —
- Eligible?
- —
Personal DTI + credit; lowest rate.
DSCR
20% down · 8.5% · 30yr
- Down + closing
- —
- Monthly P&I
- —
- Monthly cashflow
- —
- DSCR
- —
- Eligible?
- —
No personal income docs; deal must DSCR.
Hard money
10% down · 12.0% · 12mo
- Down + closing
- —
- Monthly P&I
- —
- Monthly cashflow
- —
- DSCR
- —
- Eligible?
- —
Short-term bridge; refi at stabilization.
Listing history 38 events
-
2026-06-18days on market $299,900 Active 30 DOM
-
2026-06-17days on market $299,900 Active 29 DOM
-
2026-06-16days on market $299,900 Active 28 DOM
-
2026-06-15days on market $299,900 Active 27 DOM
-
2026-06-14days on market $299,900 Active 25 DOM
-
2026-06-13days on market $299,900 Active 24 DOM
-
2026-06-10days on market $299,900 Active 22 DOM
-
2026-06-09days on market $299,900 Active 21 DOM
-
2026-06-08days on market $299,900 Active 20 DOM
-
2026-06-07days on market $299,900 Active 19 DOM
-
2026-06-03days on market $299,900 Active 15 DOM
-
2026-06-02days on market $299,900 Active 14 DOM
-
2026-06-01days on market $299,900 Active 13 DOM
-
2026-05-31days on market $299,900 Active 12 DOM
-
2026-05-30days on market $299,900 Active 11 DOM
-
2026-05-19$299,900 Active 277-char remark
Show marketing remark (277 chars)
Fully leased 4-plex with income of $3475/month. Each unit has a 2-bedroom 1-bathroom layout with washer and dryer connections. Owner pays water and tenants pay electricity. No gas appliances. Roof installed in 2021. Additional units available as package deal. Message for info!
-
2026-05-01historical
-
2026-02-09$309,900 Active
-
2026-02-01status Active
-
2026-01-15status Active
-
2026-01-01status Active
-
2025-12-05price $309,900
-
2025-11-14$329,900 Active
-
2025-07-25$339,900 Active
-
2025-06-04price $339,900
-
2025-05-13status Active
-
2025-05-02$349,900 Active
-
2025-04-29historical
-
2025-03-28$354,900 Active
-
2025-03-28$354,900 Active
-
2025-03-26historical
-
2025-02-11$359,900 Active
-
2025-01-30$359,900 Active
-
2021-07-12soldstatus
-
2016-03-07soldstatus
-
2007-03-27soldstatus
-
2006-08-25soldstatus
-
2005-03-22soldstatus
ⓘ Source: listings_history table (triggers on properties + properties_extension) + one-shot
backfill from property_details.listing_events for pre-trigger history.
Tax reassessment forecast TX · Resets to sale price
- Current annual tax
- $5,992 · $499/mo
- Projected year-2 tax
- $5,992 · $499/mo
- Expected delta
- $0/yr ($0/mo · 0.0%)
ⓘ Screening estimate from a state-policy table — verify with the county assessor before closing.
Climate risk First Street
- Flood 1/10 Low FEMA zone X (unshaded) · 0% chance over 30 yrs
- Wildfire 4/10 Moderate
- Heat 8/10 Severe 7 d/yr ≥110°F today · 24 d/yr by 30 yrs out
- Wind 8/10 Severe 80% chance of damaging wind over 30 yrs
- Air quality 1/10 Low 0 unhealthy d/yr today · 0 by 30 yrs out
Nearby sold comps map
Loading sold comps map…
Walkable amenities ~0.75 mi
Loading nearby amenities…
Taxation est. · year 1
- Rental income
- $49,224
- − Mortgage interest
- −$16,799
- − Property taxes
- −$5,992
- − Insurance
- −$1,500
- − Repairs & maintenance
- −$3,938
- − Management
- −$3,938
- − Depreciation
- −$8,724
- Taxable income
- $8,333
- Est. tax owed @ 24.0%
- −$2,000
- After-tax cash flow
- $10,523/yr
For passive investors: Depreciation is non-cash, so a rental often shows a tax loss while cash-flowing — sheltering income. Rental losses are passive: they offset passive income freely, and up to $25,000/yr can offset ordinary (W-2) income if you actively participate and your MAGI is under $100k (phasing out to $0 by $150k); unused losses carry forward. On sale, claimed depreciation is recaptured at up to 25%, and gains may owe capital-gains tax (a 1031 exchange can defer both). Figures are a year-1 estimate at your 24.0% rate — not tax advice; consult a CPA.
Schools (NCES district)
- District
- Bryan ISD
- NCES district ID
- 4811790
- Math proficiency
- 30% ▼ -8.00%
- Reading proficiency
- 32% ▼ -3.00%
- Median HH income
- $41,895
- Composite
- 26.26/100
- National rank
- #7253
- State rank
- #608 of 826 in TX
Livability — Bryan
- Score
- 76/100
- State rank
- #99
- US rank
- #3341
Category grades
Schools grade is shown separately in the Schools card above.
Census & demographics
- Census place
- Bryan, TX
- County
- Brazos County · 233,400 people
- City population
- 101,772
- Metro
- College Station-Bryan, TX
- Population (ZIP)
- 15,461
- Household income
- $39,846
- Rent vs Own
- Severe rent burden
- 1465.0
Population outlook (Brazos County) Hauer SSP2
- Today (2025)
- 267,942 people
- By 2030
- 296,630 · +10.7%
- By 2040
- 354,560 · +32.3%
- By 2050
- 414,616 · +54.7%
- By 2075
- 562,158 · +109.8%
- By 2100
- 678,828 · +153.3%
Race, ethnicity, and origin ACS 2023
- Neighborhood character
- Diverse neighborhood (Simpson 0.68)
- Race & ethnicity
- Hispanic / Latino 41% White 34% Black 17% Two or more races 13% Asian 4% Native American 2%
- Hispanic origin (detail)
- Mexican 34%
- Common ancestry
- Slovak 2% Lithuanian 1% Italian 1%
- Foreign-born
- 16% · Canada
- Languages at home
- 68% English-only · Spanish 26% Other Indo-European 2% French/Haitian/Cajun 2%
Political lean MEDSL · Brazos
- 2024 margin
- Strong R (+24.9) · D 36.9% · R 61.7% · Other 1.4%
- 2008→2024 swing
- +4.1pp toward D · 2008: -28.9pp · 2024: -24.9pp
- All cycles
- 2024: R+24.9 2020: R+14.3 2016: R+23.7 2012: R+35.3 2008: R+28.9
Not yet ingested
- Civics
- —
Market trends
- HPI YoY
- ▼ -54.39%
- Current HPI
- 269.7483
- Rent YoY
- ▲ 0.99%
- Metro
- College Station-Bryan, TX
- State GDP YoY
- ▲ 3.95%
- F500 in state
- 110
Industry mix (Fortune 500 HQ in TX)
| Industry | F500 HQs | Revenue |
|---|---|---|
| Energy | 16 | $1,198B |
|
||
| Technology | 5 | $198B |
|
||
| Engineering / Construction | 4 | $72B |
|
||
| Energy Services | 3 | $60B |
|
||
| Utilities | 3 | $41B |
|
||
| Healthcare | 2 | $330B |
|
||
Price history
-16.7% since first listed23 events — show timeline
- 2026-05-19 Listed $299,900 BCSRMLS
- 2026-05-01 Listing Removed — HARMLS
- 2026-02-09 Listed $309,900 HARMLS
- 2026-02-01 Relisted — BCSRMLS
- 2026-01-15 Relisted — BCSRMLS
- 2026-01-01 Relisted — BCSRMLS
- 2025-12-05 Price Changed $309,900 BCSRMLS
- 2025-11-14 Listed $329,900 BCSRMLS
- 2025-07-25 Listed $339,900 BCSRMLS
- 2025-06-04 Price Changed $339,900 BCSRMLS
- 2025-05-13 Relisted — BCSRMLS
- 2025-05-02 Listed $349,900 BCSRMLS
- 2025-04-29 Listing Removed — HARMLS
- 2025-03-28 Listed $354,900 HARMLS
- 2025-03-28 Listed $354,900 BCSRMLS
- 2025-03-26 Listing Removed — HARMLS
- 2025-02-11 Listed $359,900 HARMLS
- 2025-01-30 Listed $359,900 BCSRMLS
- 2021-07-12 Sold (Public Records) — Public Records
- 2016-03-07 Sold (Public Records) — Public Records
- 2007-03-27 Sold (Public Records) — Public Records
- 2006-08-25 Sold (Public Records) — Public Records
- 2005-03-22 Sold (Public Records) — Public Records
Property tax history
+9.9%/yrLatest (2025): $5,992 · +7.8% YoY. Source: county tax records.
Cash-flow waterfall
monthlySold comps — $/sqft
last 12 mo · ≤1 miLoading sold comps…