815 E Sugarcane Dr Unit E4 · Weslaco, TX
Flood risk 6/10 · Moderate
- FEMA flood zone
- —
- Chance of flooding over 30 yrs
- 0.67%
- Est. flood insurance / yr
- —
Fire risk 2/10 · Minimal
- Est. fire insurance / yr
- $1,222 – $2,270
Heat risk 9/10 · Severe
- Hot days now (above 111°F)
- 6 days/yr
- Hot days in 30 yrs
- 19 days/yr
Wind risk 8/10 · Major
- Chance of severe wind over 30 yrs
- 99.0%
Air-quality risk 1/10 · Minimal
- Unhealthy air days now
- 0 days/yr
- Unhealthy air days in 30 yrs
- 0 days/yr
Risk factors via First Street. Map © Google.
Why this score? — see what drove the D+ grade
The composite is a weighted blend of 9 inputs, each scored 0–100. Each bar is that input's sub-score; the figure is the points it added to the 100-point composite (weight × sub-score).
- Cash flow +18.9/30.0
- ARV discount +7.5/15.0
- 1% rule +6.3/10.0
- DSCR +6.0/10.0
- Livability +3.6/5.0
- Rent growth +2.5/5.0
- Condition / age +2.5/5.0
- Schools +2.2/10.0
- Appreciation +0.3/10.0
$95,000
🖨 Deal sheet (PDF) 📄 Offer letter ✓ Due diligence
Listing remarks
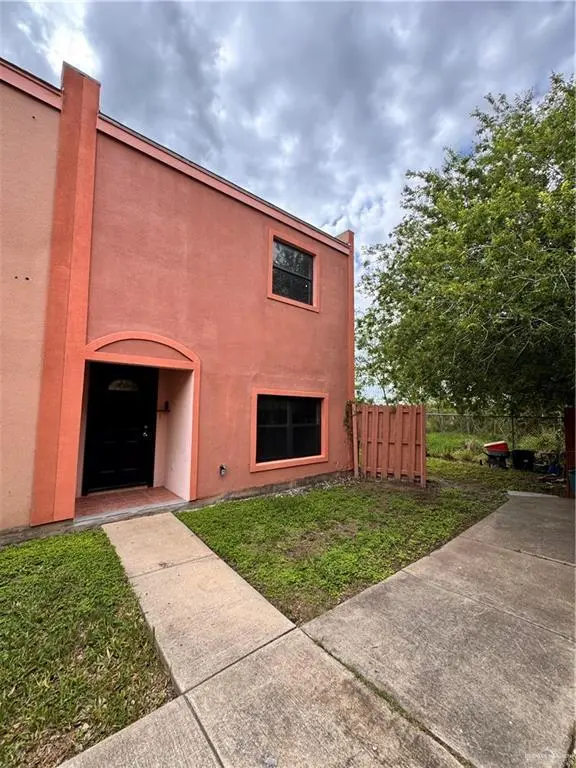
Lovely townhome featuring 1124 square feet of living consisting of 2 bedrooms and 1.5 bath. It is located in close proximity to expressway, schools, restaurants and various shopping centers.
Key facts
- Garage
- Built 1999
- Listed 25 days
Property features AI
Finance
- Other: Located on a 0.02-acre lot (about 871 sq ft); Part of a townhouse community with shared common area interest
- HOA & community: No homeowners association
Exterior
- Parking: Detached covered parking; 2 total covered parking spaces; 2-car carport
- Utilities: Public water; City sewer; Electric service
- Home design: Townhouse (per community legal description); Entry facing north from East Sugar Cane Drive area
- Construction: Stucco exterior; Slab foundation; Composition shingle roof; Built area approximately 1,124
- Exterior features: Privacy wood fencing; Patio slab; Paved road access
Interior
- Kitchen: Electric water heater (located in other location); No conveying appliances
- Bedrooms: Living area(s): 1
- Flooring: Tile
- Bathrooms: 1 full bathroom; 1 half bathroom
- Heating & cooling: Central heating (electric); Central air conditioning (electric)
- Interior features: Tile flooring; Laminate countertops; No window coverings
- Laundry & utility: Laundry closet with washer/dryer connection
Neighborhood map
What this means for you Summary
Snapshot
- This is a 2-bed/2.0-bath townhouse listed at $95k.
Deal economics
- At list price, monthly cash flow is $98 ($1k/yr) — positive.
- The deal already cash-flows at list — no discount required.
- Meets the 1% rule at list price ($1k rent vs $95k).
- Recommended offer: $94k (1.5% below list) — sets the bar for market timing.
- Cap rate 7.5% vs local median 4.1% in Weslaco — top-decile yield for the area; either an underpriced asset or a hidden risk that comps aren't pricing in. Stress-test before assuming the spread holds.
Location & tenants
- Location reads 72/100 on livability (#277 in TX) — a middle-class / working-renter tenant base. Strengths: cost of living A+, housing A+, health & safety A+; Watch: employment D+, crime F, amenities F.
- Weslaco ISD (suburban): math 23% / reading 31% proficiency, ranked #705 of 826 in TX (top 85%) — low school quality limits family demand, transient renter base, plan for 1-2y turnover.
- Zoned schools: Pfc Mario Ybarra El (math 17% / reading 22%, grade F, #3,583 of 4,322 statewide, top 86%, 519 students, 90% FRL); Mary Hoge Middle (math 22% / reading 42%, grade F, #971 of 1,662 statewide, top 60%, 938 students, 93% FRL); Weslaco East H S (math 24% / reading 26%, grade F, #1,250 of 1,632 statewide, top 77%, 2,004 students, 86% FRL) — zoned schools average 90% FRL vs 59% district-wide (30 pts higher); higher-poverty schools than district average — tighter screening recommended.
- Market conditions: 234 active listings in the ZIP; 15 comparable units currently listed for rent nearby; rentals lingering (median 45d on market — plan ~5-8 weeks vacancy on turnover, expect pricing pressure); 87% of comp listings sitting > 30 days — soft ceiling on asking rent; 7,378 units permitted in Hidalgo County in 2024 (641 in 5+ unit buildings).
Forward outlook
- Local home prices are declining (-3.0%/yr); year-one equity from $657 of loan paydown is wiped out by about $3k of value loss. Plan a longer hold.
- Hidalgo County population projected at +28% by 2050 — long-run rental-demand tailwind backs the buy-and-hold thesis.
Negotiation context
- It's been on market 25 days — a 2% lower offer ($94k) is reasonable based on typical stale-listing flexibility.
- 2 sale attempts; this cycle's ask has dropped $10k (9%) from the opening price — seller is motivated, your offer sets the floor, not the list.
Risks & watch-outs
- Watch-outs: property tax is 2.6% of price.
- Climate carrying-cost: major flood risk; severe wind risk, 99% chance of damaging wind over 30y; extreme-heat days projected 6→19/yr by 2055 (HVAC capex compounding) — expect insurance premiums to compound above CPI over the hold.
Questions for the listing agent
- Property tax is high relative to price — has the assessment been appealed recently, and will the sale trigger a re-assessment?
- Is there a deadline driving the sale (1031 exchange, divorce, estate, relocation)? That informs how much negotiation room exists.
- Crime grade is F in this area — have there been break-ins, vandalism, or insurance claims at this property in the last 3 years? What carrier currently insures it and at what premium?
- The area grade is low — what's the realistic commute time and amenity access for the typical tenant pool here? Any planned neighborhood developments (good or bad) we should know about?
- What's the average days-on-market for RENTAL listings here right now (not sales)? A rising rental-DOM trend means longer vacancies and softer asking-rent achievability than the comps imply.
- What's the recent tenant-quality profile in this submarket — average credit score on applications, eviction rate, late-payment / NSF rate, and stable-employment percentage? A property-management company in the area should have these aggregated.
- How much new for-sale + rental construction is in the pipeline within 1–3 miles? Heavy new supply typically softens prices + rents 12–24 months out; constrained supply supports both.
Investment metrics
- 1% rule
- 1.13% ✓
- Cap rate
- 7.53%
- Cash-on-cash
- 4.43%
- DSCR
- 1.20
- GRM
- 7.4
CMA / ARV
No comps found within radius.
Projected returns pro-forma
-3.0% appreciation · 3.0% rent growth · sell at horizon
- IRR
- -9.3%
- Equity multiple
- 0.66×
- Total profit
- $-9,067
- Equity at exit
- $14,165
- IRR
- 0.2%
- Equity multiple
- 1.02×
- Total profit
- $450
- Equity at exit
- $8,214
Cash invested: $26,600 (down + closing). Projections, not guarantees.
Landlord ↔ Tenant lean methodology
- Overall (STATE)
- 87 Strongly Landlord-Friendly
- State Texas
- 87 Strongly Landlord-Friendly · R+5
- County
- — inherits STATE
- City
- — inherits STATE
ZIP-level market 78599
- Home prices YoY
- -3.7%
- Active inventory
- 234
- Price-to-rent
- 7.4×
Monthly cashflow live
- Estimated rent
- $1,069 high interval (Pro) →
- Mortgage (P&I)
- −$498
- Tax from tax record
- −$208 /mo · $2,501/yr
- Insurance
- −$40
- HOA
- −$0
- Vacancy / Maint / Mgmt
- −$224
- Net cashflow
- $98
Break-even live
Sensitivity live
| Price | -10% $152 | -5% $125 | +0% $98 | +5% $71 | +10% $44 |
|---|---|---|---|---|---|
| Rent | -10% $14 | -5% $56 | +0% $98 | +5% $140 | +10% $183 |
| Rate | -1.0pp $146 | -0.5pp $122 | base $98 | +0.5pp $74 | +1.0pp $49 |
UW: 25.0% down · 7.5% · 30yr · 1.5% tax · 5.0% vac · 8.0% maint · 8.0% mgmt
Financing live
Cash to close
- Down payment
- $23,750
- Closing costs
- $2,850
- Reserves months
- —
- Total cash needed
- —
Loan-product check · same deal, 3 products live
Conventional
25% down · 7.5% · 30yr
- Down + closing
- —
- Monthly P&I
- —
- Monthly cashflow
- —
- DSCR
- —
- Eligible?
- —
Personal DTI + credit; lowest rate.
DSCR
20% down · 8.5% · 30yr
- Down + closing
- —
- Monthly P&I
- —
- Monthly cashflow
- —
- DSCR
- —
- Eligible?
- —
No personal income docs; deal must DSCR.
Hard money
10% down · 12.0% · 12mo
- Down + closing
- —
- Monthly P&I
- —
- Monthly cashflow
- —
- DSCR
- —
- Eligible?
- —
Short-term bridge; refi at stabilization.
Rent comps 15 comps
| Address | Beds | Baths | Sqft | Rent | $/sqft | DOM | Units | Dist |
|---|---|---|---|---|---|---|---|---|
| 815 E Sugarcane Dr Unit E4 Weslaco, TX | 2.0 | 1.5 | 1124 | $1,200 | $1.07 | 44d | 1 | 0.01mi |
| 617 E Washington St Unit 4 Weslaco, TX | 3.0 | 2.0 | 1000 | $900 | $0.90 | 44d | 1 | 0.12mi |
| 607 E Washington St Weslaco, TX | 3.0 | 2.0 | 1000 | $900 | $0.90 | 44d | 1 | 0.13mi |
| 1601 S Airport Dr Unit 283 Weslaco, TX | 3.0 | 2.0 | 1033 | $1,600 | $1.55 | 44d | 1 | 0.84mi |
| 1601 S Airport Dr Unit 261 Weslaco, TX | 2.0 | 2.0 | 912 | $1,500 | $1.64 | 44d | 1 | 0.84mi |
| 3814 Bella Costa Dr Unit 3 Weslaco, TX | 2.0 | 2.0 | 987 | $1,025 | $1.04 | 44d | 1 | 1.00mi |
| 3707 Las Vistas Ln Apt 1 Weslaco, TX | 2.0 | 2.0 | 987 | $1,025 | $1.04 | 44d | 1 | 1.00mi |
| 1006 Lilia Dr Weslaco, TX | 1.0 | 1.0 | 720 | $650 | $0.90 | 44d | 1 | 1.09mi |
| 2615 E Sugarcane Dr Weslaco, TX | 2.0–4.0 | 2.0–4.0 | 1108 | $810 | $0.73 | 22d | 8 | 1.19mi |
| 309 E Mesquite St Weslaco, TX | 3.0 | 2.0 | 1100 | $1,400 | $1.27 | 44d | 1 | 1.21mi |
| 2808 Rosemary Dr Unit 3 Weslaco, TX | 3.0 | 2.0 | 1000 | $1,100 | $1.10 | 44d | 1 | 1.32mi |
| 3600 N Westgate Dr Weslaco, TX | 1.0–2.0 | 1.0–2.0 | 819 | $1,199 | $1.46 | 24d | 5 | 1.44mi |
| 1416 Vani Dr Unit 1 Weslaco, TX | 2.0 | 2.0 | 947 | $990 | $1.05 | 44d | 1 | 1.45mi |
| 1412 Vani Dr Unit 3 Weslaco, TX | 2.0 | 2.0 | 960 | $990 | $1.03 | 44d | 1 | 1.45mi |
| 622 E Llano Grande St Weslaco, TX | 3.0 | 2.0 | 1100 | $1,500 | $1.36 | 44d | 1 | 1.47mi |
Listing history 23 events
-
2026-06-21days on market $95,000 Active 25 DOM
-
2026-06-18days on market $95,000 Active 23 DOM
-
2026-06-17days on market $95,000 Active 22 DOM
-
2026-06-16days on market $95,000 Active 21 DOM
-
2026-06-15days on market $95,000 Active 20 DOM
-
2026-06-15days on market $95,000 Active 19 DOM
-
2026-06-13days on market $95,000 Active 18 DOM
-
2026-06-12days on market $95,000 Active 17 DOM
-
2026-06-09days on market $95,000 Active 14 DOM
-
2026-06-08days on market $95,000 Active 13 DOM
-
2026-06-08days on market $95,000 Active 12 DOM
-
2026-06-07days on market $95,000 Active 11 DOM
-
2026-06-04price $95,000 Active 8 DOM
-
2026-06-03days on market $104,900 Active 8 DOM
-
2026-06-02days on market $104,900 Active 7 DOM
-
2026-06-01days on market $104,900 Active 6 DOM
-
2026-05-31days on market $104,900 Active 5 DOM
-
2026-05-26$104,900 Active
-
2026-02-14$1,200
-
2024-05-22soldstatus
-
2004-10-14soldstatus
-
2004-10-14soldstatus
-
2001-08-03soldstatus
ⓘ Source: listings_history table (triggers on properties + properties_extension) + one-shot
backfill from property_details.listing_events for pre-trigger history.
Tax reassessment forecast TX · Resets to sale price
- Current annual tax
- $2,501 · $208/mo
- Projected year-2 tax
- $2,501 · $208/mo
- Expected delta
- $0/yr ($0/mo · 0.0%)
ⓘ Screening estimate from a state-policy table — verify with the county assessor before closing.
Climate risk First Street
- Flood 6/10 Major 67% chance over 30 yrs
- Wildfire 2/10 Low
- Heat 9/10 Extreme 6 d/yr ≥111°F today · 19 d/yr by 30 yrs out
- Wind 8/10 Severe 99% chance of damaging wind over 30 yrs
- Air quality 1/10 Low 0 unhealthy d/yr today · 0 by 30 yrs out
Nearby sold comps map
Loading sold comps map…
Walkable amenities ~0.75 mi
Loading nearby amenities…
Taxation est. · year 1
- Rental income
- $12,826
- − Mortgage interest
- −$5,321
- − Property taxes
- −$2,501
- − Insurance
- −$475
- − Repairs & maintenance
- −$1,026
- − Management
- −$1,026
- − Depreciation
- −$2,764
- Taxable loss
- −$287
- Est. tax savings @ 24.0%
- +$69
- After-tax cash flow
- $1,248/yr
For passive investors: Depreciation is non-cash, so a rental often shows a tax loss while cash-flowing — sheltering income. Rental losses are passive: they offset passive income freely, and up to $25,000/yr can offset ordinary (W-2) income if you actively participate and your MAGI is under $100k (phasing out to $0 by $150k); unused losses carry forward. On sale, claimed depreciation is recaptured at up to 25%, and gains may owe capital-gains tax (a 1031 exchange can defer both). Figures are a year-1 estimate at your 24.0% rate — not tax advice; consult a CPA.
Schools (NCES district)
- District
- Weslaco ISD
- NCES district ID
- 4844960
- Math proficiency
- 23% ▼ -29.00%
- Reading proficiency
- 31% ▼ -9.00%
- Median HH income
- $32,867
- Composite
- 22.05/100
- National rank
- #8196
- State rank
- #705 of 826 in TX
Livability — Weslaco
- Score
- 72/100
- State rank
- #277
- US rank
- #6469
Category grades
Schools grade is shown separately in the Schools card above.
Census & demographics
- Census place
- Weslaco, TX
- Population (ZIP)
- 35,400
Population outlook (Hidalgo County) Hauer SSP2
- Today (2025)
- 955,232 people
- By 2030
- 1,009,774 · +5.7%
- By 2040
- 1,120,332 · +17.3%
- By 2050
- 1,225,036 · +28.2%
- By 2075
- 1,439,189 · +50.7%
- By 2100
- 1,533,429 · +60.5%
Race, ethnicity, and origin ACS 2023
- Neighborhood character
- Predominantly Hispanic (96%)
- Race & ethnicity
- Hispanic / Latino 96% Two or more races 42% White 2%
- Hispanic origin (detail)
- Mexican 90%
- Foreign-born
- 20% · Canada
- Languages at home
- 19% English-only · Spanish 80%
Political lean MEDSL · Hidalgo
- 2024 margin
- Toss-up / Even · D 48.1% · R 51.0%
- 2008→2024 swing
- -41.6pp toward R · 2008: 38.7pp · 2024: -2.9pp
- All cycles
- 2024: R+2.9 2020: D+17.1 2016: D+40.5 2012: D+41.8 2008: D+38.7
Not yet ingested
- Civics
- —
Market trends
- HPI YoY
- ▼ -9.47%
- Current HPI
- 243.5537
- Rent YoY
- —
- Metro
- —
- State GDP YoY
- ▲ 3.95%
- F500 in state
- 110
Industry mix (Fortune 500 HQ in TX)
| Industry | F500 HQs | Revenue |
|---|---|---|
| Energy | 16 | $1,198B |
|
||
| Technology | 5 | $198B |
|
||
| Engineering / Construction | 4 | $72B |
|
||
| Energy Services | 3 | $60B |
|
||
| Utilities | 3 | $41B |
|
||
| Healthcare | 2 | $330B |
|
||
Price history
+8641.7% since first listed6 events — show timeline
- 2026-05-26 Listed $104,900 MCALLENMLS
- 2026-02-14 Listed for Rent $1,200 REDFIN
- 2024-05-22 Sold (Public Records) — Public Records
- 2004-10-14 Sold (Public Records) — Public Records
- 2004-10-14 Sold (Public Records) — Public Records
- 2001-08-03 Sold (Public Records) — Public Records
Property tax history
+3.5%/yrLatest (2025): $2,501 · +52.6% YoY. Source: county tax records.
Cash-flow waterfall
monthlySold comps — $/sqft
last 12 mo · ≤1 miLoading sold comps…