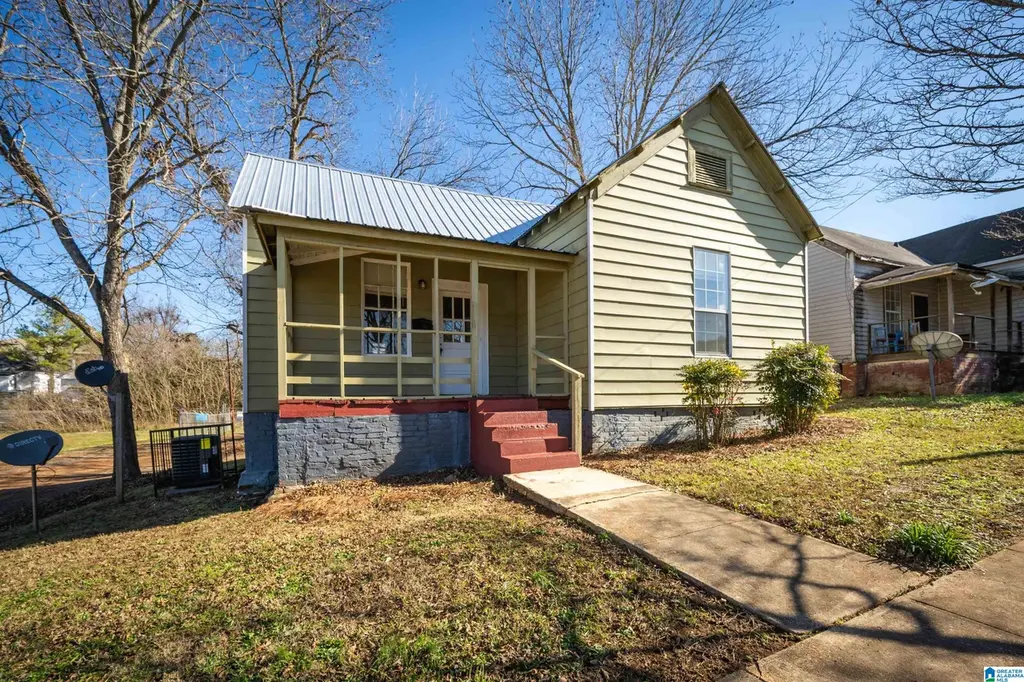
410 Spring St S · Talladega, AL
Flood risk 1/10 · Minimal
- FEMA flood zone
- X (unshaded)
- Chance of flooding over 30 yrs
- 0.0%
- Est. flood insurance / yr
- $507 – $1,088
Fire risk 5/10 · Moderate
- Est. fire insurance / yr
- $916 – $1,700
Heat risk 7/10 · Major
- Hot days now (above 108°F)
- 7 days/yr
- Hot days in 30 yrs
- 19 days/yr
Wind risk 6/10 · Moderate
- Chance of severe wind over 30 yrs
- 27.0%
Air-quality risk 2/10 · Minimal
- Unhealthy air days now
- 1 days/yr
- Unhealthy air days in 30 yrs
- 1 days/yr
Risk factors via First Street. Map © Google.
Why this score? — see what drove the B- grade
The composite is a weighted blend of 9 inputs, each scored 0–100. Each bar is that input's sub-score; the figure is the points it added to the 100-point composite (weight × sub-score).
- Cash flow +29.6/30.0
- ARV discount +12.1/15.0
- DSCR +10.0/10.0
- 1% rule +7.0/10.0
- Livability +3.0/5.0
- Rent growth +2.5/5.0
- Condition / age +2.5/5.0
- Schools +1.3/10.0
- Appreciation +0.0/10.0
$86,000
🖨 Deal sheet 📄 Offer letter ✓ Due diligence
Listing remarks MLS
Lovely home in Talladega with 2 bedrooms and 1 bathroom. Beautiful interior and exterior! Nice neighborhood.
Key facts
- Covered front porch
- Back deck
- Storage area
Tags
Property features AI
Finance
- Other: Located in the Talladega subdivision
Exterior
- Parking: Driveway parking; Off-street parking
- Utilities: Public water; Septic sewer; Electric water heater; Internet service availability unknown
- Home design: Existing property; Concrete/Block construction
- Construction: Concrete/Block construction; Crawl space foundation
- Exterior features: No waterfront; No pool; No patio; No garden/patio; No decks; Lot approximately 0.12 acres; No notable lot view; Not in a flood plain
Interior
- Kitchen: Solid surface countertops; Kitchen on the main level
- Bedrooms: Two bedrooms on the main level
- Flooring: Tile flooring; Vinyl flooring
- Bathrooms: One full bathroom with tub/shower combo on the main level
- Heating & cooling: Central heating; Central cooling
- Interior features: Ceilings noted as Other (see remarks); No additional interior features listed
- Laundry & utility: Main-level laundry area with washer hookup and electric dryer hookup; Has laundry
Neighborhood map
What this means for you Summary
Snapshot
- This is a 2-bed/1.0-bath single-family listed at $86k.
Deal economics
- At list price, monthly cash flow is $311 ($4k/yr) — positive.
- The deal already cash-flows at list — no discount required.
- Meets the 1% rule at list price ($1k rent vs $86k).
- Cap rate 10.6% vs local median 4.8% in Talladega — top-decile yield for the area; either an underpriced asset or a hidden risk that comps aren't pricing in. Stress-test before assuming the spread holds.
Location & tenants
- Location reads 59/100 on livability (#327 in AL) — a working-class tenant base; expect higher turnover. Strengths: cost of living A+, housing A, health & safety A-; Watch: crime F, amenities F, commute F.
- Talladega City (rural): math 7% / reading 25% proficiency, ranked #114 of 129 in AL (top 88%) — low school quality limits family demand, transient renter base, plan for 1-2y turnover; 74% free/reduced lunch — lower-income household profile, screen leases tightly.
- Zoned schools: Talladega High School (math 2% / reading 2%, grade F, #291 of 305 statewide, top 100%, 446 students, 84% FRL).
- Zoned-school proficiency averages 2% at this address vs 16% district-wide (-14 pts) — the specific schools serving this property underperform the Talladega City average; the district grade overstates school quality for this exact location.
- Market conditions: 170 active listings in the ZIP; 2 comparable units currently listed for rent nearby; 189 units permitted in Talladega County in 2024 (6 in 5+ unit buildings).
Forward outlook
- Local home prices are declining (-3.0%/yr); year-one equity from $595 of loan paydown is wiped out by about $3k of value loss. Plan a longer hold.
- Talladega County population projected at -14% by 2050 — secular population decline; favor cash flow + early exit over multi-decade hold.
- At projected returns (-3.0% appreciation + 3.0% rent growth), your $24k cash investment doubles in ~8 years — after that, you're playing with house money.
Negotiation context
- Only 3 days on market — expect competitive offers; lowballing is unlikely to land.
- 3 sale attempts since 7y ago with the ask held roughly flat each time — persistent listings suggest the price (not the market) is what's stuck; bring a comps-based counter.
Risks & watch-outs
- Watch-outs: built in 1940 — expect roof / HVAC / electrical / plumbing capex.
- Climate carrying-cost: major wind risk, 27% chance of damaging wind over 30y; moderate wildfire risk; extreme-heat days projected 7→19/yr by 2055 (HVAC capex compounding) — expect insurance premiums to compound above CPI over the hold.
Questions for the listing agent
- Built in 1940 — when were the roof, HVAC, electrical panel, plumbing, and water heater last replaced?
- Is there a deadline driving the sale (1031 exchange, divorce, estate, relocation)? That informs how much negotiation room exists.
- Schools are F-rated, which usually means shorter tenancies and higher turnover. Who's the typical renter profile here, and what's been the actual vacancy rate?
- Crime grade is F in this area — have there been break-ins, vandalism, or insurance claims at this property in the last 3 years? What carrier currently insures it and at what premium?
- What's the average days-on-market for RENTAL listings here right now (not sales)? A rising rental-DOM trend means longer vacancies and softer asking-rent achievability than the comps imply.
- What's the recent tenant-quality profile in this submarket — average credit score on applications, eviction rate, late-payment / NSF rate, and stable-employment percentage? A property-management company in the area should have these aggregated.
- How much new for-sale + rental construction is in the pipeline within 1–3 miles? Heavy new supply typically softens prices + rents 12–24 months out; constrained supply supports both.
Investment metrics
- 1% rule
- 1.20% ✓
- Cap rate
- 10.63%
- Cash-on-cash
- 15.48%
- DSCR
- 1.69
- GRM
- 7.0
CMA / ARV
- ARV (on-the-fly)
- $95,760
- Comps found
- 7
Show comp detail 7 sales within ~0.75 mi
| Address | Dist | Beds/Ba | Sqft | Sold | Price | $/sf | Match |
|---|---|---|---|---|---|---|---|
| 708 Glenwood Rd | 0.34mi | 3/1.0 (+1) | 1,008 (0%) | 4mo | $109,200 | $108 | 76 |
| 709 Glenwood Rd | 0.34mi | 2/1.0 | 1,042 (+3%) | 6mo | $75,000 | $72 | 73 |
| 724 Glenwood Rd | 0.45mi | 3/1.0 (+1) | 1,000 (-1%) | 10mo | $95,000 | $95 | 65 |
| 722 Patricia Ave | 0.44mi | 3/1.0 (+1) | 1,066 (+6%) | 14mo | $125,000 | $117 | 53 |
| 115 Elizabeth Ave | 0.69mi | 2/1.0 | 909 (-10%) | 1mo | $86,000 | $95 | 51 |
| 726 Glenwood Rd | 0.47mi | 3/1.0 (+1) | 1,136 (+13%) | 13mo | $99,000 | $87 | 41 |
| 308 Lancaster St E | 0.70mi | 3/1.0 (+1) | 905 (-10%) | 8mo | $121,000 | $134 | 39 |
Match score weights: distance 35% · size 25% · config 20% · recency 20%. Top-matched comps best support the ARV.
Projected returns pro-forma
-3.0% appreciation · 3.0% rent growth · sell at horizon
- IRR
- 6.2%
- Equity multiple
- 1.24×
- Total profit
- $5,813
- Equity at exit
- $12,823
- IRR
- 15.5%
- Equity multiple
- 2.26×
- Total profit
- $30,377
- Equity at exit
- $7,436
Cash invested: $24,080 (down + closing). Projections, not guarantees.
Landlord ↔ Tenant lean methodology
- Overall (STATE)
- 90 Strongly Landlord-Friendly
- State Alabama
- 90 Strongly Landlord-Friendly · R+15
- County
- — inherits STATE
- City
- — inherits STATE
ZIP-level market 35160
- Home prices YoY
- -26.9%
- Active inventory
- 170
- Price-to-rent
- 7.0×
Monthly cashflow live
- Estimated rent
- $1,029 medium interval (Pro) →
- Mortgage (P&I)
- −$451
- Tax from tax record
- −$15 /mo · $182/yr
- Insurance
- −$36
- HOA
- −$0
- Vacancy / Maint / Mgmt
- −$216
- Net cashflow
- $311
Break-even live
UW: 25.0% down · 7.5% · 30yr · 1.5% tax · 5.0% vac · 8.0% maint · 8.0% mgmt
Financing live
Cash to close
- Down payment
- $21,500
- Closing costs
- $2,580
- Reserves months
- —
- Total cash needed
- —
Loan-product check · same deal, 3 products live
Conventional
25% down · 7.5% · 30yr
- Down + closing
- —
- Monthly P&I
- —
- Monthly cashflow
- —
- DSCR
- —
- Eligible?
- —
Personal DTI + credit; lowest rate.
DSCR
20% down · 8.5% · 30yr
- Down + closing
- —
- Monthly P&I
- —
- Monthly cashflow
- —
- DSCR
- —
- Eligible?
- —
No personal income docs; deal must DSCR.
Hard money
10% down · 12.0% · 12mo
- Down + closing
- —
- Monthly P&I
- —
- Monthly cashflow
- —
- DSCR
- —
- Eligible?
- —
Short-term bridge; refi at stabilization.
Rent comps 2 comps
| Address | Beds | Baths | Sqft | Rent | $/sqft | DOM | Units | Dist |
|---|---|---|---|---|---|---|---|---|
| 207 Jemison St Talladega, AL | 3.0 | 2.0 | 1490 | $1,295 | $0.87 | 43d | 1 | 0.92mi |
| 515 Lawson St Talladega, AL | 2.0 | 1.5 | 1169 | $800 | $0.68 | 43d | 1 | 1.00mi |
Listing history 4 events
-
2026-06-19days on market $86,000 Active 3 DOM
-
2026-06-18days on market $86,000 Active 2 DOM
-
2026-06-17remarks 391-char remark
-
2026-06-17$86,000 Active 1 DOM
ⓘ Source: listings_history table (triggers on properties + properties_extension) + one-shot
backfill from property_details.listing_events for pre-trigger history.
Tax reassessment forecast AL · Resets to sale price
- Current annual tax
- $182 · $15/mo
- Projected year-2 tax
- $353 · $29/mo
- Expected delta
- +$170/yr (+$14/mo · 93.2%)
ⓘ Screening estimate from a state-policy table — verify with the county assessor before closing.
Climate risk First Street
- Flood 1/10 Low FEMA zone X (unshaded) · 0% chance over 30 yrs
- Wildfire 5/10 Major
- Heat 7/10 Severe 7 d/yr ≥108°F today · 19 d/yr by 30 yrs out
- Wind 6/10 Major 27% chance of damaging wind over 30 yrs
- Air quality 2/10 Low 1 unhealthy d/yr today · 1 by 30 yrs out
Nearby sold comps map
Loading sold comps map…
Walkable amenities ~0.75 mi
Loading nearby amenities…
Taxation est. · year 1
- Rental income
- $12,346
- − Mortgage interest
- −$4,817
- − Property taxes
- −$182
- − Insurance
- −$430
- − Repairs & maintenance
- −$988
- − Management
- −$988
- − Depreciation
- −$2,502
- Taxable income
- $2,439
- Est. tax owed @ 24.0%
- −$585
- After-tax cash flow
- $3,143/yr
For passive investors: Depreciation is non-cash, so a rental often shows a tax loss while cash-flowing — sheltering income. Rental losses are passive: they offset passive income freely, and up to $25,000/yr can offset ordinary (W-2) income if you actively participate and your MAGI is under $100k (phasing out to $0 by $150k); unused losses carry forward. On sale, claimed depreciation is recaptured at up to 25%, and gains may owe capital-gains tax (a 1031 exchange can defer both). Figures are a year-1 estimate at your 24.0% rate — not tax advice; consult a CPA.
Schools (NCES district)
- District
- Talladega City
- NCES district ID
- 0103150
- Math proficiency
- 7% ▼ -19.00%
- Reading proficiency
- 25% ▼ -4.00%
- Median HH income
- $30,107
- Composite
- 12.63/100
- National rank
- #9610
- State rank
- #114 of 129 in AL
Livability — Talladega
- Score
- 59/100
- State rank
- #327
- US rank
- #19965
Category grades
Schools grade is shown separately in the Schools card above.
Census & demographics
- Census place
- Talladega, AL
- Population (ZIP)
- 26,177
Population outlook (Talladega County) Hauer SSP2
- Today (2025)
- 78,905 people
- By 2030
- 77,160 · -2.2%
- By 2040
- 72,937 · -7.6%
- By 2050
- 68,279 · -13.5%
- By 2075
- 57,884 · -26.6%
- By 2100
- 47,220 · -40.2%
Race, ethnicity, and origin ACS 2023
- Neighborhood character
- Diverse neighborhood (Simpson 0.57)
- Race & ethnicity
- White 49% Black 43% Two or more races 4% Hispanic / Latino 3%
- Common ancestry
- Slovak 2% Italian 1% Iranian 1%
- Foreign-born
- 2% · Canada
- Languages at home
- 96% English-only · Spanish 3%
Political lean MEDSL · Talladega
- 2024 margin
- Solid R (+33.8) · D 32.9% · R 66.6%
- 2008→2024 swing
- -15.3pp toward R · 2008: -18.5pp · 2024: -33.8pp
- All cycles
- 2024: R+33.8 2020: R+25.5 2016: R+25.6 2012: R+16.0 2008: R+18.5
Not yet ingested
- Civics
- —
Market trends
- HPI YoY
- ▼ -70.24%
- Current HPI
- 190.5904
- Rent YoY
- —
- Metro
- —
- State GDP YoY
- ▲ 2.94%
- F500 in state
- 4
Industry mix (Fortune 500 HQ in AL)
| Industry | F500 HQs | Revenue |
|---|---|---|
| Financial Services | 1 | $8B |
|
||
| Healthcare | 1 | $5B |
|
||
Price history
-5.0% since first listed6 events — show timeline
- 2026-06-16 Listed $86,000 Greater Alabama MLS
- 2025-01-24 Rental Removed $825 SHOWMOJO
- 2025-01-11 Price Changed $825 SHOWMOJO
- 2024-12-13 Listed for Rent $850 SHOWMOJO
- 2020-01-13 Sold (MLS) $90,500 Greater Alabama MLS
- 2019-10-01 Listed $90,500 Greater Alabama MLS
Property tax history
+2.4%/yrLatest (2025): $182 · +0.0% YoY. Source: county tax records.
Cash-flow waterfall
monthlySold comps — $/sqft
last 12 mo · ≤1 miLoading sold comps…