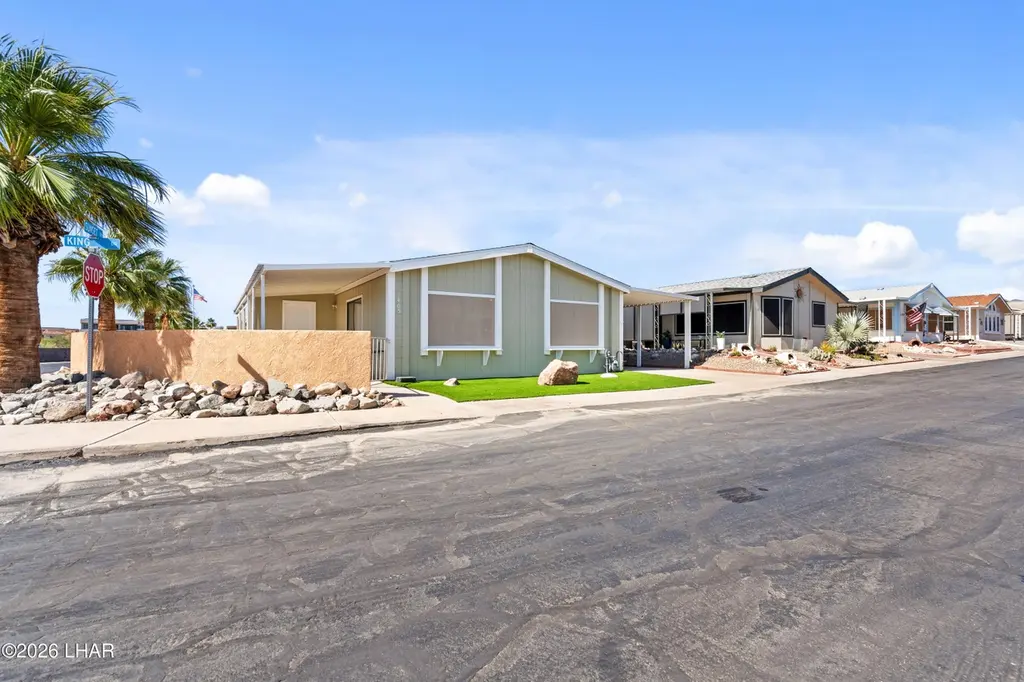
1405 King Dr · Lake Havasu City, AZ
Flood risk 1/10 · Minimal
- FEMA flood zone
- X (unshaded)
- Chance of flooding over 30 yrs
- 0.0%
- Est. flood insurance / yr
- $507 – $1,088
Fire risk 4/10 · Minor
- Est. fire insurance / yr
- $610 – $1,132
Heat risk 9/10 · Severe
- Hot days now (above 116°F)
- 5 days/yr
- Hot days in 30 yrs
- 12 days/yr
Wind risk 1/10 · Minimal
- Chance of severe wind over 30 yrs
- —
Air-quality risk 1/10 · Minimal
- Unhealthy air days now
- 0 days/yr
- Unhealthy air days in 30 yrs
- 0 days/yr
Risk factors via First Street. Map © Google.
Why this score? — see what drove the B- grade
The composite is a weighted blend of 9 inputs, each scored 0–100. Each bar is that input's sub-score; the figure is the points it added to the 100-point composite (weight × sub-score).
- Cash flow +30.0/30.0
- DSCR +10.0/10.0
- 1% rule +8.8/10.0
- ARV discount +6.1/15.0
- Condition / age +4.0/5.0
- Schools +3.4/10.0
- Livability +3.2/5.0
- Rent growth +2.7/5.0
- Appreciation +0.0/10.0
$159,900
🖨 Deal sheet (PDF) 📄 Offer letter ✓ Due diligence
Listing remarks
On Leased Land. Lake days are calling! Welcome to 1405 King Dr. , a beautifully updated home on leased land in the sought after 55+ Sunset Homes Mobile Home Park community. Recently remodeled and featuring a newer roof, paint and more, this move in ready home offers comfort and low maintenance living. Spend your mornings enjoying coffee on the patio or Arizona room, your afternoons exploring nearby Mesquite Bay and launch ramps, and your evenings taking advantage of the shopping, dining, and entertainment just minutes away. The community pool and recreation area will be a favorite hangout spot, complete with a heated pool, Bocce Ball and horseshoes you are sure to settle right in! Located
Key facts
- Newer roof
- Arizona room
- Updated home
Tags
Property features AI
Finance
- Other: Property zoned L-RMH (Manufactured Home District)
- HOA & community: Located in a senior community; Land is leased
Exterior
- Parking: Has carport
- Utilities: Public water; Public sewer; 200+ amp electric service; Natural gas available and connected; Underground utilities
- Home design: Manufactured double-wide home; Updated/remodeled; Facing direction not specified
- Construction: Frame construction with vertical siding; Metal and shingle roof
- Exterior features: Patio; Chain link fencing around the back yard; Water-smart landscaping; Shed(s); Corner, level lot
Interior
- Kitchen: Gas water heater
- Bedrooms: Bedroom(s) (including walk-in closet(s))
- Flooring: Carpet; Vinyl
- Bathrooms: 1 full bathroom; 1 three-quarter bathroom
- Heating & cooling: Heat pump and central heating; Central air; Ceiling fan(s); Wall/window unit(s)
- Interior features: Vaulted ceilings; Ceiling fans; Walk-in closets
- Laundry & utility: Indoor laundry
Neighborhood map
What this means for you Summary
Snapshot
- This is a 2-bed/2.0-bath manufactured listed at $160k. Condition is rated good.
Deal economics
- At list price, monthly cash flow is $642 ($8k/yr) — positive.
- The deal already cash-flows at list — no discount required.
- Meets the 1% rule at list price ($2k rent vs $160k).
- Recommended offer: $158k (1.5% below list) — sets the bar for market timing.
- Cap rate 11.1% vs local median 3.0% in Lake Havasu City — top-decile yield for the area; either an underpriced asset or a hidden risk that comps aren't pricing in. Stress-test before assuming the spread holds.
Location & tenants
- Location reads 63/100 on livability (#124 in AZ) — a middle-class / working-renter tenant base. Strengths: housing A; Watch: health & safety C-, amenities F, commute F.
- Lake Havasu Unified District (4368) (urban): math 39% / reading 41% proficiency, ranked #66 of 249 in AZ (top 26%) — families likely to look elsewhere, expect single-tenant / working-renter base with shorter leases.
- Market conditions: Rents flat; 419 active listings in the ZIP; 12 comparable units currently listed for rent nearby; rentals lingering (median 45d on market — plan ~5-8 weeks vacancy on turnover, expect pricing pressure); 67% of comp listings sitting > 30 days — soft ceiling on asking rent; 2,543 units permitted in Mohave County in 2024 (33 in 5+ unit buildings).
- This rent runs 36% of the median local income ($73k/yr) — at the standard rent-burdened threshold; future hikes will face affordability resistance.
Forward outlook
- Local home prices are declining (-3.0%/yr); year-one equity from $1k of loan paydown is wiped out by about $5k of value loss. Plan a longer hold.
- Mohave County population projected to shrink 6% by 2050 — rents likely to lag national; underwrite the cash flow, not the appreciation.
- At projected returns (-3.0% appreciation + 0.7% rent growth), your $45k cash investment doubles in ~9 years — after that, you're playing with house money.
Negotiation context
- It's been on market 23 days — a 2% lower offer ($158k) is reasonable based on typical stale-listing flexibility.
Risks & watch-outs
- Climate carrying-cost: extreme-heat days projected 5→12/yr by 2055 (HVAC capex compounding) — expect insurance premiums to compound above CPI over the hold.
Questions for the listing agent
- Is there a deadline driving the sale (1031 exchange, divorce, estate, relocation)? That informs how much negotiation room exists.
- Schools are B-rated — typically a magnet for longer-tenancy family renters. What's the average tenant stay here, and is there a school-zone premium baked into asking?
- What's the average days-on-market for RENTAL listings here right now (not sales)? A rising rental-DOM trend means longer vacancies and softer asking-rent achievability than the comps imply.
- What's the recent tenant-quality profile in this submarket — average credit score on applications, eviction rate, late-payment / NSF rate, and stable-employment percentage? A property-management company in the area should have these aggregated.
- How much new for-sale + rental construction is in the pipeline within 1–3 miles? Heavy new supply typically softens prices + rents 12–24 months out; constrained supply supports both.
Investment metrics
- 1% rule
- 1.38% ✓
- Cap rate
- 11.11%
- Cash-on-cash
- 17.21%
- DSCR
- 1.77
- GRM
- 6.0
CMA / ARV
- ARV (on-the-fly)
- $155,092
- Comps found
- 8
Show comp detail 8 sales within ~0.75 mi
| Address | Dist | Beds/Ba | Sqft | Sold | Price | $/sf | Match |
|---|---|---|---|---|---|---|---|
| 1410 King Dr | 0.02mi | 2/2.0 | 1,344 (+0%) | 3mo | $185,000 | $138 | 96 |
| 1445 King Dr | 0.04mi | 2/2.0 | 1,300 (-3%) | 3mo | $149,000 | $115 | 91 |
| 1415 King Dr | 0.01mi | 2/2.0 | 1,248 (-7%) | 7mo | $144,900 | $116 | 83 |
| 1420 King Dr | 0.03mi | 2/2.0 | 1,300 (-3%) | 16mo | $180,000 | $138 | 80 |
| 1455 King Dr | 0.04mi | 2/2.0 | 1,152 (-14%) | 3mo | $120,000 | $104 | 72 |
| 1425 Sunshine Dr | 0.04mi | 3/2.0 (+1) | 1,300 (-3%) | 23mo | $165,000 | $127 | 69 |
| 1435 Wagner Dr | 0.17mi | 2/2.0 | 1,512 (+13%) | 12mo | $148,000 | $98 | 61 |
| 1455 Palo Verde Blvd N | 0.14mi | 2/2.0 | 1,152 (-14%) | 17mo | $132,000 | $115 | 56 |
Match score weights: distance 35% · size 25% · config 20% · recency 20%. Top-matched comps best support the ARV.
Projected returns pro-forma
-3.0% appreciation · 0.66% rent growth · sell at horizon
- IRR
- 5.9%
- Equity multiple
- 1.22×
- Total profit
- $9,930
- Equity at exit
- $23,842
- IRR
- 13.0%
- Equity multiple
- 1.93×
- Total profit
- $41,519
- Equity at exit
- $13,825
Cash invested: $44,772 (down + closing). Projections, not guarantees.
Landlord ↔ Tenant lean methodology
- Overall (STATE)
- 87 Strongly Landlord-Friendly
- State Arizona
- 87 Strongly Landlord-Friendly · R+3
- County
- — inherits STATE
- City
- — inherits STATE
ZIP-level market 86404
- Home prices YoY
- -32.0%
- Rents YoY
- 0.7%
- Active inventory
- 419
- Price-to-rent
- 6.0×
Monthly cashflow live
- Estimated rent
- $2,212 high interval (Pro) →
- Mortgage (P&I)
- −$839
- Tax est. 1.5%
- −$200 /mo · $2,398/yr
- Insurance
- −$67
- HOA
- −$0
- Vacancy / Maint / Mgmt
- −$464
- Net cashflow
- $642
Break-even live
Sensitivity live
| Price | -10% $753 | -5% $697 | +0% $642 | +5% $587 | +10% $532 |
|---|---|---|---|---|---|
| Rent | -10% $467 | -5% $555 | +0% $642 | +5% $729 | +10% $817 |
| Rate | -1.0pp $723 | -0.5pp $683 | base $642 | +0.5pp $601 | +1.0pp $559 |
UW: 25.0% down · 7.5% · 30yr · 1.5% tax · 5.0% vac · 8.0% maint · 8.0% mgmt
Financing live
Cash to close
- Down payment
- $39,975
- Closing costs
- $4,797
- Reserves months
- —
- Total cash needed
- —
Loan-product check · same deal, 3 products live
Conventional
25% down · 7.5% · 30yr
- Down + closing
- —
- Monthly P&I
- —
- Monthly cashflow
- —
- DSCR
- —
- Eligible?
- —
Personal DTI + credit; lowest rate.
DSCR
20% down · 8.5% · 30yr
- Down + closing
- —
- Monthly P&I
- —
- Monthly cashflow
- —
- DSCR
- —
- Eligible?
- —
No personal income docs; deal must DSCR.
Hard money
10% down · 12.0% · 12mo
- Down + closing
- —
- Monthly P&I
- —
- Monthly cashflow
- —
- DSCR
- —
- Eligible?
- —
Short-term bridge; refi at stabilization.
Rent comps 12 comps
| Address | Beds | Baths | Sqft | Rent | $/sqft | DOM | Units | Dist |
|---|---|---|---|---|---|---|---|---|
| 1790 Piper Bay Lake Havasu City, AZ | 3.0 | 2.0 | 1550 | $2,800 | $1.81 | 45d | 1 | 0.33mi |
| 1942 Palo Verde Blvd N Lake Havasu City, AZ | 3.0 | 2.0 | 1623 | $3,500 | $2.16 | 45d | 1 | 0.63mi |
| 1226 N Lake Havasu Ave Lake Havasu City, AZ | 2.0 | 1.0 | 1300 | $1,500 | $1.15 | 14d | 1 | 0.82mi |
| 1370 N Lake Havasu Ave Unit 102 Lake Havasu City, AZ | 2.0 | 1.0 | 900 | $1,650 | $1.83 | 14d | 1 | 0.87mi |
| 1697 Cardinal Dr Lake Havasu City, AZ | 3.0 | 2.0 | 1695 | $2,195 | $1.29 | 22d | 1 | 0.87mi |
| 2010 Bombay Dr Lake Havasu City, AZ | 3.0 | 2.0 | 1406 | $2,500 | $1.78 | 45d | 1 | 0.87mi |
| 1435 Beefeater Dr Lake Havasu City, AZ | 3.0 | 2.0 | 1450 | $2,300 | $1.59 | 22d | 1 | 0.92mi |
| 2265 Malahini Dr Lake Havasu City, AZ | 3.0 | 2.0 | 1437 | $2,300 | $1.60 | 45d | 1 | 1.28mi |
| 2086 Sandwood Dr Lake Havasu City, AZ | 2.0 | 2.0 | 1123 | $1,700 | $1.51 | 45d | 1 | 1.32mi |
| 2345 Palo Verde Blvd N Lake Havasu City, AZ | 3.0 | 2.0 | 1040 | $2,500 | $2.40 | 45d | 1 | 1.45mi |
| 2231 Sandwood Dr Unit S2231-102 Lake Havasu City, AZ | 1.0 | 1.0 | 1128 | $1,150 | $1.02 | 45d | 1 | 1.46mi |
| 2035 San Juan Dr Apt 203 Lake Havasu City, AZ | 2.0 | 1.0 | 1200 | $1,200 | $1.00 | 45d | 1 | 1.47mi |
Listing history 18 events
-
2026-06-21days on market $159,900 Active 23 DOM
-
2026-06-18days on market $159,900 Active 20 DOM
-
2026-06-17days on market $159,900 Active 19 DOM
-
2026-06-16days on market $159,900 Active 18 DOM
-
2026-06-15days on market $159,900 Active 17 DOM
-
2026-06-14days on market $159,900 Active 15 DOM
-
2026-06-13days on market $159,900 Active 14 DOM
-
2026-06-10days on market $159,900 Active 12 DOM
-
2026-06-09days on market $159,900 Active 11 DOM
-
2026-06-08days on market $159,900 Active 10 DOM
-
2026-06-07days on market $159,900 Active 9 DOM
-
2026-06-03days on market $159,900 Active 5 DOM
-
2026-06-02days on market $159,900 Active 4 DOM
-
2026-06-01days on market $159,900 Active 3 DOM
-
2026-05-31remarks 699-char remark
-
2026-05-31days on market $159,900 Active 2 DOM
-
2026-05-30remarks 672-char remark
-
2026-05-30$159,900 Active 1 DOM
ⓘ Source: listings_history table (triggers on properties + properties_extension) + one-shot
backfill from property_details.listing_events for pre-trigger history.
Climate risk First Street
- Flood 1/10 Low FEMA zone X (unshaded) · 0% chance over 30 yrs
- Wildfire 4/10 Moderate
- Heat 9/10 Extreme 5 d/yr ≥116°F today · 12 d/yr by 30 yrs out
- Wind 1/10 Low
- Air quality 1/10 Low 0 unhealthy d/yr today · 0 by 30 yrs out
Nearby sold comps map
Loading sold comps map…
Walkable amenities ~0.75 mi
Loading nearby amenities…
Taxation est. · year 1
- Rental income
- $26,539
- − Mortgage interest
- −$8,957
- − Property taxes
- −$2,398
- − Insurance
- −$800
- − Repairs & maintenance
- −$2,123
- − Management
- −$2,123
- − Depreciation
- −$4,652
- Taxable income
- $5,486
- Est. tax owed @ 24.0%
- −$1,317
- After-tax cash flow
- $6,388/yr
For passive investors: Depreciation is non-cash, so a rental often shows a tax loss while cash-flowing — sheltering income. Rental losses are passive: they offset passive income freely, and up to $25,000/yr can offset ordinary (W-2) income if you actively participate and your MAGI is under $100k (phasing out to $0 by $150k); unused losses carry forward. On sale, claimed depreciation is recaptured at up to 25%, and gains may owe capital-gains tax (a 1031 exchange can defer both). Figures are a year-1 estimate at your 24.0% rate — not tax advice; consult a CPA.
Condition & rehab AI · 1 photo
This beautifully updated manufactured home in a sought-after community is move-in ready with no visible repairs needed. Painting the exterior and landscaping improvements would significantly enhance its curb appeal and value.
Value-add opportunities
- Both Painting the exterior — Enhances curb appeal and can increase both resale and rental value
- Both Landscaping improvements — Enhances curb appeal and can increase both resale and rental value
Renovation cost estimate screening
Value-add ROI direction
- Both Painting the exterior — Enhances curb appeal and can increase both resale and rental value ↑
- Both Landscaping improvements — Enhances curb appeal and can increase both resale and rental value ↑
ⓘ Cost ranges are severity-bucket heuristics (US national rule-of-thumb). Get contractor quotes + a written scope before underwriting a rehab budget.
Schools (NCES district)
- District
- Lake Havasu Unified District (4368)
- NCES district ID
- 0404280
- Math proficiency
- 39% ▼ -16.00%
- Reading proficiency
- 41% ▼ -8.00%
- Median HH income
- $43,993
- Composite
- 33.92/100
- National rank
- #5339
- State rank
- #66 of 249 in AZ
Livability — Lake Havasu City
- Score
- 63/100
- State rank
- #124
- US rank
- #15839
Category grades
Schools grade is shown separately in the Schools card above.
Census & demographics
- Census place
- Lake Havasu City, AZ
- County
- Mohave County · 181,906 people
- City population
- 62,596
- Metro
- Lake Havasu City-Kingman, AZ
- Population (ZIP)
- 19,234
- Household income
- $72,910
- Rent vs Own
- Severe rent burden
- 343.0
Population outlook (Mohave County) Hauer SSP2
- Today (2025)
- 209,184 people
- By 2030
- 209,674 · +0.2%
- By 2040
- 205,897 · -1.6%
- By 2050
- 196,810 · -5.9%
- By 2075
- 169,454 · -19.0%
- By 2100
- 136,630 · -34.7%
Race, ethnicity, and origin ACS 2023
- Neighborhood character
- Predominantly White (83%)
- Race & ethnicity
- White 83% Hispanic / Latino 12% Two or more races 6%
- Hispanic origin (detail)
- Mexican 10%
- Common ancestry
- Romanian 3% Portuguese 3% Slovak 3%
- Foreign-born
- 5% · Canada
- Languages at home
- 94% English-only · Spanish 5%
Political lean MEDSL · Mohave
- 2024 margin
- Solid R (+55.8) · D 21.8% · R 77.6%
- 2008→2024 swing
- -22.9pp toward R · 2008: -32.9pp · 2024: -55.8pp
- All cycles
- 2024: R+55.8 2020: R+51.3 2016: R+51.5 2012: R+42.6 2008: R+32.9
Not yet ingested
- Civics
- —
Market trends
- HPI YoY
- ▼ -189.23%
- Current HPI
- 402.8832
- Rent YoY
- ▲ 0.66%
- Metro
- Lake Havasu City-Kingman, AZ
- State GDP YoY
- ▲ 4.54%
- F500 in state
- 20
Industry mix (Fortune 500 HQ in AZ)
| Industry | F500 HQs | Revenue |
|---|---|---|
| Technology | 2 | $13B |
|
||
| Mining / Metals | 1 | $23B |
|
||
| Environmental Services | 1 | $16B |
|
||
| Metals / Steel | 1 | $14B |
|
||
| Technology Distribution | 1 | $9B |
|
||
| Homebuilding | 1 | $8B |
|
||
Price history
1 event — show timeline
- 2026-05-29 Listed $159,900 LHAR
Cash-flow waterfall
monthlySold comps — $/sqft
last 12 mo · ≤1 miLoading sold comps…