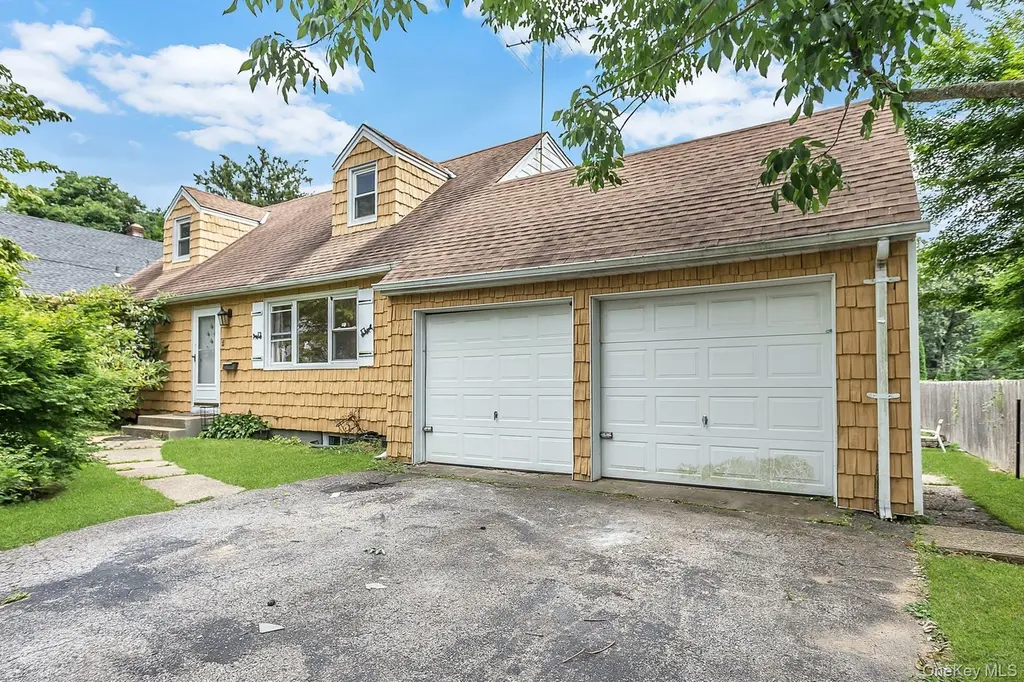
3 Cambridge St · Glen Cove, NY
Flood risk 1/10 · Minimal
- FEMA flood zone
- X (unshaded)
- Chance of flooding over 30 yrs
- 0.0%
- Est. flood insurance / yr
- $473 – $860
Fire risk 3/10 · Minor
- Est. fire insurance / yr
- $691 – $1,283
Heat risk 6/10 · Moderate
- Hot days now (above 97°F)
- 7 days/yr
- Hot days in 30 yrs
- 16 days/yr
Wind risk 6/10 · Moderate
- Chance of severe wind over 30 yrs
- 68.0%
Air-quality risk 5/10 · Moderate
- Unhealthy air days now
- 6 days/yr
- Unhealthy air days in 30 yrs
- 8 days/yr
Risk factors via First Street. Map © Google.
Why this score? — see what drove the C- grade
The composite is a weighted blend of 9 inputs, each scored 0–100. Each bar is that input's sub-score; the figure is the points it added to the 100-point composite (weight × sub-score).
- ARV discount +15.0/15.0
- Cash flow +14.9/30.0
- Schools +4.7/10.0
- DSCR +4.6/10.0
- Rent growth +4.1/5.0
- Livability +3.2/5.0
- 1% rule +3.0/10.0
- Condition / age +2.5/5.0
- Appreciation +0.0/10.0
$699,000
🖨 Deal sheet 📄 Offer letter ✓ Due diligence
Listing remarks MLS
Sprawling & Spectacular 5 Bedroom Home Offering 4 Full Baths, Gleaming Hardwood Floors, Cooks Gourmet Kitchen, Full Finished Basement, 2 Car Garage. Large Entertaining Living Room, Dining Room, Updated Bathrooms. First Floor offers Living Room, Kitchen, Dining, 2 bedrooms and hall full bath. 2nd Floor offers Primary Bedroom with Primary bathroom and WIC, 2 Additional bedrooms and hall full bath. Basement has den, office, playroom, utilities, laundry, bath, outside entrance. Currently Tenant Occupied. Will be delivered vacant.
Key facts
- 7,500 sq ft lot
- 2 garage spots
- Built 1960
Neighborhood map
What this means for you Summary
Snapshot
- This is a 5-bed/3.0-bath single-family listed at $699k.
Deal economics
- At list price, monthly cash flow is $202 ($2k/yr) — positive.
- The deal already cash-flows at list — no discount required.
- To meet the 1% rule (rent ≥ 1% of price), the offer needs to be $559k (20.0% below list).
- Recommended offer: $559k (20.0% below list) — sets the bar for 1% rule.
- Cap rate 6.6% vs local median 3.7% in Glen Cove — top-decile yield for the area; either an underpriced asset or a hidden risk that comps aren't pricing in. Stress-test before assuming the spread holds.
Location & tenants
- Location reads 65/100 on livability (#685 in NY) — a middle-class / working-renter tenant base. Strengths: crime A+, employment A+; Watch: schools C-, housing C-, amenities F.
- Glen Cove City School District (suburban): math 50% / reading 55% proficiency, ranked #312 of 590 in NY (top 53%) — acceptable for families but not a draw, mixed tenant base, ~2y average lease.
- Market conditions: Rents rising fast (+6.4%/yr); 144 active listings in the ZIP; 5 comparable units currently listed for rent nearby; rentals at typical pace (median 15d on market — plan ~3-4 weeks tenant-placement turnaround); solid renter incomes; 824 units permitted in Nassau County in 2024 (153 in 5+ unit buildings).
- At $5,589/mo this rent would consume 72% of the median local household income ($93k/yr) (locally 1667% of renters already pay >50% of income on rent) — very limited rent-growth headroom before tenants either downsize or default.
Forward outlook
- Local home prices are declining (-3.0%/yr); year-one equity from $5k of loan paydown is wiped out by about $21k of value loss. Plan a longer hold.
- Nassau County population projected at +7% by 2050 — modest demand growth; plan on rents tracking national, not racing it.
Negotiation context
- It's been on market 75 days — a 6% lower offer ($657k) is reasonable based on typical stale-listing flexibility.
- 5 sale attempts since 11y ago; this cycle's ask has dropped $101k (13%) from the opening price — seller is motivated, your offer sets the floor, not the list.
- Current owner paid $470k; 49% above their basis — modest negotiation headroom, anchor on the comps not their cost.
Risks & watch-outs
- Climate carrying-cost: major wind risk, 68% chance of damaging wind over 30y; extreme-heat days projected 7→16/yr by 2055 (HVAC capex compounding) — expect insurance premiums to compound above CPI over the hold.
Questions for the listing agent
- It's been on market 75 days. Have you received any prior offers? Is the seller open to a 20% concession, seller financing, or rate buy-down credit?
- Built in 1960 — when were the roof, HVAC, electrical panel, plumbing, and water heater last replaced?
- Why hasn't it sold? Are there any deal-killer items the seller is aware of (foundation, flood, title, zoning, code violations)?
- Is there a deadline driving the sale (1031 exchange, divorce, estate, relocation)? That informs how much negotiation room exists.
- What's the average days-on-market for RENTAL listings here right now (not sales)? A rising rental-DOM trend means longer vacancies and softer asking-rent achievability than the comps imply.
- What's the recent tenant-quality profile in this submarket — average credit score on applications, eviction rate, late-payment / NSF rate, and stable-employment percentage? A property-management company in the area should have these aggregated.
- How much new for-sale + rental construction is in the pipeline within 1–3 miles? Heavy new supply typically softens prices + rents 12–24 months out; constrained supply supports both.
Investment metrics
- 1% rule
- 0.80% ✗
- Cap rate
- 6.64%
- Cash-on-cash
- 1.24%
- DSCR
- 1.06
- GRM
- 10.4
CMA / ARV
- ARV (median comp)
- $866,458
- List price
- $699,000
- Delta
- -19.33%
- Verdict
- UNDERPRICED
- Comps
- 20 within 1.0 mi
Show comp detail 8 sales within ~0.75 mi
| Address | Dist | Beds/Ba | Sqft | Sold | Price | $/sf | Match |
|---|---|---|---|---|---|---|---|
| 8 Cambridge | 0.04mi | 4/2.5 (-1) | 1,626 (-3%) | 6mo | $600,000 | $369 | 81 |
| 17 Meadowfield | 0.39mi | 4/2.0 (-1) | 1,532 (-9%) | 1mo | $879,000 | $574 | 57 |
| 4 Timber Rd | 0.45mi | 4/3.0 (-1) | 1,824 (+8%) | 5mo | $800,000 | $439 | 56 |
| 4 Avenue B | 0.45mi | 5/2.0 | 1,666 (-1%) | 22mo | $856,000 | $514 | 55 |
| 47 10th St | 0.48mi | 4/2.0 (-1) | 1,562 (-7%) | 5mo | $685,000 | $439 | 52 |
| 27 9th St | 0.53mi | 4/1.5 (-1) | 1,562 (-7%) | 9mo | $640,000 | $410 | 44 |
| 10 Circle Dr | 0.71mi | 4/2.0 (-1) | 1,600 (-5%) | 21mo | $668,000 | $418 | 32 |
| 22 Town Path | 0.67mi | 4/2.0 (-1) | 1,877 (+12%) | 13mo | $660,000 | $352 | 30 |
Match score weights: distance 35% · size 25% · config 20% · recency 20%. Top-matched comps best support the ARV.
Projected returns pro-forma
-3.0% appreciation · 6.43% rent growth · sell at horizon
- IRR
- -11.0%
- Equity multiple
- 0.59×
- Total profit
- $-80,759
- Equity at exit
- $104,223
- IRR
- 2.1%
- Equity multiple
- 1.17×
- Total profit
- $32,894
- Equity at exit
- $60,437
Cash invested: $195,720 (down + closing). Projections, not guarantees.
Landlord ↔ Tenant lean methodology
- Overall (STATE)
- 15 Strongly Tenant-Friendly
- State New York
- 15 Strongly Tenant-Friendly · D+10
- County
- — inherits STATE
- City
- — inherits STATE
ZIP-level market 11542
- Rents YoY
- 6.4%
- Active inventory
- 144
- Price-to-rent
- 10.4×
Monthly cashflow live
- Estimated rent
- $5,589 high interval (Pro) →
- Mortgage (P&I)
- −$3,666
- Tax from tax record
- −$257 /mo · $3,084/yr
- Insurance
- −$291
- HOA
- −$0
- Vacancy / Maint / Mgmt
- −$1,174
- Net cashflow
- $202
Break-even live
UW: 25.0% down · 7.5% · 30yr · 1.5% tax · 5.0% vac · 8.0% maint · 8.0% mgmt
Financing live
Cash to close
- Down payment
- $174,750
- Closing costs
- $20,970
- Reserves months
- —
- Total cash needed
- —
Loan-product check · same deal, 3 products live
Conventional
25% down · 7.5% · 30yr
- Down + closing
- —
- Monthly P&I
- —
- Monthly cashflow
- —
- DSCR
- —
- Eligible?
- —
Personal DTI + credit; lowest rate.
DSCR
20% down · 8.5% · 30yr
- Down + closing
- —
- Monthly P&I
- —
- Monthly cashflow
- —
- DSCR
- —
- Eligible?
- —
No personal income docs; deal must DSCR.
Hard money
10% down · 12.0% · 12mo
- Down + closing
- —
- Monthly P&I
- —
- Monthly cashflow
- —
- DSCR
- —
- Eligible?
- —
Short-term bridge; refi at stabilization.
Rent comps 5 comps
| Address | Beds | Baths | Sqft | Rent | $/sqft | DOM | Units | Dist |
|---|---|---|---|---|---|---|---|---|
| 21 Franklin Ave Glen Cove, NY | 4.0 | 2.0 | 1467 | $5,400 | $3.68 | 11d | 1 | 0.54mi |
| 26 Purdue Rd Glen Cove, NY | 4.0 | 2.0 | 1500 | $4,800 | $3.20 | 24d | 1 | 0.55mi |
| 41 S 4th St Locust Valley, NY | 5.0 | 2.5 | 1853 | $6,300 | $3.40 | 15d | 1 | 0.85mi |
| 29 Birch St Locust Valley, NY | 4.0 | 4.0 | 2200 | $6,200 | $2.82 | 43d | 1 | 1.01mi |
| 8 Lee Gray Ct Glen Cove, NY | 4.0 | 2.5 | 1900 | $4,800 | $2.53 | 1d | 1 | 1.11mi |
Listing history 12 events
-
2026-04-21status Active 541-char remark
Show marketing remark (541 chars)
Sprawling & Spectacular 5 Bedroom Home Offering 4 Full Baths, Gleaming Hardwood Floors, Cooks Gourmet Kitchen, Full Finished Basement, 2 Car Garage. Large Entertaining Living Room, Dining Room, Updated Bathrooms. First Floor offers Living Room, Kitchen, Dining, 2 bedrooms and hall full bath. 2nd Floor offers Primary Bedroom with Primary bathroom and WIC, 2 Additional bedrooms and hall full bath. Basement has den, office, playroom, utilities, laundry, bath, outside entrance. Currently Tenant Occupied. Will be delivered vacant.
-
2026-03-25price $699,000 541-char remark
Show marketing remark (541 chars)
Sprawling & Spectacular 5 Bedroom Home Offering 4 Full Baths, Gleaming Hardwood Floors, Cooks Gourmet Kitchen, Full Finished Basement, 2 Car Garage. Large Entertaining Living Room, Dining Room, Updated Bathrooms. First Floor offers Living Room, Kitchen, Dining, 2 bedrooms and hall full bath. 2nd Floor offers Primary Bedroom with Primary bathroom and WIC, 2 Additional bedrooms and hall full bath. Basement has den, office, playroom, utilities, laundry, bath, outside entrance. Currently Tenant Occupied. Will be delivered vacant.
-
2026-03-07$800,000 Active 541-char remark
Show marketing remark (541 chars)
Sprawling & Spectacular 5 Bedroom Home Offering 4 Full Baths, Gleaming Hardwood Floors, Cooks Gourmet Kitchen, Full Finished Basement, 2 Car Garage. Large Entertaining Living Room, Dining Room, Updated Bathrooms. First Floor offers Living Room, Kitchen, Dining, 2 bedrooms and hall full bath. 2nd Floor offers Primary Bedroom with Primary bathroom and WIC, 2 Additional bedrooms and hall full bath. Basement has den, office, playroom, utilities, laundry, bath, outside entrance. Currently Tenant Occupied. Will be delivered vacant.
-
2016-10-04soldstatus $470,000
-
2016-09-23soldstatus $470,000 306-char remark
Show marketing remark (306 chars)
An Updated 5 Bedroom Home With A Brand New Kitchen With New Appliances, Formal Dining Room. New Baths. Wood Floor Throughout. Spacious Backyard. Mid Block Location. Open And Spacious, Ideal For Entertaining. Totally Renovated. Just Walk In With Your Toothbrush!!!, Additional information: Appearance:Mint
-
2016-09-23soldstatus $470,000 Closed
Show marketing remark (306 chars)
An Updated 5 Bedroom Home With A Brand New Kitchen With New Appliances, Formal Dining Room. New Baths. Wood Floor Throughout. Spacious Backyard. Mid Block Location. Open And Spacious, Ideal For Entertaining. Totally Renovated. Just Walk In With Your Toothbrush!!!, Additional information: Appearance:Mint
-
2016-08-04status Under Contract
-
2016-06-20$469,000 New
Show marketing remark (306 chars)
An Updated 5 Bedroom Home With A Brand New Kitchen With New Appliances, Formal Dining Room. New Baths. Wood Floor Throughout. Spacious Backyard. Mid Block Location. Open And Spacious, Ideal For Entertaining. Totally Renovated. Just Walk In With Your Toothbrush!!!, Additional information: Appearance:Mint
-
2016-06-20$469,000 306-char remark
Show marketing remark (306 chars)
An Updated 5 Bedroom Home With A Brand New Kitchen With New Appliances, Formal Dining Room. New Baths. Wood Floor Throughout. Spacious Backyard. Mid Block Location. Open And Spacious, Ideal For Entertaining. Totally Renovated. Just Walk In With Your Toothbrush!!!, Additional information: Appearance:Mint
-
2016-06-05historical
-
2015-12-18$499,000
-
2015-06-26soldstatus $90,000
ⓘ Source: listings_history table (triggers on properties + properties_extension) + one-shot
backfill from property_details.listing_events for pre-trigger history.
Tax reassessment forecast NY · Partial reset (capped growth)
- Current annual tax
- $3,084 · $257/mo
- Projected year-2 tax
- $7,449 · $621/mo
- Expected delta
- +$4,364/yr (+$364/mo · 141.5%)
ⓘ Screening estimate from a state-policy table — verify with the county assessor before closing.
Climate risk First Street
- Flood 1/10 Low FEMA zone X (unshaded) · 0% chance over 30 yrs
- Wildfire 3/10 Moderate
- Heat 6/10 Major 7 d/yr ≥97°F today · 16 d/yr by 30 yrs out
- Wind 6/10 Major 68% chance of damaging wind over 30 yrs
- Air quality 5/10 Major 6 unhealthy d/yr today · 8 by 30 yrs out
Nearby sold comps map
Loading sold comps map…
Walkable amenities ~0.75 mi
Loading nearby amenities…
Taxation est. · year 1
- Rental income
- $67,073
- − Mortgage interest
- −$39,155
- − Property taxes
- −$3,084
- − Insurance
- −$3,495
- − Repairs & maintenance
- −$5,366
- − Management
- −$5,366
- − Depreciation
- −$20,335
- Taxable loss
- −$9,727
- Est. tax savings @ 24.0%
- +$2,334
- After-tax cash flow
- $4,756/yr
For passive investors: Depreciation is non-cash, so a rental often shows a tax loss while cash-flowing — sheltering income. Rental losses are passive: they offset passive income freely, and up to $25,000/yr can offset ordinary (W-2) income if you actively participate and your MAGI is under $100k (phasing out to $0 by $150k); unused losses carry forward. On sale, claimed depreciation is recaptured at up to 25%, and gains may owe capital-gains tax (a 1031 exchange can defer both). Figures are a year-1 estimate at your 24.0% rate — not tax advice; consult a CPA.
Schools (NCES district)
- District
- Glen Cove City School District
- NCES district ID
- 3612180
- Math proficiency
- 50% ▼ -5.00%
- Reading proficiency
- 55% ▲ 6.00%
- Median HH income
- $70,021
- Composite
- 46.76/100
- National rank
- #2391
- State rank
- #312 of 590 in NY
Livability — Glen Cove
- Score
- 65/100
- State rank
- #685
- US rank
- #12441
Category grades
Schools grade is shown separately in the Schools card above.
Census & demographics
- Census place
- Glen Cove, NY
- County
- Nassau County · 653,051 people
- City population
- 28,965
- Metro
- New York-Newark-Jersey City, NY-NJ-PA
- Population (ZIP)
- 28,965
- Household income
- $93,242
- Rent vs Own
- Severe rent burden
- 1667.0
Population outlook (Nassau County) Hauer SSP2
- Today (2025)
- 1,409,302 people
- By 2030
- 1,431,482 · +1.6%
- By 2040
- 1,471,607 · +4.4%
- By 2050
- 1,502,845 · +6.6%
- By 2075
- 1,575,403 · +11.8%
- By 2100
- 1,554,356 · +10.3%
Race, ethnicity, and origin ACS 2023
- Neighborhood character
- Diverse neighborhood (Simpson 0.57)
- Race & ethnicity
- White 56% Hispanic / Latino 32% Two or more races 14% Asian 5% Black 4%
- Hispanic origin (detail)
- Mexican 2% Puerto Rican 4% Dominican 3%
- Common ancestry
- Romanian 5% Scotch-Irish 2% Italian 1%
- Foreign-born
- 28% · Canada, China, Jamaica
- Languages at home
- 60% English-only · Spanish 27% Other Indo-European 9% Chinese 1%
Political lean MEDSL · Nassau
- 2024 margin
- Toss-up / Even · D 47.9% · R 52.1%
- 2008→2024 swing
- -12.6pp toward R · 2008: 8.4pp · 2024: -4.2pp
- All cycles
- 2024: R+4.2 2020: D+9.5 2016: D+5.3 2012: D+6.7 2008: D+8.4
Not yet ingested
- Civics
- —
Market trends
- HPI YoY
- ▼ -377.99%
- Current HPI
- 275.1903
- Rent YoY
- ▲ 6.43%
- Metro
- New York-Newark-Jersey City, NY-NJ-PA
- State GDP YoY
- ▲ 2.60%
- F500 in state
- 92
Industry mix (Fortune 500 HQ in NY)
| Industry | F500 HQs | Revenue |
|---|---|---|
| Financial Services | 10 | $950B |
|
||
| Consumer Goods | 9 | $162B |
|
||
| Insurance | 4 | $225B |
|
||
| Telecommunications | 2 | $144B |
|
||
| Pharmaceuticals | 2 | $112B |
|
||
| Media / Entertainment | 2 | $69B |
|
||
Price history
+676.7% since first listed12 events — show timeline
- 2026-04-21 Relisted — OneKey® MLS as Distributed by MLS Grid
- 2026-03-25 Price Changed $699,000 OneKey® MLS as Distributed by MLS Grid
- 2026-03-07 Listed $800,000 OneKey® MLS as Distributed by MLS Grid
- 2016-10-04 Sold (Public Records) $470,000 Public Records
- 2016-09-23 Sold (MLS) $470,000 OneKey® MLS as Distributed by MLS Grid
- 2016-09-23 Sold (MLS) $470,000 MLSLI
- 2016-08-04 Pending — MLSLI
- 2016-06-20 Listed $469,000 MLSLI
- 2016-06-20 Listed $469,000 OneKey® MLS as Distributed by MLS Grid
- 2016-06-05 Listing Removed — OneKey® MLS as Distributed by MLS Grid
- 2015-12-18 Listed $499,000 OneKey® MLS as Distributed by MLS Grid
- 2015-06-26 Sold (Public Records) $90,000 Public Records
Property tax history
+0.5%/yrLatest (2024): $3,084 · -4.8% YoY. Source: county tax records.
Cash-flow waterfall
monthlySold comps — $/sqft
last 12 mo · ≤1 miLoading sold comps…