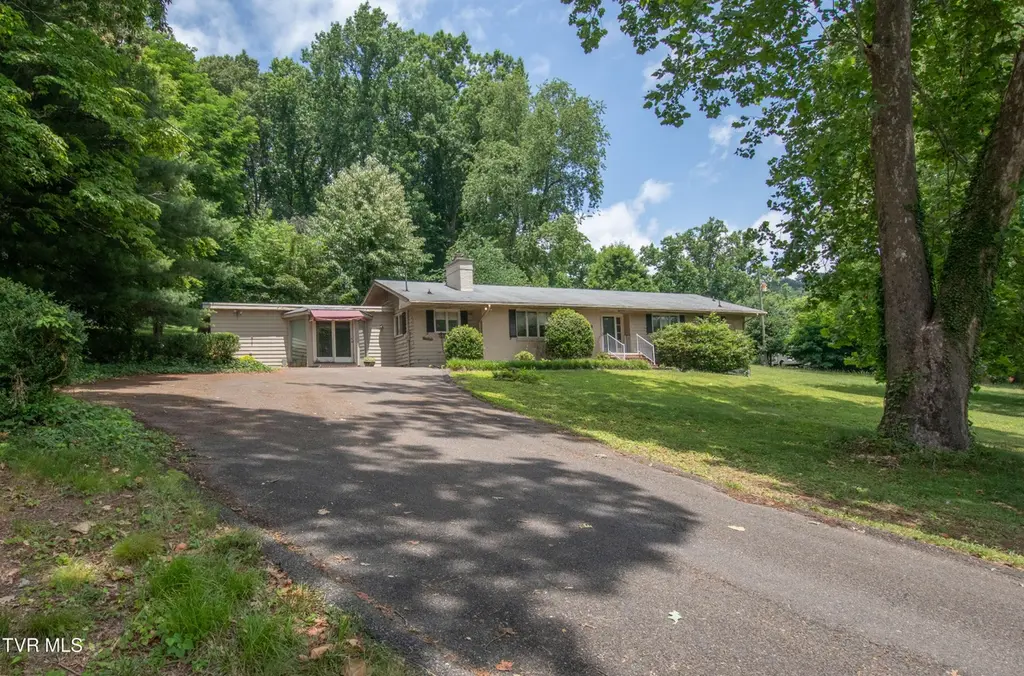
417 Meadow Dr · Bristol, VA
Flood risk 1/10 · Minimal
- FEMA flood zone
- X (unshaded)
- Chance of flooding over 30 yrs
- 0.0%
- Est. flood insurance / yr
- $473 – $860
Fire risk 3/10 · Minor
- Est. fire insurance / yr
- $666 – $1,236
Heat risk 4/10 · Minor
- Hot days now (above 97°F)
- 7 days/yr
- Hot days in 30 yrs
- 21 days/yr
Wind risk 2/10 · Minimal
- Chance of severe wind over 30 yrs
- —
Air-quality risk 2/10 · Minimal
- Unhealthy air days now
- 1 days/yr
- Unhealthy air days in 30 yrs
- 2 days/yr
Risk factors via First Street. Map © Google.
Why this score? — see what drove the D+ grade
The composite is a weighted blend of 9 inputs, each scored 0–100. Each bar is that input's sub-score; the figure is the points it added to the 100-point composite (weight × sub-score).
- ARV discount +15.0/15.0
- Cash flow +12.8/30.0
- Schools +5.2/10.0
- DSCR +3.8/10.0
- Livability +3.7/5.0
- 1% rule +2.7/10.0
- Rent growth +2.5/5.0
- Condition / age +2.5/5.0
- Appreciation +0.0/10.0
$245,000
🖨 Deal sheet 📄 Offer letter ✓ Due diligence
Listing remarks
As I walked through this home, I kept noticing the things that made me linger a little longer: the mature trees stretching across the yard, the orginal hardwood floors, the built-in bookcase beside the fireplace, and the feeling that this is a home that has been lived in and loved. Set on approximately an acre in one of the Bristol's most desirable neighborhoods, this property offers the kind of space that can accommodate lots of needs. There are three bedrooms, three bathrooms, a spacious kitchen, formal dining room, and a comfortable living room centered around a gas fireplace. The former garage has been converted into finished living space and could serve as a den, playroom, home office,
Key facts
- Flexible space
- Bonus room
- Finished basement
Tags
Property features AI
Exterior
- Parking: Asphalt parking
- Utilities: Public water; Public sewer
- Home design: Single-family house; One level
- Construction: Brick, wood siding, and plaster construction; Below-grade finished area present
- Exterior features: Shingle roof; Sloped lot
Interior
- Bedrooms: Total rooms: 8
- Flooring: Hardwood
- Bathrooms: 3 full bathrooms
- Heating & cooling: Heat pump heating; Heat pump cooling
- Interior features: Hardwood floors; Gas log fireplace in the living room; Partially finished basement
Neighborhood map
What this means for you Summary
Snapshot
- This is a 3-bed/3.0-bath single-family listed at $245k.
Deal economics
- At list price, monthly cash flow is $-20 ($-245/yr) — negative.
- To cash-flow at today's rent, offer at most $241k (1.5% below list).
- To meet the 1% rule (rent ≥ 1% of price), the offer needs to be $189k (22.8% below list).
- Recommended offer: $189k (22.8% below list) — sets the bar for 1% rule.
- Cap rate 6.2% vs local median 4.9% in Bristol — meaningfully above typical; check what's discounted (condition, days-on-market, listing class) to confirm the premium yield is real.
Location & tenants
- Location reads 74/100 on livability (#140 in VA, #4,544 nationally) — a middle-class / working-renter tenant base. Strengths: cost of living A+, housing A+, health & safety A+; Watch: crime F, commute F, employment F.
- Bristol City Public School District (urban): math 57% / reading 70% proficiency, ranked #53 of 131 in VA (top 40%) — acceptable for families but not a draw, mixed tenant base, ~2y average lease.
- Zoned schools: Washington-Lee Elementary (math 62% / reading 62%, grade B, #480 of 1,108 statewide, top 46%, 224 students, 98% FRL); Virginia Middle (math 56% / reading 71%, grade B+, #128 of 342 statewide, top 39%, 487 students, 101% FRL); Virginia High (math 62% / reading 77%, grade B, #159 of 319 statewide, top 53%, 637 students, 100% FRL) — zoned schools average 100% FRL vs 58% district-wide (42 pts higher); higher-poverty schools than district average — tighter screening recommended.
- Market conditions: 156 active listings in the ZIP; 3 comparable units currently listed for rent nearby; rentals leasing fast (median 13d on market — plan ~1-2 weeks tenant-placement turnaround); 15 units permitted in Bristol city in 2024 (5 in 5+ unit buildings).
Forward outlook
- Local home prices are declining (-3.0%/yr); year-one equity from $2k of loan paydown is wiped out by about $7k of value loss. Plan a longer hold.
- Bristol County population projected at -20% by 2050 — secular population decline; favor cash flow + early exit over multi-decade hold.
Negotiation context
- Only 6 days on market — expect competitive offers; lowballing is unlikely to land.
- Current owner paid $195k; 26% above their basis — modest negotiation headroom, anchor on the comps not their cost.
Risks & watch-outs
- Watch-outs: built in 1957 — expect roof / HVAC / electrical / plumbing capex.
Questions for the listing agent
- What do current leases actually rent for vs. the listed asking? Can we see a recent rent roll and the last 12 months of T-12 income?
- Built in 1957 — when were the roof, HVAC, electrical panel, plumbing, and water heater last replaced?
- Is there a deadline driving the sale (1031 exchange, divorce, estate, relocation)? That informs how much negotiation room exists.
- Schools are A-rated — typically a magnet for longer-tenancy family renters. What's the average tenant stay here, and is there a school-zone premium baked into asking?
- Crime grade is F in this area — have there been break-ins, vandalism, or insurance claims at this property in the last 3 years? What carrier currently insures it and at what premium?
- The area grade is low — what's the realistic commute time and amenity access for the typical tenant pool here? Any planned neighborhood developments (good or bad) we should know about?
- What's the average days-on-market for RENTAL listings here right now (not sales)? A rising rental-DOM trend means longer vacancies and softer asking-rent achievability than the comps imply.
- What's the recent tenant-quality profile in this submarket — average credit score on applications, eviction rate, late-payment / NSF rate, and stable-employment percentage? A property-management company in the area should have these aggregated.
- How much new for-sale + rental construction is in the pipeline within 1–3 miles? Heavy new supply typically softens prices + rents 12–24 months out; constrained supply supports both.
Investment metrics
- 1% rule
- 0.77% ✗
- Cap rate
- 6.19%
- Cash-on-cash
- -0.36%
- DSCR
- 0.98
- GRM
- 10.8
CMA / ARV
- ARV (on-the-fly)
- $334,207
- Comps found
- 12
Show comp detail 12 sales within ~0.75 mi
| Address | Dist | Beds/Ba | Sqft | Sold | Price | $/sf | Match |
|---|---|---|---|---|---|---|---|
| 1091 Long Crescent Dr Dr | 0.12mi | 4/3.0 (+1) | 2,287 (+2%) | 6mo | $386,000 | $169 | 81 |
| 169 Forest Ln | 0.35mi | 3/3.0 | 2,253 (+0%) | 8mo | $257,630 | $114 | 76 |
| 549 Garden Ln | 0.21mi | 3/2.5 | 2,136 (-5%) | 10mo | $287,500 | $135 | 72 |
| 698 Garden Ln | 0.32mi | 3/2.0 | 2,136 (-5%) | 1mo | $265,000 | $124 | 72 |
| 290 Valley Drive Dr | 0.60mi | 3/2.0 | 2,245 (+0%) | 3mo | $343,500 | $153 | 65 |
| 536 Meadow Dr | 0.18mi | 3/2.0 | 1,924 (-14%) | 7mo | $235,000 | $122 | 58 |
| 1605 Overhill Rd | 0.39mi | 3/2.0 | 2,463 (+10%) | 6mo | $310,000 | $126 | 57 |
| 980 Edgewood Ln | 0.34mi | 3/3.0 | 2,572 (+15%) | 7mo | $382,500 | $149 | 54 |
| 180 Green Hill Rd | 0.60mi | 3/2.0 | 2,056 (-8%) | 2mo | $410,000 | $199 | 52 |
| 275 Shipley Dr | 0.44mi | 3/2.0 | 2,575 (+15%) | 9mo | $357,000 | $139 | 43 |
| 2146 Lee Hwy | 0.75mi | 3/2.0 | 2,406 (+7%) | 11mo | $475,000 | $197 | 40 |
| 431 Arlington Ave | 0.68mi | 3/2.0 | 1,951 (-13%) | 4mo | $335,000 | $172 | 40 |
Match score weights: distance 35% · size 25% · config 20% · recency 20%. Top-matched comps best support the ARV.
Projected returns pro-forma
-3.0% appreciation · 3.0% rent growth · sell at horizon
- IRR
- -16.9%
- Equity multiple
- 0.40×
- Total profit
- $-41,081
- Equity at exit
- $36,530
- IRR
- -8.9%
- Equity multiple
- 0.45×
- Total profit
- $-37,775
- Equity at exit
- $21,183
Cash invested: $68,600 (down + closing). Projections, not guarantees.
Landlord ↔ Tenant lean methodology
- Overall (STATE)
- 55 Moderately Landlord-Leaning
- State Virginia
- 55 Moderately Landlord-Leaning · D+2
- County
- — inherits STATE
- City
- — inherits STATE
ZIP-level market 24201
- Active inventory
- 156
- Price-to-rent
- 10.8×
Monthly cashflow live
- Estimated rent
- $1,892 medium interval (Pro) →
- Mortgage (P&I)
- −$1,285
- Tax from tax record
- −$128 /mo · $1,541/yr
- Insurance
- −$102
- HOA
- −$0
- Vacancy / Maint / Mgmt
- −$397
- Net cashflow
- $-20
Break-even live
UW: 25.0% down · 7.5% · 30yr · 1.5% tax · 5.0% vac · 8.0% maint · 8.0% mgmt
Financing live
Cash to close
- Down payment
- $61,250
- Closing costs
- $7,350
- Reserves months
- —
- Total cash needed
- —
Loan-product check · same deal, 3 products live
Conventional
25% down · 7.5% · 30yr
- Down + closing
- —
- Monthly P&I
- —
- Monthly cashflow
- —
- DSCR
- —
- Eligible?
- —
Personal DTI + credit; lowest rate.
DSCR
20% down · 8.5% · 30yr
- Down + closing
- —
- Monthly P&I
- —
- Monthly cashflow
- —
- DSCR
- —
- Eligible?
- —
No personal income docs; deal must DSCR.
Hard money
10% down · 12.0% · 12mo
- Down + closing
- —
- Monthly P&I
- —
- Monthly cashflow
- —
- DSCR
- —
- Eligible?
- —
Short-term bridge; refi at stabilization.
Rent comps 3 comps
| Address | Beds | Baths | Sqft | Rent | $/sqft | DOM | Units | Dist |
|---|---|---|---|---|---|---|---|---|
| 970 Long Crescent Dr Bristol, VA | 3.0 | 2.0 | 1886 | $1,850 | $0.98 | 13d | 1 | 0.06mi |
| 314 Crossway Rd Bristol, VA | 2.0 | 2.0 | 1909 | $1,800 | $0.94 | 13d | 1 | 0.68mi |
| 3189 Island Rd Bristol, VA | 3.0 | 1.5 | 2492 | $2,400 | $0.96 | 13d | 1 | 0.97mi |
Listing history 7 events
-
2026-06-19days on market $245,000 Active 6 DOM
-
2026-06-18days on market $245,000 Active 5 DOM
-
2026-06-17days on market $245,000 Active 4 DOM
-
2026-06-16days on market $245,000 Active 3 DOM
-
2026-06-15days on market $245,000 Active 2 DOM
-
2026-06-14remarks 699-char remark
-
2026-06-14$245,000 Active 1 DOM
ⓘ Source: listings_history table (triggers on properties + properties_extension) + one-shot
backfill from property_details.listing_events for pre-trigger history.
Tax reassessment forecast VA · Resets to sale price
- Current annual tax
- $1,541 · $128/mo
- Projected year-2 tax
- $2,009 · $167/mo
- Expected delta
- +$468/yr (+$39/mo · 30.4%)
ⓘ Screening estimate from a state-policy table — verify with the county assessor before closing.
Climate risk First Street
- Flood 1/10 Low FEMA zone X (unshaded) · 0% chance over 30 yrs
- Wildfire 3/10 Moderate
- Heat 4/10 Moderate 7 d/yr ≥97°F today · 21 d/yr by 30 yrs out
- Wind 2/10 Low
- Air quality 2/10 Low 1 unhealthy d/yr today · 2 by 30 yrs out
Nearby sold comps map
Loading sold comps map…
Walkable amenities ~0.75 mi
Loading nearby amenities…
Taxation est. · year 1
- Rental income
- $22,707
- − Mortgage interest
- −$13,724
- − Property taxes
- −$1,541
- − Insurance
- −$1,225
- − Repairs & maintenance
- −$1,817
- − Management
- −$1,817
- − Depreciation
- −$7,127
- Taxable loss
- −$4,543
- Est. tax savings @ 24.0%
- +$1,090
- After-tax cash flow
- $845/yr
For passive investors: Depreciation is non-cash, so a rental often shows a tax loss while cash-flowing — sheltering income. Rental losses are passive: they offset passive income freely, and up to $25,000/yr can offset ordinary (W-2) income if you actively participate and your MAGI is under $100k (phasing out to $0 by $150k); unused losses carry forward. On sale, claimed depreciation is recaptured at up to 25%, and gains may owe capital-gains tax (a 1031 exchange can defer both). Figures are a year-1 estimate at your 24.0% rate — not tax advice; consult a CPA.
Schools (NCES district)
- District
- Bristol City Public School District
- NCES district ID
- 5100450
- Math proficiency
- 57% ▼ -24.00%
- Reading proficiency
- 70% ▼ -6.00%
- Median HH income
- $33,978
- Composite
- 52.4/100
- National rank
- #1579
- State rank
- #53 of 131 in VA
Livability — Bristol
- Score
- 74/100
- State rank
- #140
- US rank
- #4544
Category grades
Schools grade is shown separately in the Schools card above.
Census & demographics
- Census place
- Bristol, VA
- City population
- 16,039
- Population (ZIP)
- 16,039
Population outlook (Bristol County) Hauer SSP2
- Today (2025)
- 16,113 people
- By 2030
- 15,510 · -3.7%
- By 2040
- 14,121 · -12.4%
- By 2050
- 12,847 · -20.3%
- By 2075
- 9,870 · -38.7%
- By 2100
- 7,883 · -51.1%
Race, ethnicity, and origin ACS 2023
- Neighborhood character
- Predominantly White (85%)
- Race & ethnicity
- White 85% Black 7% Two or more races 6% Hispanic / Latino 3%
- Common ancestry
- Slovak 4% Serbian 1% Iranian 0%
- Foreign-born
- 1% · Canada
- Languages at home
- 98% English-only · Spanish 2%
Political lean MEDSL · Bristol
- 2024 margin
- Solid R (+39.7) · D 29.8% · R 69.5%
- 2008→2024 swing
- -13.6pp toward R · 2008: -26.0pp · 2024: -39.7pp
- All cycles
- 2024: R+39.7 2020: R+38.9 2016: R+43.8 2012: R+31.1 2008: R+26.0
Not yet ingested
- Civics
- —
Market trends
- HPI YoY
- ▼ -206.40%
- Current HPI
- 196.2099
- Rent YoY
- —
- Metro
- —
- State GDP YoY
- ▲ 2.40%
- F500 in state
- 50
Industry mix (Fortune 500 HQ in VA)
| Industry | F500 HQs | Revenue |
|---|---|---|
| Aerospace / Defense | 4 | $236B |
|
||
| Technology / Defense | 3 | $32B |
|
||
| Financial Services | 2 | $176B |
|
||
| Utilities | 2 | $27B |
|
||
| Insurance | 2 | $25B |
|
||
| Technology | 2 | $15B |
|
||
Price history
+40.0% since first listed3 events — show timeline
- 2026-06-13 Listed $245,000 TVRMLS
- 2011-03-25 Sold (Public Records) $195,000 Public Records
- 2008-01-16 Sold (Public Records) $175,000 Public Records
Cash-flow waterfall
monthlySold comps — $/sqft
last 12 mo · ≤1 miLoading sold comps…